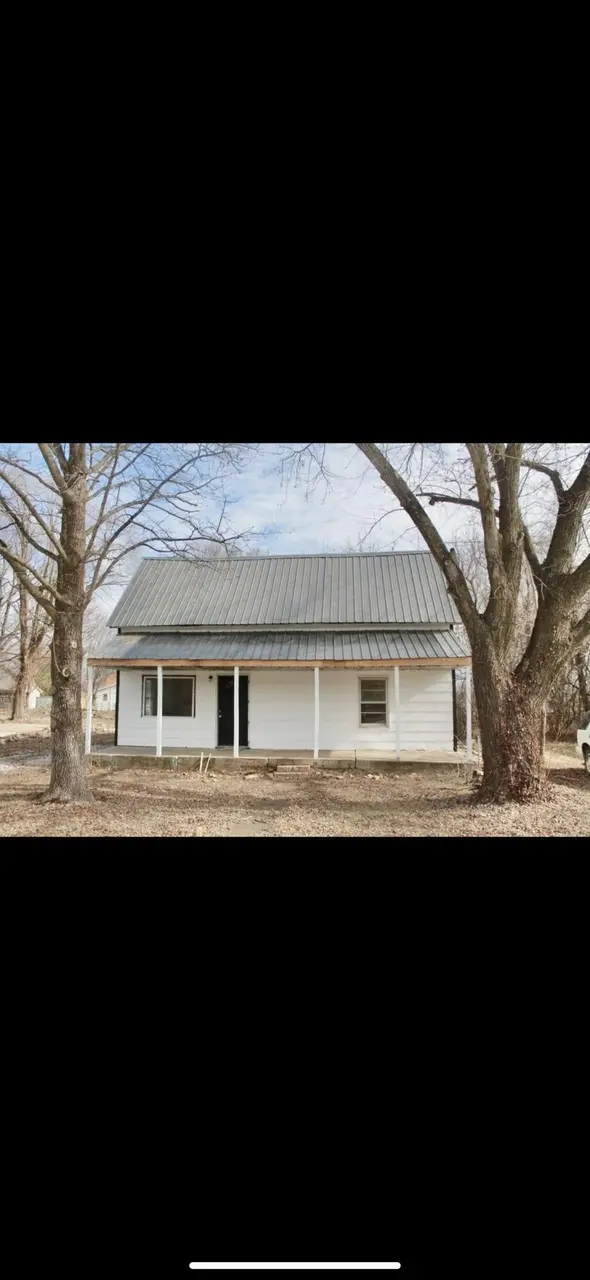
25981 Missouri 64 · Hermitage, MO
Flood risk 1/10 · Minimal
- FEMA flood zone
- —
- Chance of flooding over 30 yrs
- 0.0%
- Est. flood insurance / yr
- —
Fire risk 3/10 · Minor
- Est. fire insurance / yr
- $1,054 – $1,958
Heat risk 4/10 · Minor
- Hot days now (above 108°F)
- 7 days/yr
- Hot days in 30 yrs
- 19 days/yr
Wind risk 2/10 · Minimal
- Chance of severe wind over 30 yrs
- —
Air-quality risk 2/10 · Minimal
- Unhealthy air days now
- 0 days/yr
- Unhealthy air days in 30 yrs
- 1 days/yr
Risk factors via First Street. Map © Google.
Why this score? — see what drove the C+ grade
The composite is a weighted blend of 9 inputs, each scored 0–100. Each bar is that input's sub-score; the figure is the points it added to the 100-point composite (weight × sub-score).
- Cash flow +24.7/30.0
- Appreciation +10.0/10.0
- DSCR +8.0/10.0
- 1% rule +6.4/10.0
- Schools +4.1/10.0
- Livability +2.7/5.0
- Rent growth +2.5/5.0
- Condition / age +2.5/5.0
- ARV discount +0.0/15.0
$105,000
🖨 Deal sheet (PDF) 📄 Offer letter ✓ Due diligence
Listing remarks MLS
If you have been searching for a home close to the lake that is affordable, here ya go!! Huge yard with plenty of space to house all of your lake toys and boats! Call your trusted agent and grab this home before Spring! Added bonus. .. Southwest Electric Coop means more money to play on the lake.
Key facts
- Huge yard
- Close to the lake
- 0.36 acre lot
Tags
Neighborhood map
What this means for you Summary
Snapshot
- This is a 4-bed/2.0-bath other listed at $105k.
Deal economics
- At list price, monthly cash flow is $220 ($3k/yr) — positive.
- The deal already cash-flows at list — no discount required.
- Meets the 1% rule at list price ($1k rent vs $105k).
- Recommended offer: $96k (9.0% below list) — sets the bar for market timing.
- Cap rate 8.8% vs local median 3.3% in Hermitage — top-decile yield for the area; either an underpriced asset or a hidden risk that comps aren't pricing in. Stress-test before assuming the spread holds.
Location & tenants
- Location reads 54/100 on livability (#788 in MO) — a working-class tenant base; expect higher turnover. Strengths: cost of living A+, housing B; Watch: crime F, amenities F, commute F.
- Hermitage R-IV (rural): math 45% / reading 50% proficiency, ranked #185 of 535 in MO (top 35%) — families likely to look elsewhere, expect single-tenant / working-renter base with shorter leases.
- Zoned schools: Hermitage Elem. (math 47% / reading 47%, grade D-, #347 of 1,115 statewide, top 35%, 138 students, 58% FRL); Hermitage Middle (math 24% / reading 44%, grade F, #243 of 391 statewide, top 65%, 50 students, 44% FRL); Hermitage High (math 10% / reading 50%, grade F, #377 of 521 statewide, top 73%, 81 students, 51% FRL).
- Market conditions: 45 active listings in the ZIP.
Forward outlook
- In year one you build about $11k of equity ($726 loan paydown + $10k appreciation (10.0% local appreciation)).
- Hickory County population projected at -26% by 2050 — secular population decline; favor cash flow + early exit over multi-decade hold.
- At projected returns (10.0% appreciation + 3.0% rent growth), your $29k cash investment doubles in ~3 years — after that, you're playing with house money.
- By year 4, paydown + projected appreciation supports a ~$40k cash-out refi (75% LTV) — recoverable capital for the next deal without selling this one.
Negotiation context
- It's been on market 112 days — a 9% lower offer ($96k) is reasonable based on typical stale-listing flexibility.
Risks & watch-outs
- Watch-outs: built in 1930 — expect roof / HVAC / electrical / plumbing capex.
Questions for the listing agent
- It's been on market 112 days. Have you received any prior offers? Is the seller open to a 9% concession, seller financing, or rate buy-down credit?
- Built in 1930 — when were the roof, HVAC, electrical panel, plumbing, and water heater last replaced?
- Why hasn't it sold? Are there any deal-killer items the seller is aware of (foundation, flood, title, zoning, code violations)?
- Is there a deadline driving the sale (1031 exchange, divorce, estate, relocation)? That informs how much negotiation room exists.
- Schools are D-rated, which usually means shorter tenancies and higher turnover. Who's the typical renter profile here, and what's been the actual vacancy rate?
- Crime grade is F in this area — have there been break-ins, vandalism, or insurance claims at this property in the last 3 years? What carrier currently insures it and at what premium?
- What's the average days-on-market for RENTAL listings here right now (not sales)? A rising rental-DOM trend means longer vacancies and softer asking-rent achievability than the comps imply.
- What's the recent tenant-quality profile in this submarket — average credit score on applications, eviction rate, late-payment / NSF rate, and stable-employment percentage? A property-management company in the area should have these aggregated.
- How much new for-sale + rental construction is in the pipeline within 1–3 miles? Heavy new supply typically softens prices + rents 12–24 months out; constrained supply supports both.
Investment metrics
- 1% rule
- 1.14% ✓
- Cap rate
- 8.81%
- Cash-on-cash
- 9.00%
- DSCR
- 1.40
- GRM
- 7.3
CMA / ARV
- ARV (median comp)
- $76,414
- List price
- $105,000
- Delta
- 37.41%
- Verdict
- OVERPRICED
- Comps
- 2 within 1.0 mi
Projected returns pro-forma
10.0% appreciation · 3.0% rent growth · sell at horizon
- IRR
- 30.9%
- Equity multiple
- 3.42×
- Total profit
- $71,245
- Equity at exit
- $94,592
- IRR
- 26.7%
- Equity multiple
- 7.76×
- Total profit
- $198,800
- Equity at exit
- $203,992
Cash invested: $29,400 (down + closing). Projections, not guarantees.
Landlord ↔ Tenant lean methodology
- Overall (STATE)
- 81 Strongly Landlord-Friendly
- State Missouri
- 81 Strongly Landlord-Friendly · R+10
- County
- — inherits STATE
- City
- — inherits STATE
ZIP-level market 65724
- Home prices YoY
- 5.4%
- Active inventory
- 45
- Price-to-rent
- 7.3×
Monthly cashflow live
- Estimated rent
- $1,198 medium interval (Pro) →
- Mortgage (P&I)
- −$551
- Tax est. 1.5%
- −$131 /mo · $1,575/yr
- Insurance
- −$44
- HOA
- −$0
- Vacancy / Maint / Mgmt
- −$251
- Net cashflow
- $220
Break-even live
Sensitivity live
| Price | -10% $293 | -5% $257 | +0% $220 | +5% $184 | +10% $148 |
|---|---|---|---|---|---|
| Rent | -10% $126 | -5% $173 | +0% $220 | +5% $268 | +10% $315 |
| Rate | -1.0pp $273 | -0.5pp $247 | base $220 | +0.5pp $193 | +1.0pp $166 |
UW: 25.0% down · 7.5% · 30yr · 1.5% tax · 5.0% vac · 8.0% maint · 8.0% mgmt
Financing live
Cash to close
- Down payment
- $26,250
- Closing costs
- $3,150
- Reserves months
- —
- Total cash needed
- —
Loan-product check · same deal, 3 products live
Conventional
25% down · 7.5% · 30yr
- Down + closing
- —
- Monthly P&I
- —
- Monthly cashflow
- —
- DSCR
- —
- Eligible?
- —
Personal DTI + credit; lowest rate.
DSCR
20% down · 8.5% · 30yr
- Down + closing
- —
- Monthly P&I
- —
- Monthly cashflow
- —
- DSCR
- —
- Eligible?
- —
No personal income docs; deal must DSCR.
Hard money
10% down · 12.0% · 12mo
- Down + closing
- —
- Monthly P&I
- —
- Monthly cashflow
- —
- DSCR
- —
- Eligible?
- —
Short-term bridge; refi at stabilization.
Listing history 19 events
-
2026-06-21days on market $105,000 Active 112 DOM
-
2026-06-21days on market $105,000 Active 111 DOM
-
2026-06-18days on market $105,000 Active 109 DOM
-
2026-06-17days on market $105,000 Active 108 DOM
-
2026-06-16days on market $105,000 Active 107 DOM
-
2026-06-15days on market $105,000 Active 106 DOM
-
2026-06-13days on market $105,000 Active 104 DOM
-
2026-06-12days on market $105,000 Active 103 DOM
-
2026-06-09days on market $105,000 Active 100 DOM
-
2026-06-08days on market $105,000 Active 99 DOM
-
2026-06-07days on market $105,000 Active 98 DOM
-
2026-06-07days on market $105,000 Active 97 DOM
-
2026-06-04days on market $105,000 Active 94 DOM
-
2026-06-02days on market $105,000 Active 93 DOM
-
2026-06-01days on market $105,000 Active 92 DOM
-
2026-05-31days on market $105,000 Active 91 DOM
-
2026-03-13price $105,000 298-char remark
Show marketing remark (298 chars)
If you have been searching for a home close to the lake that is affordable, here ya go!! Huge yard with plenty of space to house all of your lake toys and boats! Call your trusted agent and grab this home before Spring! Added bonus. .. Southwest Electric Coop means more money to play on the lake.
-
2026-03-02$129,000 Active 298-char remark
Show marketing remark (298 chars)
If you have been searching for a home close to the lake that is affordable, here ya go!! Huge yard with plenty of space to house all of your lake toys and boats! Call your trusted agent and grab this home before Spring! Added bonus. .. Southwest Electric Coop means more money to play on the lake.
-
2024-06-17soldstatus
ⓘ Source: listings_history table (triggers on properties + properties_extension) + one-shot
backfill from property_details.listing_events for pre-trigger history.
Climate risk First Street
- Flood 1/10 Low 0% chance over 30 yrs
- Wildfire 3/10 Moderate
- Heat 4/10 Moderate 7 d/yr ≥108°F today · 19 d/yr by 30 yrs out
- Wind 2/10 Low
- Air quality 2/10 Low 0 unhealthy d/yr today · 1 by 30 yrs out
Nearby sold comps map
Loading sold comps map…
Walkable amenities ~0.75 mi
Loading nearby amenities…
Taxation est. · year 1
- Rental income
- $14,371
- − Mortgage interest
- −$5,882
- − Property taxes
- −$1,575
- − Insurance
- −$525
- − Repairs & maintenance
- −$1,150
- − Management
- −$1,150
- − Depreciation
- −$3,055
- Taxable income
- $1,036
- Est. tax owed @ 24.0%
- −$249
- After-tax cash flow
- $2,397/yr
For passive investors: Depreciation is non-cash, so a rental often shows a tax loss while cash-flowing — sheltering income. Rental losses are passive: they offset passive income freely, and up to $25,000/yr can offset ordinary (W-2) income if you actively participate and your MAGI is under $100k (phasing out to $0 by $150k); unused losses carry forward. On sale, claimed depreciation is recaptured at up to 25%, and gains may owe capital-gains tax (a 1031 exchange can defer both). Figures are a year-1 estimate at your 24.0% rate — not tax advice; consult a CPA.
Schools (NCES district)
- District
- Hermitage R-IV
- NCES district ID
- 2914310
- Math proficiency
- 45% ▬ 0.00%
- Reading proficiency
- 50% ▲ 5.00%
- Median HH income
- $30,066
- Composite
- 40.92/100
- National rank
- #7513
- State rank
- #185 of 535 in MO
Livability — Hermitage
- Score
- 54/100
- State rank
- #788
- US rank
- #23974
Category grades
Schools grade is shown separately in the Schools card above.
Census & demographics
- Population (ZIP)
- 1,728
Population outlook (Hickory County) Hauer SSP2
- Today (2025)
- 8,206 people
- By 2030
- 7,690 · -6.3%
- By 2040
- 6,780 · -17.4%
- By 2050
- 6,076 · -26.0%
- By 2075
- 5,088 · -38.0%
- By 2100
- 4,489 · -45.3%
Race, ethnicity, and origin ACS 2023
- Neighborhood character
- Predominantly White (98%)
- Race & ethnicity
- White 98%
- Common ancestry
- Italian 17% Lithuanian 4% Iranian 1%
- Languages at home
- 97% English-only · German/W. Germanic 3%
Political lean MEDSL · Hickory
- 2024 margin
- Solid R (+61.1) · D 19.1% · R 80.2%
- 2008→2024 swing
- -47.9pp toward R · 2008: -13.3pp · 2024: -61.1pp
- All cycles
- 2024: R+61.1 2020: R+57.3 2016: R+53.5 2012: R+23.6 2008: R+13.3
Not yet ingested
- Civics
- —
Market trends
- HPI YoY
- ▲ 11.14%
- Current HPI
- 216.4684
- Rent YoY
- —
- Metro
- —
- State GDP YoY
- ▲ 1.84%
- F500 in state
- 20
Industry mix (Fortune 500 HQ in MO)
| Industry | F500 HQs | Revenue |
|---|---|---|
| Healthcare | 1 | $163B |
|
||
| Insurance | 1 | $21B |
|
||
| Industrial Technology | 1 | $17B |
|
||
| Retail | 1 | $16B |
|
||
| Industrial Distribution | 1 | $10B |
|
||
| Utilities | 1 | $9B |
|
||
Price history
-18.6% since first listed3 events — show timeline
- 2026-03-13 Price Changed $105,000 SOMO
- 2026-03-02 Listed $129,000 SOMO
- 2024-06-17 Sold (Public Records) — Public Records
Property tax history
+1.7%/yrLatest (2025): $194 · +7.7% YoY. Source: county tax records.
Cash-flow waterfall
monthlySold comps — $/sqft
last 12 mo · ≤1 miLoading sold comps…