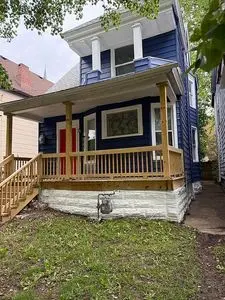
79 California St · Buffalo, NY
Flood risk 1/10 · Minimal
- FEMA flood zone
- X (unshaded)
- Chance of flooding over 30 yrs
- 0.0%
- Est. flood insurance / yr
- $473 – $860
Fire risk 1/10 · Minimal
- Est. fire insurance / yr
- $691 – $1,283
Heat risk 3/10 · Minor
- Hot days now (above 92°F)
- 7 days/yr
- Hot days in 30 yrs
- 14 days/yr
Wind risk 1/10 · Minimal
- Chance of severe wind over 30 yrs
- —
Air-quality risk 4/10 · Minor
- Unhealthy air days now
- 4 days/yr
- Unhealthy air days in 30 yrs
- 9 days/yr
Risk factors via First Street. Map © Google.
Why this score? — see what drove the B+ grade
The composite is a weighted blend of 9 inputs, each scored 0–100. Each bar is that input's sub-score; the figure is the points it added to the 100-point composite (weight × sub-score).
- Cash flow +27.2/30.0
- ARV discount +15.0/15.0
- DSCR +9.5/10.0
- Appreciation +8.8/10.0
- 1% rule +6.1/10.0
- Livability +3.9/5.0
- Schools +3.3/10.0
- Condition / age +2.5/5.0
- Rent growth +2.4/5.0
$169,900
🖨 Deal sheet 📄 Offer letter ✓ Due diligence
Listing remarks MLS
GREAT POTENTIAL FAMILY HOME OR INCOME PRODUCER SPACIOUS 4 BR NEEDS UPDATES REPAIRS CASH REAHB MTG ONLY
Key facts
- New furnace
- Remodeled bathroom
- Remodeled kitchen
Tags
Property features AI
Exterior
- Home design: Single-family residence
- Construction: Built in 1920; Living area approximately 1766
- Exterior features: Property built in 1920
Interior
- Interior features: Located in the Grant Ferry subdivision
Neighborhood map
What this means for you Summary
Snapshot
- This is a 4-bed/1.0-bath single-family listed at $170k.
Deal economics
- At list price, monthly cash flow is $488 ($6k/yr) — positive.
- The deal already cash-flows at list — no discount required.
- Meets the 1% rule at list price ($2k rent vs $170k).
- Recommended offer: $167k (1.5% below list) — sets the bar for market timing.
- Cap rate 9.7% vs local median 8.0% in Buffalo — meaningfully above typical; check what's discounted (condition, days-on-market, listing class) to confirm the premium yield is real.
Location & tenants
- Location reads 77/100 on livability (#195 in NY, #3,011 nationally) — a middle-class / working-renter tenant base. Strengths: commute A+, housing A+, health & safety A+; Watch: crime F, employment D-.
- Buffalo City School District (urban): math 41% / reading 40% proficiency, ranked #535 of 590 in NY (top 91%) — families likely to look elsewhere, expect single-tenant / working-renter base with shorter leases; 75% free/reduced lunch — lower-income household profile, screen leases tightly.
- Market conditions: Rents soft (-0.5%/yr); 137 active listings in the ZIP; 15 comparable units currently listed for rent nearby; rentals at typical pace (median 20d on market — plan ~3-4 weeks tenant-placement turnaround); 1,244 units permitted in Erie County in 2024 (563 in 5+ unit buildings).
- This rent runs 42% of the median local income ($54k/yr) — at the standard rent-burdened threshold; future hikes will face affordability resistance.
Forward outlook
- In year one you build about $14k of equity ($1k loan paydown + $13k appreciation (7.5% local appreciation)).
- At projected returns (7.5% appreciation + 0.0% rent growth), your $48k cash investment doubles in ~3 years — after that, you're playing with house money.
- By year 3, paydown + projected appreciation supports a ~$35k cash-out refi (75% LTV) — recoverable capital for the next deal without selling this one.
Negotiation context
- It's been on market 21 days — a 2% lower offer ($167k) is reasonable based on typical stale-listing flexibility.
- 2 sale attempts since 17y ago; this cycle's ask has dropped $45k (21%) from the opening price — seller is motivated, your offer sets the floor, not the list.
- Current owner paid $4k; list at $170k implies a 4256% gain — meaningful room to come down on a strong offer.
Risks & watch-outs
- Watch-outs: built in 1920 — expect roof / HVAC / electrical / plumbing capex.
Questions for the listing agent
- Built in 1920 — when were the roof, HVAC, electrical panel, plumbing, and water heater last replaced?
- Is there a deadline driving the sale (1031 exchange, divorce, estate, relocation)? That informs how much negotiation room exists.
- Crime grade is F in this area — have there been break-ins, vandalism, or insurance claims at this property in the last 3 years? What carrier currently insures it and at what premium?
- What's the average days-on-market for RENTAL listings here right now (not sales)? A rising rental-DOM trend means longer vacancies and softer asking-rent achievability than the comps imply.
- What's the recent tenant-quality profile in this submarket — average credit score on applications, eviction rate, late-payment / NSF rate, and stable-employment percentage? A property-management company in the area should have these aggregated.
- How much new for-sale + rental construction is in the pipeline within 1–3 miles? Heavy new supply typically softens prices + rents 12–24 months out; constrained supply supports both.
Investment metrics
- 1% rule
- 1.11% ✓
- Cap rate
- 9.74%
- Cash-on-cash
- 12.31%
- DSCR
- 1.55
- GRM
- 7.5
CMA / ARV
- ARV (on-the-fly)
- $312,582
- Comps found
- 12
Show comp detail 12 sales within ~0.75 mi
| Address | Dist | Beds/Ba | Sqft | Sold | Price | $/sf | Match |
|---|---|---|---|---|---|---|---|
| 655 Prospect Ave | 0.61mi | 4/2.5 | 1,754 (-1%) | 2mo | $310,000 | $177 | 63 |
| 20 Chenango St | 0.57mi | 4/1.5 | 1,824 (+3%) | 8mo | $175,000 | $96 | 59 |
| 237 Normal Ave | 0.54mi | 4/1.5 | 1,704 (-4%) | 11mo | $185,000 | $109 | 58 |
| 603 W Utica St | 0.29mi | 3/1.0 (-1) | 1,600 (-9%) | 11mo | $122,000 | $76 | 57 |
| 49 Massachusetts Ave | 0.47mi | 3/1.5 (-1) | 1,672 (-5%) | 8mo | $140,000 | $84 | 56 |
| 419 Normal Ave | 0.19mi | 4/2.0 | 1,994 (+13%) | 11mo | $377,000 | $189 | 56 |
| 397 14th St | 0.25mi | 3/1.0 (-1) | 1,519 (-14%) | 10mo | $270,000 | $178 | 52 |
| 254 Hoyt St | 0.75mi | 4/1.5 | 1,866 (+6%) | 4mo | $403,000 | $216 | 50 |
| 362 W Delavan Ave Unit N | 0.74mi | 5/1.5 (+1) | 1,776 (+1%) | 10mo | $322,500 | $182 | 49 |
| 210 Congress St | 0.71mi | 3/1.5 (-1) | 1,636 (-7%) | 5mo | $192,000 | $117 | 43 |
| 15 Greenwood Pl | 0.58mi | 4/2.5 | 1,987 (+12%) | 10mo | $425,000 | $214 | 38 |
| 192 Congress St | 0.69mi | 3/1.0 (-1) | 1,505 (-15%) | 3mo | $155,000 | $103 | 36 |
Match score weights: distance 35% · size 25% · config 20% · recency 20%. Top-matched comps best support the ARV.
Projected returns pro-forma
7.51% appreciation · 0.0% rent growth · sell at horizon
- IRR
- 27.2%
- Equity multiple
- 2.90×
- Total profit
- $90,174
- Equity at exit
- $123,479
- IRR
- 23.7%
- Equity multiple
- 5.80×
- Total profit
- $228,194
- Equity at exit
- $239,949
Cash invested: $47,572 (down + closing). Projections, not guarantees.
Landlord ↔ Tenant lean methodology
- Overall (STATE)
- 15 Strongly Tenant-Friendly
- State New York
- 15 Strongly Tenant-Friendly · D+10
- County
- — inherits STATE
- City
- — inherits STATE
ZIP-level market 14213
- Home prices YoY
- 1.7%
- Rents YoY
- -0.5%
- Active inventory
- 137
- Price-to-rent
- 7.5×
Monthly cashflow live
- Estimated rent
- $1,893 high interval (Pro) →
- Mortgage (P&I)
- −$891
- Tax from tax record
- −$46 /mo · $555/yr
- Insurance
- −$71
- HOA
- −$0
- Vacancy / Maint / Mgmt
- −$398
- Net cashflow
- $488
Break-even live
UW: 25.0% down · 7.5% · 30yr · 1.5% tax · 5.0% vac · 8.0% maint · 8.0% mgmt
Financing live
Cash to close
- Down payment
- $42,475
- Closing costs
- $5,097
- Reserves months
- —
- Total cash needed
- —
Loan-product check · same deal, 3 products live
Conventional
25% down · 7.5% · 30yr
- Down + closing
- —
- Monthly P&I
- —
- Monthly cashflow
- —
- DSCR
- —
- Eligible?
- —
Personal DTI + credit; lowest rate.
DSCR
20% down · 8.5% · 30yr
- Down + closing
- —
- Monthly P&I
- —
- Monthly cashflow
- —
- DSCR
- —
- Eligible?
- —
No personal income docs; deal must DSCR.
Hard money
10% down · 12.0% · 12mo
- Down + closing
- —
- Monthly P&I
- —
- Monthly cashflow
- —
- DSCR
- —
- Eligible?
- —
Short-term bridge; refi at stabilization.
Rent comps 15 comps
| Address | Beds | Baths | Sqft | Rent | $/sqft | DOM | Units | Dist |
|---|---|---|---|---|---|---|---|---|
| 405 W Ferry St Unit Lower Buffalo, NY | 3.0 | 1.0 | 2480 | $1,500 | $0.60 | 44d | 1 | 0.41mi |
| 161 16th St Buffalo, NY | 3.0 | 1.5 | 1500 | $2,000 | $1.33 | 23d | 1 | 0.54mi |
| 83 Baynes St Unit Lower Buffalo, NY | 3.0 | 1.0 | 2550 | $1,850 | $0.73 | 14d | 1 | 0.54mi |
| 501 West Ave Buffalo, NY | 3.0 | 1.0 | 2552 | $1,700 | $0.67 | 14d | 1 | 0.55mi |
| 501 West Ave Buffalo, NY | 3.0 | 1.0 | 2552 | $1,850 | $0.72 | 20d | 1 | 0.55mi |
| 311 Herkimer St #1 Buffalo, NY | 3.0 | 1.0 | 1272 | $1,400 | $1.10 | 14d | 1 | 0.58mi |
| 40 Putnam St Buffalo, NY | 4.0 | 1.0 | 1600 | $2,100 | $1.31 | 23d | 1 | 0.59mi |
| 184 14th St Buffalo, NY | 4.0 | 2.0 | 1950 | $4,400 | $2.26 | 23d | 1 | 0.62mi |
| 124 Normal Ave Unit 2 Buffalo, NY | 3.0 | 1.0 | 1727 | $2,000 | $1.16 | 23d | 1 | 0.74mi |
| 330 Bryant St Buffalo, NY | 3.0 | 2.0 | 2224 | $2,200 | $0.99 | 20d | 1 | 0.80mi |
| 118 Ashland Ave Buffalo, NY | 3.0 | 1.0 | 1326 | $1,850 | $1.40 | 14d | 1 | 0.83mi |
| 740 Elmwood Ave Buffalo, NY | 3.0 | 1.0 | 2000 | $1,995 | $1.00 | 14d | 1 | 0.90mi |
| 550 Busti Ave Unit 2 Buffalo, NY | 3.0 | 1.0 | 1638 | $1,500 | $0.92 | 44d | 1 | 0.96mi |
| 100 Forest Ave Buffalo, NY | 2.0–4.0 | 2.0–4.0 | 1304 | $2,560 | $1.96 | 1d | 14 | 1.08mi |
| 836 Richmond Ave Buffalo, NY | 4.0 | 3.5 | 1982 | $4,500 | $2.27 | 44d | 1 | 1.11mi |
Listing history 21 events
-
2026-06-18days on market $169,900 Active 21 DOM
-
2026-06-17price $169,900 Active 20 DOM
-
2026-06-17days on market $174,900 Active 20 DOM
-
2026-06-16days on market $174,900 Active 19 DOM
-
2026-06-15days on market $174,900 Active 18 DOM
-
2026-06-13days on market $174,900 Active 16 DOM
-
2026-06-13days on market $174,900 Active 15 DOM
-
2026-06-10days on market $174,900 Active 13 DOM
-
2026-06-09days on market $174,900 Active 12 DOM
-
2026-06-08pricedays on market $174,900 Active 11 DOM
-
2026-06-07days on market $189,900 Active 10 DOM
-
2026-06-03days on market $189,900 Active 6 DOM
-
2026-06-02days on market $189,900 Active 5 DOM
-
2026-06-02price $189,900 Active 4 DOM
-
2026-06-01days on market $214,900 Active 4 DOM
-
2026-05-31days on market $214,900 Active 3 DOM
-
2026-05-24$214,900 Active
-
2009-12-21soldstatus $3,900 102-char remark
Show marketing remark (102 chars)
GREAT POTENTIAL FAMILY HOME OR INCOME PRODUCER SPACIOUS 4 BR NEEDS UPDATES REPAIRS CASH REAHB MTG ONLY
-
2009-09-04$4,900 102-char remark
Show marketing remark (102 chars)
GREAT POTENTIAL FAMILY HOME OR INCOME PRODUCER SPACIOUS 4 BR NEEDS UPDATES REPAIRS CASH REAHB MTG ONLY
-
1997-12-15soldstatus $43,000
-
1997-07-01soldstatus $14,000
ⓘ Source: listings_history table (triggers on properties + properties_extension) + one-shot
backfill from property_details.listing_events for pre-trigger history.
Tax reassessment forecast NY · Partial reset (capped growth)
- Current annual tax
- $555 · $46/mo
- Projected year-2 tax
- $1,713 · $143/mo
- Expected delta
- +$1,158/yr (+$97/mo · 208.7%)
ⓘ Screening estimate from a state-policy table — verify with the county assessor before closing.
Climate risk First Street
- Flood 1/10 Low FEMA zone X (unshaded) · 0% chance over 30 yrs
- Wildfire 1/10 Low
- Heat 3/10 Moderate 7 d/yr ≥92°F today · 14 d/yr by 30 yrs out
- Wind 1/10 Low
- Air quality 4/10 Moderate 4 unhealthy d/yr today · 9 by 30 yrs out
Nearby sold comps map
Loading sold comps map…
Walkable amenities ~0.75 mi
Loading nearby amenities…
Taxation est. · year 1
- Rental income
- $22,722
- − Mortgage interest
- −$9,517
- − Property taxes
- −$555
- − Insurance
- −$850
- − Repairs & maintenance
- −$1,818
- − Management
- −$1,818
- − Depreciation
- −$4,943
- Taxable income
- $3,222
- Est. tax owed @ 24.0%
- −$773
- After-tax cash flow
- $5,081/yr
For passive investors: Depreciation is non-cash, so a rental often shows a tax loss while cash-flowing — sheltering income. Rental losses are passive: they offset passive income freely, and up to $25,000/yr can offset ordinary (W-2) income if you actively participate and your MAGI is under $100k (phasing out to $0 by $150k); unused losses carry forward. On sale, claimed depreciation is recaptured at up to 25%, and gains may owe capital-gains tax (a 1031 exchange can defer both). Figures are a year-1 estimate at your 24.0% rate — not tax advice; consult a CPA.
Schools (NCES district)
- District
- Buffalo City School District
- NCES district ID
- 3605850
- Math proficiency
- 41% ▲ 11.00%
- Reading proficiency
- 40% ▲ 7.00%
- Median HH income
- $31,665
- Composite
- 33.17/100
- National rank
- #5544
- State rank
- #535 of 590 in NY
Livability — Buffalo
- Score
- 77/100
- State rank
- #195
- US rank
- #3011
Category grades
Schools grade is shown separately in the Schools card above.
Census & demographics
- Census place
- Buffalo, NY
- County
- Erie County · 714,559 people
- City population
- 440,021
- Metro
- Buffalo-Cheektowaga, NY
- Population (ZIP)
- 24,107
- Household income
- $53,870
- Rent vs Own
- Severe rent burden
- 1501.0
Population outlook (Erie County) Hauer SSP2
- Today (2025)
- 933,037 people
- By 2030
- 935,181 · +0.2%
- By 2040
- 928,531 · -0.5%
- By 2050
- 905,725 · -2.9%
- By 2075
- 834,037 · -10.6%
- By 2100
- 708,033 · -24.1%
Race, ethnicity, and origin ACS 2023
- Neighborhood character
- Highly diverse neighborhood (Simpson 0.70)
- Race & ethnicity
- White 46% Hispanic / Latino 20% Black 18% Asian 12% Two or more races 10%
- Hispanic origin (detail)
- Mexican 1% Puerto Rican 16% Dominican 1%
- Common ancestry
- Romanian 6% Slovak 3% Lithuanian 3%
- Foreign-born
- 16% · Philippines, Canada, India
- Languages at home
- 68% English-only · Spanish 12% Other Asian/Pacific 7% Arabic 3%
Political lean MEDSL · Erie
- 2024 margin
- Lean D (+9.7) · D 54.8% · R 45.2%
- 2008→2024 swing
- -7.9pp toward R · 2008: 17.5pp · 2024: 9.7pp
- All cycles
- 2024: D+9.7 2020: D+14.7 2016: D+4.8 2012: D+15.6 2008: D+17.5
Not yet ingested
- Civics
- —
Market trends
- HPI YoY
- ▲ 7.51%
- Current HPI
- 448.4879
- Rent YoY
- ▼ -0.49%
- Metro
- Buffalo-Cheektowaga, NY
- State GDP YoY
- ▲ 2.60%
- F500 in state
- 92
Industry mix (Fortune 500 HQ in NY)
| Industry | F500 HQs | Revenue |
|---|---|---|
| Financial Services | 10 | $950B |
|
||
| Consumer Goods | 9 | $162B |
|
||
| Insurance | 4 | $225B |
|
||
| Telecommunications | 2 | $144B |
|
||
| Pharmaceuticals | 2 | $112B |
|
||
| Media / Entertainment | 2 | $69B |
|
||
Price history
+1435.0% since first listed5 events — show timeline
- 2026-05-24 Listed $214,900 FSBO.com
- 2009-12-21 Sold (MLS) $3,900 WNYREIS
- 2009-09-04 Listed $4,900 WNYREIS
- 1997-12-15 Sold (Public Records) $43,000 Public Records
- 1997-07-01 Sold (Public Records) $14,000 Public Records
Property tax history
+17.1%/yrLatest (2025): $555 · +0.0% YoY. Source: county tax records.
Cash-flow waterfall
monthlySold comps — $/sqft
last 12 mo · ≤1 miLoading sold comps…