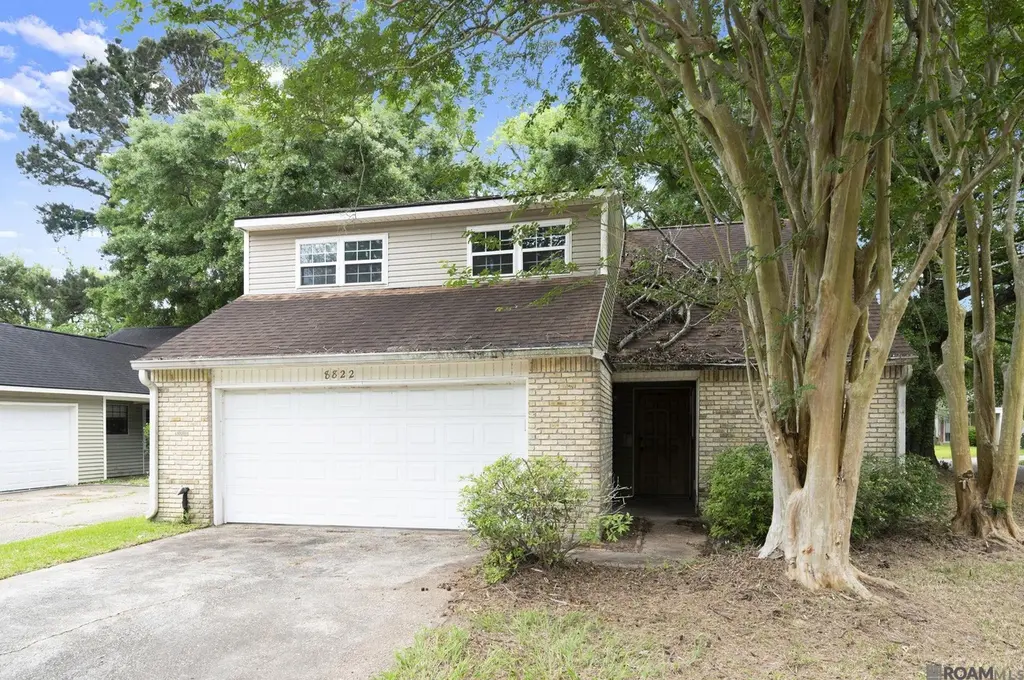
8822 Lochness Ave · Baton Rouge, LA
Flood risk 6/10 · Moderate
- FEMA flood zone
- AE
- Chance of flooding over 30 yrs
- 0.7%
- Est. flood insurance / yr
- $1,737 – $8,500
Fire risk 1/10 · Minimal
- Est. fire insurance / yr
- $1,269 – $2,357
Heat risk 8/10 · Major
- Hot days now (above 108°F)
- 7 days/yr
- Hot days in 30 yrs
- 21 days/yr
Wind risk 9/10 · Severe
- Chance of severe wind over 30 yrs
- 99.0%
Air-quality risk 3/10 · Minor
- Unhealthy air days now
- 3 days/yr
- Unhealthy air days in 30 yrs
- 3 days/yr
Risk factors via First Street. Map © Google.
Why this score? — see what drove the B- grade
The composite is a weighted blend of 9 inputs, each scored 0–100. Each bar is that input's sub-score; the figure is the points it added to the 100-point composite (weight × sub-score).
- Cash flow +30.0/30.0
- 1% rule +10.0/10.0
- DSCR +10.0/10.0
- ARV discount +7.5/15.0
- Livability +3.7/5.0
- Rent growth +2.9/5.0
- Condition / age +2.5/5.0
- Schools +2.4/10.0
- Appreciation +0.0/10.0
$150,000
🖨 Deal sheet 📄 Offer letter ✓ Due diligence
Listing remarks MLS
First Time on the Market Since 1983 -- Where Memories Were Made & Opportunity Awaits This 4-bedroom, 2-bath home has been lovingly maintained by its original owners, who built it and raised their family here. Now, it's ready for a new chapter. Tucked beneath mature trees on a spacious lot, this home offers a functional layout with generous living spaces and plenty of natural light throughout. While the interior remains mostly original, it has been well cared for over the years--making it the perfect canvas for buyers ready to personalize or investors looking for their next project. ? Major updates already completed: * Roof replaced within the last 5 years * HVAC replaced within the last 5 years * Windows replaced within the last 5 years With the big-ticket items already taken care of, you can focus on bringing your vision to life without the heavy upfront expenses. Whether you're looking to renovate, invest, or create your dream home, this property offers the rare combination of solid bones, meaningful history, and undeniable potential. Homes like this don't come around often--schedule your showing and see the opportunity for yourself.
Key facts
- 5,662 sq ft lot
- Garage
- Built 1983
Neighborhood map
What this means for you Summary
Snapshot
- This is a 4-bed/2.0-bath single-family listed at $150k.
Deal economics
- At list price, monthly cash flow is $355 ($4k/yr) — positive.
- The deal already cash-flows at list — no discount required.
- Meets the 1% rule at list price ($2k rent vs $150k).
- Cap rate 12.5% vs local median 4.3% in Baton Rouge — top-decile yield for the area; either an underpriced asset or a hidden risk that comps aren't pricing in. Stress-test before assuming the spread holds.
Location & tenants
- Location reads 74/100 on livability (#24 in LA, #4,535 nationally) — a middle-class / working-renter tenant base. Strengths: commute A+, cost of living A+, health & safety A+; Watch: amenities D, crime F, employment D-.
- East Baton Rouge Parish (urban): math 22% / reading 34% proficiency, ranked #47 of 98 in LA (top 48%) — low school quality limits family demand, transient renter base, plan for 1-2y turnover; 77% free/reduced lunch — lower-income household profile, screen leases tightly.
- Market conditions: Rents rising (+1.5%/yr); 297 active listings in the ZIP; 40 comparable units currently listed for rent nearby; rentals at typical pace (median 24d on market — plan ~3-4 weeks tenant-placement turnaround); 2,252 units permitted in East Baton Rouge Parish in 2024 (440 in 5+ unit buildings).
- This rent runs 39% of the median local income ($69k/yr) — at the standard rent-burdened threshold; future hikes will face affordability resistance.
Forward outlook
- Local home prices are declining (-3.0%/yr); year-one equity from $1k of loan paydown is wiped out by about $4k of value loss. Plan a longer hold.
- East Baton Rouge County population projected at +4% by 2050 — modest demand growth; plan on rents tracking national, not racing it.
Negotiation context
- Only 0 days on market — expect competitive offers; lowballing is unlikely to land.
- 2 sale attempts with the ask held roughly flat each time — persistent listings suggest the price (not the market) is what's stuck; bring a comps-based counter.
Risks & watch-outs
- Watch-outs: flood insurance adds $427/mo.
- Climate carrying-cost: in FEMA flood zone AE (mandatory federal flood insurance); severe wind risk, 99% chance of damaging wind over 30y; extreme-heat days projected 7→21/yr by 2055 (HVAC capex compounding) — expect insurance premiums to compound above CPI over the hold.
Questions for the listing agent
- What's the actual annual flood-insurance premium (NFIP or private), and is the property in a SFHA with mandatory coverage?
- Is there a deadline driving the sale (1031 exchange, divorce, estate, relocation)? That informs how much negotiation room exists.
- Crime grade is F in this area — have there been break-ins, vandalism, or insurance claims at this property in the last 3 years? What carrier currently insures it and at what premium?
- What's the average days-on-market for RENTAL listings here right now (not sales)? A rising rental-DOM trend means longer vacancies and softer asking-rent achievability than the comps imply.
- What's the recent tenant-quality profile in this submarket — average credit score on applications, eviction rate, late-payment / NSF rate, and stable-employment percentage? A property-management company in the area should have these aggregated.
- How much new for-sale + rental construction is in the pipeline within 1–3 miles? Heavy new supply typically softens prices + rents 12–24 months out; constrained supply supports both.
Investment metrics
- 1% rule
- 1.51% ✓
- Cap rate
- 12.54%
- Cash-on-cash
- 22.32%
- DSCR
- 1.99
- GRM
- 5.5
CMA / ARV
- ARV (on-the-fly)
- $350,610
- Comps found
- 12
Show comp detail 12 sales within ~0.75 mi
| Address | Dist | Beds/Ba | Sqft | Sold | Price | $/sf | Match |
|---|---|---|---|---|---|---|---|
| 8666 Aston Ave | 0.38mi | 4/2.0 | 1,875 (-0%) | 4mo | $310,000 | $165 | 79 |
| 9044 Magnolia View Dr | 0.32mi | 3/2.5 (-1) | 1,928 (+2%) | 3mo | $359,500 | $186 | 72 |
| 8623 Arabella Ave | 0.30mi | 3/2.0 (-1) | 1,990 (+6%) | 2mo | $325,000 | $163 | 70 |
| 736 Portula Ave | 0.49mi | 3/2.0 (-1) | 1,796 (-5%) | 0mo | $335,000 | $187 | 64 |
| 8345 Seville Ct | 0.49mi | 3/2.0 (-1) | 1,722 (-9%) | 1mo | $345,000 | $200 | 57 |
| 425 Portula Ave | 0.42mi | 3/2.0 (-1) | 1,692 (-10%) | 1mo | $315,000 | $186 | 57 |
| 8000 Stonelake Village Ave #101 | 0.64mi | 3/3.5 (-1) | 1,843 (-2%) | 4mo | $255,000 | $138 | 53 |
| 8151 Seville Ct | 0.61mi | 4/3.0 | 2,042 (+8%) | 1mo | $400,000 | $196 | 52 |
| 921 Drago Dr | 0.54mi | 4/2.0 | 1,610 (-15%) | 1mo | $320,000 | $199 | 50 |
| 8929 Worthington Estates Ave | 0.70mi | 4/2.0 | 1,687 (-10%) | 3mo | $275,000 | $163 | 48 |
| 8127 Valencia Ct | 0.63mi | 4/3.0 | 2,088 (+11%) | 3mo | $379,000 | $182 | 46 |
| 1132 Drago Dr | 0.62mi | 4/2.0 | 1,610 (-15%) | 3mo | $306,900 | $191 | 44 |
Match score weights: distance 35% · size 25% · config 20% · recency 20%. Top-matched comps best support the ARV.
Projected returns pro-forma
-3.0% appreciation · 1.54% rent growth · sell at horizon
- IRR
- -3.0%
- Equity multiple
- 0.89×
- Total profit
- $-4,711
- Equity at exit
- $22,365
- IRR
- 4.6%
- Equity multiple
- 1.31×
- Total profit
- $13,059
- Equity at exit
- $12,969
Cash invested: $42,000 (down + closing). Projections, not guarantees.
Landlord ↔ Tenant lean methodology
- Overall (STATE)
- 90 Strongly Landlord-Friendly
- State Louisiana
- 90 Strongly Landlord-Friendly · R+12
- County
- — inherits STATE
- City
- — inherits STATE
ZIP-level market 70808
- Rents YoY
- 1.5%
- Active inventory
- 297
- Price-to-rent
- 5.5×
Monthly cashflow live
- Estimated rent
- $2,265 high interval (Pro) →
- Mortgage (P&I)
- −$787
- Tax from tax record
- −$159 /mo · $1,905/yr
- Insurance
- −$62
- Flood insurance flood zone
- −$427 /mo · $5,118/yr
- HOA
- −$0
- Vacancy / Maint / Mgmt
- −$476
- Net cashflow
- $355
Break-even live
UW: 25.0% down · 7.5% · 30yr · 1.5% tax · 5.0% vac · 8.0% maint · 8.0% mgmt
Financing live
Cash to close
- Down payment
- $37,500
- Closing costs
- $4,500
- Reserves months
- —
- Total cash needed
- —
Loan-product check · same deal, 3 products live
Conventional
25% down · 7.5% · 30yr
- Down + closing
- —
- Monthly P&I
- —
- Monthly cashflow
- —
- DSCR
- —
- Eligible?
- —
Personal DTI + credit; lowest rate.
DSCR
20% down · 8.5% · 30yr
- Down + closing
- —
- Monthly P&I
- —
- Monthly cashflow
- —
- DSCR
- —
- Eligible?
- —
No personal income docs; deal must DSCR.
Hard money
10% down · 12.0% · 12mo
- Down + closing
- —
- Monthly P&I
- —
- Monthly cashflow
- —
- DSCR
- —
- Eligible?
- —
Short-term bridge; refi at stabilization.
Rent comps 40 comps
| Address | Beds | Baths | Sqft | Rent | $/sqft | DOM | Units | Dist |
|---|---|---|---|---|---|---|---|---|
| 777 Hadley Dr Baton Rouge, LA | 3.0 | 2.0 | 1405 | $1,900 | $1.35 | 21d | 1 | 0.34mi |
| 8262 Governor Dr Unit 8262-A Baton Rouge, LA | 3.0 | 3.0 | 1400 | $1,400 | $1.00 | 14d | 1 | 0.36mi |
| 8505 Aston Ave Baton Rouge, LA | 4.0 | 2.0 | 1875 | $2,300 | $1.23 | 14d | 1 | 0.40mi |
| 8220 Governor Dr Baton Rouge, LA | 3.0 | 2.0 | 1350 | $1,350 | $1.00 | 19d | 1 | 0.40mi |
| 8655 Abertay Ave Baton Rouge, LA | 3.0 | 2.0 | 1560 | $2,000 | $1.28 | 23d | 1 | 0.41mi |
| 641 Greenwich Dr Baton Rouge, LA | 3.0 | 2.0 | 1973 | $2,400 | $1.22 | 23d | 1 | 0.43mi |
| 910 Drago Dr Baton Rouge, LA | 3.0 | 2.0 | 1380 | $2,700 | $1.96 | 23d | 1 | 0.52mi |
| 916 Drago Dr Baton Rouge, LA | 4.0 | 2.0 | 1610 | $3,000 | $1.86 | 43d | 1 | 0.53mi |
| 9144 High Point Rd Baton Rouge, LA | 4.0 | 2.0 | 2050 | $2,100 | $1.02 | 23d | 1 | 0.56mi |
| 9144 High Point Rd Baton Rouge, LA | 4.0 | 2.0 | 2050 | $2,100 | $1.02 | 14d | 1 | 0.56mi |
| 943 Renova DR Baton Rouge, LA | 4.0 | 2.0 | 1610 | $2,900 | $1.80 | 43d | 1 | 0.61mi |
| 9537 Kevel Dr Baton Rouge, LA | 3.0 | 2.0 | 2403 | $2,250 | $0.94 | 14d | 1 | 0.63mi |
| 1047 Drago Dr Baton Rouge, LA | 4.0 | 2.0 | 1610 | $3,000 | $1.86 | 43d | 1 | 0.63mi |
| 1045 Renova Dr Baton Rouge, LA | 4.0 | 2.0 | 1610 | $2,950 | $1.83 | 14d | 1 | 0.65mi |
| 560 Staring Ln Baton Rouge, LA | 3.0 | 1.5 | 1423 | $1,750 | $1.23 | 21d | 1 | 0.70mi |
| 8017 Seville Ct Baton Rouge, LA | 3.0 | 2.5 | 1786 | $2,700 | $1.51 | 43d | 1 | 0.71mi |
| 717 Summer Breeze Dr Baton Rouge, LA | 3.0 | 2.0 | 1750 | $2,000 | $1.14 | 23d | 1 | 0.71mi |
| 9176 Boone Dr Baton Rouge, LA | 3.0 | 2.0 | 1469 | $1,950 | $1.33 | 43d | 1 | 0.81mi |
| 8022 Antebellum Ave Baton Rouge, LA | 3.0 | 2.0 | 1510 | $2,100 | $1.39 | 43d | 1 | 0.85mi |
| 7738 Menlo Dr Unit NA Baton Rouge, LA | 3.0 | 2.0 | 2190 | $2,400 | $1.10 | 43d | 1 | 0.89mi |
| 7623 Waterview Dr Baton Rouge, LA | 3.0 | 2.0 | 1933 | $2,650 | $1.37 | 23d | 1 | 0.91mi |
| 1418 Gardenia Ln Baton Rouge, LA | 3.0 | 2.0 | 1812 | $2,350 | $1.30 | 14d | 1 | 0.93mi |
| 9441 Boone Dr Baton Rouge, LA | 3.0 | 2.0 | 1611 | $2,050 | $1.27 | 23d | 1 | 0.96mi |
| 7642 W Pelican Lakes Ave Baton Rouge, LA | 3.0 | 2.0 | 1631 | $2,500 | $1.53 | 21d | 1 | 0.96mi |
| 954 Deer Pass Dr Baton Rouge, LA | 3.0 | 2.0 | 1612 | $2,400 | $1.49 | 43d | 1 | 0.96mi |
| 10157 Bonnet Cove Ave Baton Rouge, LA | 3.0 | 3.0 | 1785 | $1,900 | $1.06 | 43d | 1 | 1.03mi |
| 735 Bromley Dr Baton Rouge, LA | 3.0 | 2.0 | 2000 | $2,300 | $1.15 | 23d | 1 | 1.08mi |
| 9250 Pecan Tree Dr Baton Rouge, LA | 3.0 | 2.0 | 1291 | $1,650 | $1.28 | 23d | 1 | 1.09mi |
| 553 Westhaven Blvd Unit 1519869P Baton Rouge, LA | 3.0 | 2.0 | 1797 | $3,688 | $2.05 | 14d | 1 | 1.10mi |
| 2029 Jasper Ave Unit 2029-D Baton Rouge, LA | 3.0 | 2.0 | 1350 | $1,200 | $0.89 | 44d | 1 | 1.13mi |
| 2029 Jasper Ave Unit 2029-B Baton Rouge, LA | 3.0 | 2.0 | 1350 | $1,250 | $0.93 | 23d | 1 | 1.13mi |
| 7300 Burbank Dr Baton Rouge, LA | 3.0 | 2.0–3.0 | 1427 | $2,475 | $1.73 | 23d | 1 | 1.21mi |
| 7300 Burbank Dr Baton Rouge, LA | 2.0–3.0 | 2.0–3.0 | 1380 | $3,000 | $2.17 | 43d | 3 | 1.21mi |
| 7306 Kenilworth Crossing Ave Baton Rouge, LA | 3.0 | 2.0 | 1613 | $2,700 | $1.67 | 14d | 1 | 1.26mi |
| 7211 Kenilworth Crossing Ave Baton Rouge, LA | 4.0 | 2.5 | 1800 | $3,550 | $1.97 | 14d | 1 | 1.35mi |
| 10600 Lakes Blvd Baton Rouge, LA | 3.0 | 3.0 | 1464 | $1,850 | $1.26 | 43d | 2 | 1.41mi |
| 10600 Lakes Blvd Baton Rouge, LA | 2.0–3.0 | 2.5–3.0 | 1420 | $2,250 | $1.58 | 14d | 4 | 1.41mi |
| 10600 Lakes Blvd Baton Rouge, LA | 1.0–3.0 | 1.0–3.0 | 1425 | $2,100 | $1.47 | 23d | 4 | 1.41mi |
| 10231 Bluebonnet Blvd Baton Rouge, LA | 1.0–3.0 | 1.0–2.0 | 988 | $2,084 | $2.11 | 14d | 21 | 1.46mi |
| 8500 Bluebonnet Blvd #24 Baton Rouge, LA | 3.0 | 2.0 | 1430 | $1,600 | $1.12 | 19d | 1 | 1.46mi |
Listing history 4 events
-
2026-04-17$150,000
Show marketing remark (1157 chars)
First Time on the Market Since 1983 -- Where Memories Were Made & Opportunity Awaits This 4-bedroom, 2-bath home has been lovingly maintained by its original owners, who built it and raised their family here. Now, it's ready for a new chapter. Tucked beneath mature trees on a spacious lot, this home offers a functional layout with generous living spaces and plenty of natural light throughout. While the interior remains mostly original, it has been well cared for over the years--making it the perfect canvas for buyers ready to personalize or investors looking for their next project. ? Major updates already completed: * Roof replaced within the last 5 years * HVAC replaced within the last 5 years * Windows replaced within the last 5 years With the big-ticket items already taken care of, you can focus on bringing your vision to life without the heavy upfront expenses. Whether you're looking to renovate, invest, or create your dream home, this property offers the rare combination of solid bones, meaningful history, and undeniable potential. Homes like this don't come around often--schedule your showing and see the opportunity for yourself.
-
2026-04-17historical
Show marketing remark (1157 chars)
First Time on the Market Since 1983 -- Where Memories Were Made & Opportunity Awaits This 4-bedroom, 2-bath home has been lovingly maintained by its original owners, who built it and raised their family here. Now, it's ready for a new chapter. Tucked beneath mature trees on a spacious lot, this home offers a functional layout with generous living spaces and plenty of natural light throughout. While the interior remains mostly original, it has been well cared for over the years--making it the perfect canvas for buyers ready to personalize or investors looking for their next project. ? Major updates already completed: * Roof replaced within the last 5 years * HVAC replaced within the last 5 years * Windows replaced within the last 5 years With the big-ticket items already taken care of, you can focus on bringing your vision to life without the heavy upfront expenses. Whether you're looking to renovate, invest, or create your dream home, this property offers the rare combination of solid bones, meaningful history, and undeniable potential. Homes like this don't come around often--schedule your showing and see the opportunity for yourself.
-
2026-04-17$150,000 1157-char remark
Show marketing remark (1157 chars)
First Time on the Market Since 1983 -- Where Memories Were Made & Opportunity Awaits This 4-bedroom, 2-bath home has been lovingly maintained by its original owners, who built it and raised their family here. Now, it's ready for a new chapter. Tucked beneath mature trees on a spacious lot, this home offers a functional layout with generous living spaces and plenty of natural light throughout. While the interior remains mostly original, it has been well cared for over the years--making it the perfect canvas for buyers ready to personalize or investors looking for their next project. ? Major updates already completed: * Roof replaced within the last 5 years * HVAC replaced within the last 5 years * Windows replaced within the last 5 years With the big-ticket items already taken care of, you can focus on bringing your vision to life without the heavy upfront expenses. Whether you're looking to renovate, invest, or create your dream home, this property offers the rare combination of solid bones, meaningful history, and undeniable potential. Homes like this don't come around often--schedule your showing and see the opportunity for yourself.
-
1983-11-23soldstatus
ⓘ Source: listings_history table (triggers on properties + properties_extension) + one-shot
backfill from property_details.listing_events for pre-trigger history.
Tax reassessment forecast LA · Resets to sale price
- Current annual tax
- $1,905 · $159/mo
- Projected year-2 tax
- $1,905 · $159/mo
- Expected delta
- $0/yr ($0/mo · 0.0%)
ⓘ Screening estimate from a state-policy table — verify with the county assessor before closing.
Climate risk First Street
- Flood 6/10 Major FEMA zone AE · 70% chance over 30 yrs
- Wildfire 1/10 Low
- Heat 8/10 Severe 7 d/yr ≥108°F today · 21 d/yr by 30 yrs out
- Wind 9/10 Extreme 99% chance of damaging wind over 30 yrs
- Air quality 3/10 Moderate 3 unhealthy d/yr today · 3 by 30 yrs out
Nearby sold comps map
Loading sold comps map…
Walkable amenities ~0.75 mi
Loading nearby amenities…
Taxation est. · year 1
- Rental income
- $27,177
- − Mortgage interest
- −$8,402
- − Property taxes
- −$1,905
- − Insurance
- −$5,868
- − Repairs & maintenance
- −$2,174
- − Management
- −$2,174
- − Depreciation
- −$4,364
- Taxable income
- $2,290
- Est. tax owed @ 24.0%
- −$550
- After-tax cash flow
- $3,708/yr
For passive investors: Depreciation is non-cash, so a rental often shows a tax loss while cash-flowing — sheltering income. Rental losses are passive: they offset passive income freely, and up to $25,000/yr can offset ordinary (W-2) income if you actively participate and your MAGI is under $100k (phasing out to $0 by $150k); unused losses carry forward. On sale, claimed depreciation is recaptured at up to 25%, and gains may owe capital-gains tax (a 1031 exchange can defer both). Figures are a year-1 estimate at your 24.0% rate — not tax advice; consult a CPA.
Schools (NCES district)
- District
- East Baton Rouge Parish
- NCES district ID
- 2200540
- Math proficiency
- 22% ▼ -36.00%
- Reading proficiency
- 34% ▼ -31.00%
- Median HH income
- $46,263
- Composite
- 24.14/100
- National rank
- #7745
- State rank
- #47 of 98 in LA
Livability — Baton Rouge
- Score
- 74/100
- State rank
- #24
- US rank
- #4535
Category grades
Schools grade is shown separately in the Schools card above.
Census & demographics
- Census place
- Baton Rouge, LA
- County
- East Baton Rouge Parish · 399,686 people
- City population
- 351,868
- Metro
- Baton Rouge, LA
- Population (ZIP)
- 35,843
- Household income
- $69,418
- Rent vs Own
- Severe rent burden
- 2545.0
Population outlook (East Baton Rouge County) Hauer SSP2
- Today (2025)
- 464,810 people
- By 2030
- 472,137 · +1.6%
- By 2040
- 480,243 · +3.3%
- By 2050
- 484,422 · +4.2%
- By 2075
- 492,069 · +5.9%
- By 2100
- 476,347 · +2.5%
Race, ethnicity, and origin ACS 2023
- Neighborhood character
- Predominantly White (66%)
- Race & ethnicity
- White 66% Black 20% Two or more races 7% Hispanic / Latino 6% Asian 5%
- Hispanic origin (detail)
- Mexican 1%
- Common ancestry
- Lithuanian 12% Slovak 2% Romanian 2%
- Foreign-born
- 8% · Canada, China, Vietnam
- Languages at home
- 90% English-only · Spanish 2% French/Haitian/Cajun 2% Other Indo-European 1%
Political lean MEDSL · East Baton Rouge
- 2024 margin
- D (+11.1) · D 54.5% · R 43.4% · Other 2.1%
- 2008→2024 swing
- +8.9pp toward D · 2008: 2.2pp · 2024: 11.1pp
- All cycles
- 2024: D+11.1 2020: D+13.1 2016: D+9.2 2012: D+5.2 2008: D+2.2
Not yet ingested
- Civics
- —
Market trends
- HPI YoY
- ▼ -351.73%
- Current HPI
- 196.4406
- Rent YoY
- ▲ 1.54%
- Metro
- Baton Rouge, LA
- State GDP YoY
- ▲ 3.29%
- F500 in state
- 10
Industry mix (Fortune 500 HQ in LA)
| Industry | F500 HQs | Revenue |
|---|---|---|
| Telecommunications | 2 | $23B |
|
||
| Utilities | 1 | $12B |
|
||
| Wholesale / Distribution | 1 | $5B |
|
||
| Advertising | 1 | $2B |
|
||
Price history
+0.0% since first listed4 events — show timeline
- 2026-04-17 Listed $150,000 AcadianaMLS
- 2026-04-17 Delisted — GBRMLS
- 2026-04-17 Listed $150,000 GBRMLS
- 1983-11-23 Sold (Public Records) — Public Records
Property tax history
+5.4%/yrLatest (2025): $1,905 · +4.5% YoY. Source: county tax records.
Cash-flow waterfall
monthlySold comps — $/sqft
last 12 mo · ≤1 miLoading sold comps…