2609 S County Rd 1058 · Midland, TX
Flood risk 1/10 · Minimal
- FEMA flood zone
- X
- Chance of flooding over 30 yrs
- 0.0%
- Est. flood insurance / yr
- $507 – $1,088
Fire risk 7/10 · Major
- Est. fire insurance / yr
- $1,222 – $2,270
Heat risk 6/10 · Moderate
- Hot days now (above 102°F)
- 7 days/yr
- Hot days in 30 yrs
- 21 days/yr
Wind risk 3/10 · Minor
- Chance of severe wind over 30 yrs
- 7.0%
Air-quality risk 1/10 · Minimal
- Unhealthy air days now
- 0 days/yr
- Unhealthy air days in 30 yrs
- 0 days/yr
Risk factors via First Street. Map © Google.
Why this score? — see what drove the C- grade
The composite is a weighted blend of 9 inputs, each scored 0–100. Each bar is that input's sub-score; the figure is the points it added to the 100-point composite (weight × sub-score).
- Cash flow +19.4/30.0
- ARV discount +7.5/15.0
- DSCR +6.1/10.0
- Schools +4.1/10.0
- 1% rule +4.0/10.0
- Livability +4.0/5.0
- Rent growth +3.2/5.0
- Condition / age +2.5/5.0
- Appreciation +0.0/10.0
$300,000
🖨 Deal sheet (PDF) 📄 Offer letter ✓ Due diligence
Listing remarks
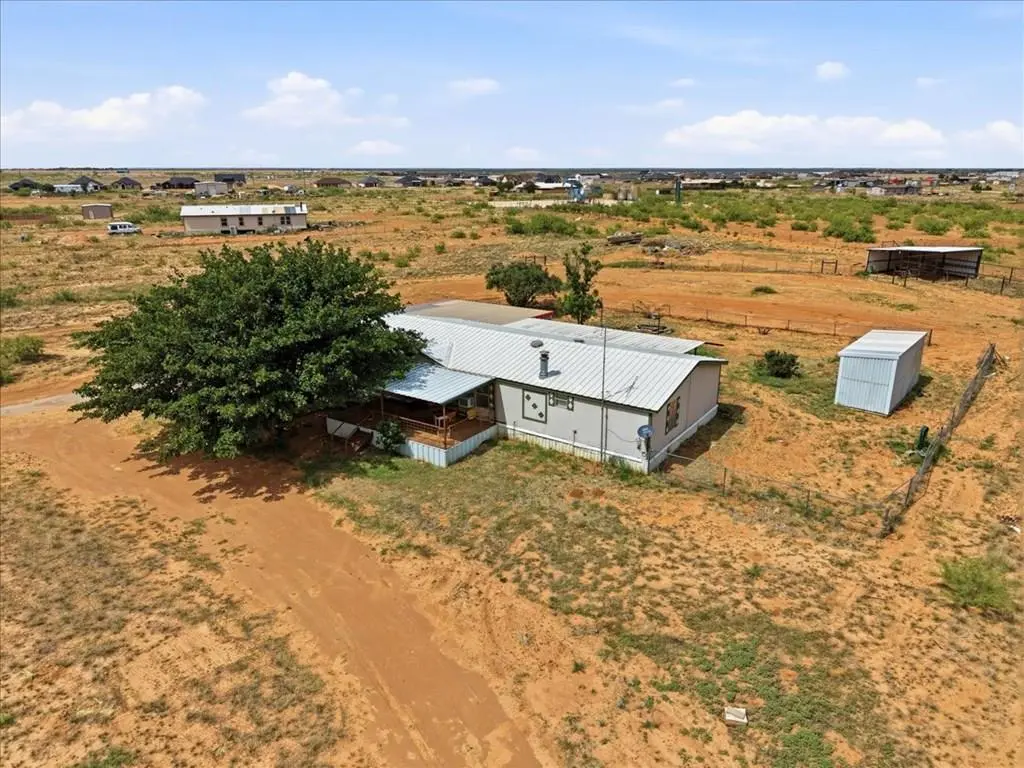
Enjoy wide-open possibilities on 5.0 unrestricted acres in Midland County, just east of Greenwood ISD. This property is ideal for country living, livestock, or recreation w/ horse stalls, holding pens, workshop w/ electricity & concrete floor, and an additional storage building. The 3 bed, 2 bath Doublewide home offers a sequestered primary suite, cozy fireplace in living, updated walk-in tub/shower & spacious covered porch overlooking fenced areas. Attached carport w/ side entry provides protection for your vehicles. Ample room to grow, work, and play—perfect for your rural lifestyle vision.
Key facts
- Horse stalls
- Holding pens
- Concrete floor
Tags
Property features AI
Exterior
- Parking: 1-car carport
- Utilities: Private well water; Septic tank
- Home design: Single-story mobile home; Residential property; Located in the Flora Glendening subdivision
- Construction: Vinyl siding
- Exterior features: Covered porch/patio; Shed(s); Workshop
Interior
- Kitchen: Dishwasher; Electric range; Range; Refrigerator
- Flooring: Carpet; Vinyl
- Bathrooms: 2 full bathrooms
- Heating & cooling: Natural gas heating; Ceiling fans; Window air conditioning units
- Interior features: Pantry; Living room fireplace
- Laundry & utility: Dryer; Gas water heater
Neighborhood map
What this means for you Summary
Snapshot
- This is a 3-bed/2.0-bath manufactured listed at $300k.
Deal economics
- At list price, monthly cash flow is $335 ($4k/yr) — positive.
- The deal already cash-flows at list — no discount required.
- To meet the 1% rule (rent ≥ 1% of price), the offer needs to be $271k (9.8% below list).
- Recommended offer: $271k (9.8% below list) — sets the bar for 1% rule.
- Cap rate 7.6% vs local median 4.7% in Midland — top-decile yield for the area; either an underpriced asset or a hidden risk that comps aren't pricing in. Stress-test before assuming the spread holds.
Location & tenants
- Location reads 79/100 on livability (#57 in TX, #2,192 nationally) — a middle-class / working-renter tenant base. Strengths: employment A+, housing A+, health & safety A+; Watch: crime C-, commute D+, amenities D.
- Greenwood ISD (rural): math 45% / reading 44% proficiency, ranked #220 of 826 in TX (top 27%) — families likely to look elsewhere, expect single-tenant / working-renter base with shorter leases.
- Zoned schools: Greenwood El (795 students, 45% FRL); James R Brooks Middle (math 49% / reading 44%, grade D+, #443 of 1,662 statewide, top 28%, 756 students, 37% FRL); Greenwood H S (math 51% / reading 53%, grade D+, #447 of 1,632 statewide, top 29%, 808 students, 33% FRL).
- Market conditions: Rents rising (+2.8%/yr); 383 active listings in the ZIP; 24 comparable units currently listed for rent nearby; rentals at typical pace (median 23d on market — plan ~3-4 weeks tenant-placement turnaround); solid renter incomes; 1,504 units permitted in Midland County in 2024 (0 in 5+ unit buildings).
- This rent runs 30% of the median local income ($108k/yr) — at the standard rent-burdened threshold; future hikes will face affordability resistance.
Forward outlook
- Local home prices are declining (-3.0%/yr); year-one equity from $2k of loan paydown is wiped out by about $9k of value loss. Plan a longer hold.
- Midland County population projected at +83% by 2050 — long-run rental-demand tailwind backs the buy-and-hold thesis.
Negotiation context
- It's been on market 51 days — a 3% lower offer ($291k) is reasonable based on typical stale-listing flexibility.
Risks & watch-outs
- Climate carrying-cost: major wildfire risk; extreme-heat days projected 7→21/yr by 2055 (HVAC capex compounding) — expect insurance premiums to compound above CPI over the hold.
Questions for the listing agent
- It's been on market 51 days. Have you received any prior offers? Is the seller open to a 10% concession, seller financing, or rate buy-down credit?
- Is there a deadline driving the sale (1031 exchange, divorce, estate, relocation)? That informs how much negotiation room exists.
- What's the average days-on-market for RENTAL listings here right now (not sales)? A rising rental-DOM trend means longer vacancies and softer asking-rent achievability than the comps imply.
- What's the recent tenant-quality profile in this submarket — average credit score on applications, eviction rate, late-payment / NSF rate, and stable-employment percentage? A property-management company in the area should have these aggregated.
- How much new for-sale + rental construction is in the pipeline within 1–3 miles? Heavy new supply typically softens prices + rents 12–24 months out; constrained supply supports both.
Investment metrics
- 1% rule
- 0.90% ✗
- Cap rate
- 7.63%
- Cash-on-cash
- 4.79%
- DSCR
- 1.21
- GRM
- 9.2
CMA / ARV
No comps found within radius.
Projected returns pro-forma
-3.0% appreciation · 2.75% rent growth · sell at horizon
- IRR
- -9.1%
- Equity multiple
- 0.67×
- Total profit
- $-28,060
- Equity at exit
- $44,731
- IRR
- -0.0%
- Equity multiple
- 1.00×
- Total profit
- $-214
- Equity at exit
- $25,939
Cash invested: $84,000 (down + closing). Projections, not guarantees.
Landlord ↔ Tenant lean methodology
- Overall (STATE)
- 87 Strongly Landlord-Friendly
- State Texas
- 87 Strongly Landlord-Friendly · R+5
- County
- — inherits STATE
- City
- — inherits STATE
ZIP-level market 79706
- Rents YoY
- 2.8%
- Active inventory
- 383
- Price-to-rent
- 9.2×
Monthly cashflow live
- Estimated rent
- $2,708 high interval (Pro) →
- Mortgage (P&I)
- −$1,573
- Tax from tax record
- −$105 /mo · $1,264/yr
- Insurance
- −$125
- HOA
- −$0
- Vacancy / Maint / Mgmt
- −$569
- Net cashflow
- $335
Break-even live
Sensitivity live
| Price | -10% $505 | -5% $420 | +0% $335 | +5% $250 | +10% $166 |
|---|---|---|---|---|---|
| Rent | -10% $121 | -5% $228 | +0% $335 | +5% $442 | +10% $549 |
| Rate | -1.0pp $486 | -0.5pp $412 | base $335 | +0.5pp $258 | +1.0pp $179 |
UW: 25.0% down · 7.5% · 30yr · 1.5% tax · 5.0% vac · 8.0% maint · 8.0% mgmt
Financing live
Cash to close
- Down payment
- $75,000
- Closing costs
- $9,000
- Reserves months
- —
- Total cash needed
- —
Loan-product check · same deal, 3 products live
Conventional
25% down · 7.5% · 30yr
- Down + closing
- —
- Monthly P&I
- —
- Monthly cashflow
- —
- DSCR
- —
- Eligible?
- —
Personal DTI + credit; lowest rate.
DSCR
20% down · 8.5% · 30yr
- Down + closing
- —
- Monthly P&I
- —
- Monthly cashflow
- —
- DSCR
- —
- Eligible?
- —
No personal income docs; deal must DSCR.
Hard money
10% down · 12.0% · 12mo
- Down + closing
- —
- Monthly P&I
- —
- Monthly cashflow
- —
- DSCR
- —
- Eligible?
- —
Short-term bridge; refi at stabilization.
Rent comps 24 comps
| Address | Beds | Baths | Sqft | Rent | $/sqft | DOM | Units | Dist |
|---|---|---|---|---|---|---|---|---|
| 8425 E County Road 110 Midland, TX | 3.0 | 2.0 | 1616 | $2,250 | $1.39 | 23d | 1 | 0.33mi |
| 8425 E County Road 110 Midland, TX | 3.0 | 2.0 | 1616 | $3,070 | $1.90 | 45d | 1 | 0.33mi |
| 8513 E County Road 110 Midland, TX | 3.0 | 2.0 | 1616 | $3,070 | $1.90 | 45d | 1 | 0.33mi |
| 8433 E County Road 110 Midland, TX | 3.0 | 2.0 | 1500 | $2,850 | $1.90 | 45d | 1 | 0.33mi |
| 8605 E County Road 110 Midland, TX | 3.0 | 2.0 | 1500 | $2,850 | $1.90 | 45d | 1 | 0.33mi |
| 8603 E County Road 110 Midland, TX | 3.0 | 2.0 | 1500 | $2,850 | $1.90 | 45d | 1 | 0.33mi |
| 8515 E County Road 110 Midland, TX | 3.0 | 2.0 | 1500 | $2,850 | $1.90 | 45d | 1 | 0.33mi |
| 8505 E County Road 110 Midland, TX | 3.0 | 2.0 | 1500 | $2,850 | $1.90 | 45d | 1 | 0.33mi |
| 8513 E County Road 110 Midland, TX | 3.0 | 2.0 | 1616 | $2,250 | $1.39 | 23d | 1 | 0.33mi |
| 8507 E County Road 110 Midland, TX | 3.0 | 2.0 | 1500 | $2,250 | $1.50 | 15d | 1 | 0.36mi |
| 8435 E County Road 110 Midland, TX | 3.0 | 2.0 | 1616 | $2,250 | $1.39 | 15d | 1 | 0.36mi |
| 8517 E County Road 110 Midland, TX | 4.0 | 3.0 | 1782 | $3,485 | $1.96 | 15d | 1 | 0.36mi |
| 8509 E County Road 110 Midland, TX | 3.0 | 2.0 | 1500 | $2,850 | $1.90 | 15d | 1 | 0.36mi |
| 8437 E County Road 110 Midland, TX | 3.0 | 2.0 | 1500 | $2,850 | $1.90 | 15d | 1 | 0.36mi |
| 8601 E County Road 110 Midland, TX | 4.0 | 3.0 | 1782 | $3,485 | $1.96 | 45d | 1 | 0.36mi |
| 8501 E County Road 110 Midland, TX | 3.0 | 2.0 | 1500 | $2,850 | $1.90 | 15d | 1 | 0.36mi |
| 8503 E County Road 110 Midland, TX | 3.0 | 2.0 | 1616 | $2,250 | $1.39 | 23d | 1 | 0.36mi |
| 8429 E County Road 110 Midland, TX | 3.0 | 2.0 | 1500 | $2,850 | $1.90 | 15d | 1 | 0.36mi |
| 8511 E County Road 110 Midland, TX | 3.0 | 2.0 | 1500 | $2,850 | $1.90 | 15d | 1 | 0.36mi |
| 8439 E County Road 110 Midland, TX | 3.0 | 2.0 | 1500 | $2,250 | $1.50 | 15d | 1 | 0.36mi |
| 8503 E County Road 110 Midland, TX | 3.0 | 2.0 | 1616 | $2,250 | $1.39 | 15d | 1 | 0.36mi |
| 8601 E County Road 110 Midland, TX | 4.0 | 3.0 | 1782 | $2,904 | $1.63 | 15d | 1 | 0.36mi |
| 8435 E County Road 110 Midland, TX | 3.0 | 2.0 | 1616 | $2,250 | $1.39 | 23d | 1 | 0.36mi |
| 8431 E County Road 110 Midland, TX | 3.0 | 2.0 | 1500 | $2,850 | $1.90 | 15d | 1 | 0.36mi |
Listing history 20 events
-
2026-06-22days on market $300,000 Active 51 DOM
-
2026-06-19days on market $300,000 Active 49 DOM
-
2026-06-18days on market $300,000 Active 48 DOM
-
2026-06-17days on market $300,000 Active 47 DOM
-
2026-06-16days on market $300,000 Active 46 DOM
-
2026-06-15days on market $300,000 Active 45 DOM
-
2026-06-14days on market $300,000 Active 43 DOM
-
2026-06-13days on market $300,000 Active 42 DOM
-
2026-06-10days on market $300,000 Active 40 DOM
-
2026-06-09days on market $300,000 Active 39 DOM
-
2026-06-08days on market $300,000 Active 38 DOM
-
2026-06-07days on market $300,000 Active 37 DOM
-
2026-06-02days on market $300,000 Active 32 DOM
-
2026-06-01days on market $300,000 Active 31 DOM
-
2026-05-31days on market $300,000 Active 30 DOM
-
2026-05-30days on market $300,000 Active 29 DOM
-
2026-05-01$300,000 Active 617-char remark
-
2025-06-23soldstatus
-
2008-02-11soldstatus
-
1993-05-27soldstatus
ⓘ Source: listings_history table (triggers on properties + properties_extension) + one-shot
backfill from property_details.listing_events for pre-trigger history.
Tax reassessment forecast TX · Resets to sale price
- Current annual tax
- $1,264 · $105/mo
- Projected year-2 tax
- $5,490 · $458/mo
- Expected delta
- +$4,226/yr (+$352/mo · 334.2%)
ⓘ Screening estimate from a state-policy table — verify with the county assessor before closing.
Climate risk First Street
- Flood 1/10 Low FEMA zone X · 0% chance over 30 yrs
- Wildfire 7/10 Severe
- Heat 6/10 Major 7 d/yr ≥102°F today · 21 d/yr by 30 yrs out
- Wind 3/10 Moderate 7% chance of damaging wind over 30 yrs
- Air quality 1/10 Low 0 unhealthy d/yr today · 0 by 30 yrs out
Nearby sold comps map
Loading sold comps map…
Walkable amenities ~0.75 mi
Loading nearby amenities…
Taxation est. · year 1
- Rental income
- $32,490
- − Mortgage interest
- −$16,805
- − Property taxes
- −$1,264
- − Insurance
- −$1,500
- − Repairs & maintenance
- −$2,599
- − Management
- −$2,599
- − Depreciation
- −$8,727
- Taxable loss
- −$1,005
- Est. tax savings @ 24.0%
- +$241
- After-tax cash flow
- $4,265/yr
For passive investors: Depreciation is non-cash, so a rental often shows a tax loss while cash-flowing — sheltering income. Rental losses are passive: they offset passive income freely, and up to $25,000/yr can offset ordinary (W-2) income if you actively participate and your MAGI is under $100k (phasing out to $0 by $150k); unused losses carry forward. On sale, claimed depreciation is recaptured at up to 25%, and gains may owe capital-gains tax (a 1031 exchange can defer both). Figures are a year-1 estimate at your 24.0% rate — not tax advice; consult a CPA.
Schools (NCES district)
- District
- Greenwood ISD
- NCES district ID
- 4821750
- Math proficiency
- 45% ▲ 4.00%
- Reading proficiency
- 44% ▲ 1.00%
- Median HH income
- $74,012
- Composite
- 40.54/100
- National rank
- #3701
- State rank
- #220 of 826 in TX
Livability — Midland
- Score
- 79/100
- State rank
- #57
- US rank
- #2192
Category grades
Schools grade is shown separately in the Schools card above.
Census & demographics
- County
- Midland County · 168,494 people
- City population
- 168,494
- Metro
- Midland, TX
- Population (ZIP)
- 34,281
- Household income
- $108,059
- Rent vs Own
- Severe rent burden
- 303.0
Population outlook (Midland County) Hauer SSP2
- Today (2025)
- 220,895 people
- By 2030
- 253,667 · +14.8%
- By 2040
- 325,498 · +47.4%
- By 2050
- 404,168 · +83.0%
- By 2075
- 609,802 · +176.1%
- By 2100
- 760,172 · +244.1%
Race, ethnicity, and origin ACS 2023
- Neighborhood character
- Diverse neighborhood (Simpson 0.58)
- Race & ethnicity
- Hispanic / Latino 48% White 44% Two or more races 13% Black 3% Asian 2%
- Hispanic origin (detail)
- Mexican 43% Cuban 1%
- Common ancestry
- Italian 1% Lithuanian 1% Swedish 1%
- Foreign-born
- 11% · Canada
- Languages at home
- 68% English-only · Spanish 30%
Political lean MEDSL · Midland
- 2024 margin
- Solid R (+60.5) · D 19.3% · R 79.8%
- 2008→2024 swing
- -3.3pp toward R · 2008: -57.3pp · 2024: -60.5pp
- All cycles
- 2024: R+60.5 2020: R+56.6 2016: R+55.2 2012: R+61.5 2008: R+57.3
Not yet ingested
- Civics
- —
Market trends
- HPI YoY
- ▼ -173.42%
- Current HPI
- 212.6467
- Rent YoY
- ▲ 2.75%
- Metro
- Midland, TX
- State GDP YoY
- ▲ 3.95%
- F500 in state
- 110
Industry mix (Fortune 500 HQ in TX)
| Industry | F500 HQs | Revenue |
|---|---|---|
| Energy | 16 | $1,198B |
|
||
| Technology | 5 | $198B |
|
||
| Engineering / Construction | 4 | $72B |
|
||
| Energy Services | 3 | $60B |
|
||
| Utilities | 3 | $41B |
|
||
| Healthcare | 2 | $330B |
|
||
Price history
4 events — show timeline
- 2026-05-01 Listed $300,000 PBBOR
- 2025-06-23 Sold (Public Records) — Public Records
- 2008-02-11 Sold (Public Records) — Public Records
- 1993-05-27 Sold (Public Records) — Public Records
Property tax history
-2.1%/yrLatest (2025): $1,264 · -1.8% YoY. Source: county tax records.
Cash-flow waterfall
monthlySold comps — $/sqft
last 12 mo · ≤1 miLoading sold comps…