 🏷️ Likely Rental
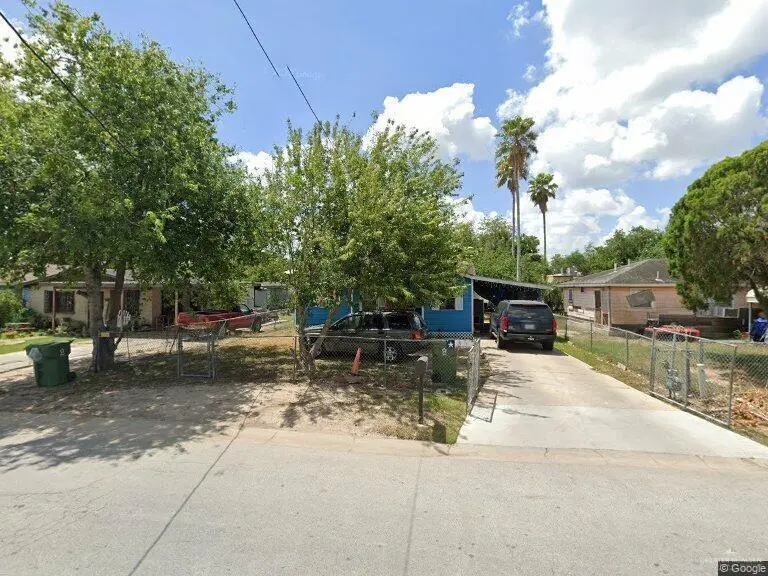
35 Jo Ann Ln · Brownsville, TX
Flood risk 1/10 · Minimal
- FEMA flood zone
- X (unshaded)
- Chance of flooding over 30 yrs
- 0.0%
- Est. flood insurance / yr
- $507 – $1,088
Fire risk 3/10 · Minor
- Est. fire insurance / yr
- $1,222 – $2,270
Heat risk 9/10 · Severe
- Hot days now (above 111°F)
- 7 days/yr
- Hot days in 30 yrs
- 25 days/yr
Wind risk 9/10 · Severe
- Chance of severe wind over 30 yrs
- 99.0%
Air-quality risk 3/10 · Minor
- Unhealthy air days now
- 2 days/yr
- Unhealthy air days in 30 yrs
- 3 days/yr
Risk factors via First Street. Map © Google.
Why this score? — see what drove the B+ grade
The composite is a weighted blend of 9 inputs, each scored 0–100. Each bar is that input's sub-score; the figure is the points it added to the 100-point composite (weight × sub-score).
- Cash flow +29.9/30.0
- ARV discount +15.0/15.0
- DSCR +10.0/10.0
- 1% rule +8.4/10.0
- Rent growth +5.0/5.0
- Livability +4.0/5.0
- Condition / age +2.5/5.0
- Schools +2.2/10.0
- Appreciation +0.0/10.0
$100,000
🖨 Deal sheet (PDF) 📄 Offer letter ✓ Due diligence
Listing remarks MLS
Investor Opportunity in Brownsville! Offering 2k in Seller concessions Located at 35 Jo Ann St, Brownsville, TX 78520, this 3-bedroom, 1-bath home offers a great opportunity for investors seeking immediate rental income. With 816 sq ft of living space, the property is currently tenant-occupied, making it a perfect addition to any investment portfolio. Conveniently located near James Pace Early College High School, the home provides easy access to schools, shopping, and everyday conveniences. Its practical layout and established tenancy make it a solid option for investors looking for steady cash flow. Don’t miss the chance to own an income-producing property in a growing Brownsville market.
Key facts
- Near shopping
- 6,040 sq ft lot
- Built 1976
Tags
Neighborhood map
What this means for you Summary
Snapshot
- This is a 3-bed/1.0-bath single-family listed at $100k.
Deal economics
- At list price, monthly cash flow is $371 ($4k/yr) — positive.
- The deal already cash-flows at list — no discount required.
- Meets the 1% rule at list price ($1k rent vs $100k).
- Recommended offer: $91k (9.0% below list) — sets the bar for market timing.
- Cap rate 10.7% vs local median 5.0% in Brownsville — top-decile yield for the area; either an underpriced asset or a hidden risk that comps aren't pricing in. Stress-test before assuming the spread holds.
Location & tenants
- Location reads 79/100 on livability (#62 in TX, #2,311 nationally) — a middle-class / working-renter tenant base. Strengths: commute A+, cost of living A+, housing A+; Watch: schools C-, amenities D, crime D-.
- Brownsville ISD (urban): math 20% / reading 34% proficiency, ranked #710 of 826 in TX (top 86%) — low school quality limits family demand, transient renter base, plan for 1-2y turnover; 83% free/reduced lunch — lower-income household profile, screen leases tightly.
- Market conditions: Rents rising fast (+11.4%/yr); 346 active listings in the ZIP; 9 comparable units currently listed for rent nearby; rentals at typical pace (median 22d on market — plan ~3-4 weeks tenant-placement turnaround); 44% of comp listings sitting > 30 days — soft ceiling on asking rent; 2,326 units permitted in Cameron County in 2024 (503 in 5+ unit buildings).
- This rent runs 32% of the median local income ($50k/yr) — at the standard rent-burdened threshold; future hikes will face affordability resistance.
Forward outlook
- Local home prices are declining (-3.0%/yr); year-one equity from $691 of loan paydown is wiped out by about $3k of value loss. Plan a longer hold.
- Cameron County population projected at +3% by 2050 — modest demand growth; plan on rents tracking national, not racing it.
- At projected returns (-3.0% appreciation + 8.0% rent growth), your $28k cash investment doubles in ~6 years — after that, you're playing with house money.
Negotiation context
- It's been on market 91 days — a 9% lower offer ($91k) is reasonable based on typical stale-listing flexibility.
Risks & watch-outs
- Climate carrying-cost: severe wind risk, 99% chance of damaging wind over 30y; extreme-heat days projected 7→25/yr by 2055 (HVAC capex compounding) — expect insurance premiums to compound above CPI over the hold.
Questions for the listing agent
- It's been on market 91 days. Have you received any prior offers? Is the seller open to a 9% concession, seller financing, or rate buy-down credit?
- Built in 1976 — when were the roof, HVAC, electrical panel, plumbing, and water heater last replaced?
- Why hasn't it sold? Are there any deal-killer items the seller is aware of (foundation, flood, title, zoning, code violations)?
- Is there a deadline driving the sale (1031 exchange, divorce, estate, relocation)? That informs how much negotiation room exists.
- Crime grade is D in this area — have there been break-ins, vandalism, or insurance claims at this property in the last 3 years? What carrier currently insures it and at what premium?
- What's the average days-on-market for RENTAL listings here right now (not sales)? A rising rental-DOM trend means longer vacancies and softer asking-rent achievability than the comps imply.
- What's the recent tenant-quality profile in this submarket — average credit score on applications, eviction rate, late-payment / NSF rate, and stable-employment percentage? A property-management company in the area should have these aggregated.
- How much new for-sale + rental construction is in the pipeline within 1–3 miles? Heavy new supply typically softens prices + rents 12–24 months out; constrained supply supports both.
Investment metrics
- 1% rule
- 1.34% ✓
- Cap rate
- 10.74%
- Cash-on-cash
- 15.89%
- DSCR
- 1.71
- GRM
- 6.2
CMA / ARV
- ARV (median comp)
- $131,248
- List price
- $100,000
- Delta
- -23.81%
- Verdict
- UNDERPRICED
- Comps
- 3 within 1.0 mi
Projected returns pro-forma
-3.0% appreciation · 8.0% rent growth · sell at horizon
- IRR
- 12.3%
- Equity multiple
- 1.52×
- Total profit
- $14,492
- Equity at exit
- $14,910
- IRR
- 24.9%
- Equity multiple
- 3.69×
- Total profit
- $75,238
- Equity at exit
- $8,646
Cash invested: $28,000 (down + closing). Projections, not guarantees.
Landlord ↔ Tenant lean methodology
- Overall (STATE)
- 87 Strongly Landlord-Friendly
- State Texas
- 87 Strongly Landlord-Friendly · R+5
- County
- — inherits STATE
- City
- — inherits STATE
ZIP-level market 78520
- Home prices YoY
- -19.8%
- Rents YoY
- 11.4%
- Active inventory
- 346
- Price-to-rent
- 6.2×
Monthly cashflow live
- Estimated rent
- $1,336 high interval (Pro) →
- Mortgage (P&I)
- −$524
- Tax from tax record
- −$119 /mo · $1,425/yr
- Insurance
- −$42
- HOA
- −$0
- Vacancy / Maint / Mgmt
- −$281
- Net cashflow
- $371
Break-even live
Sensitivity live
| Price | -10% $427 | -5% $399 | +0% $371 | +5% $343 | +10% $314 |
|---|---|---|---|---|---|
| Rent | -10% $265 | -5% $318 | +0% $371 | +5% $424 | +10% $476 |
| Rate | -1.0pp $421 | -0.5pp $396 | base $371 | +0.5pp $345 | +1.0pp $319 |
UW: 25.0% down · 7.5% · 30yr · 1.5% tax · 5.0% vac · 8.0% maint · 8.0% mgmt
Financing live
Cash to close
- Down payment
- $25,000
- Closing costs
- $3,000
- Reserves months
- —
- Total cash needed
- —
Loan-product check · same deal, 3 products live
Conventional
25% down · 7.5% · 30yr
- Down + closing
- —
- Monthly P&I
- —
- Monthly cashflow
- —
- DSCR
- —
- Eligible?
- —
Personal DTI + credit; lowest rate.
DSCR
20% down · 8.5% · 30yr
- Down + closing
- —
- Monthly P&I
- —
- Monthly cashflow
- —
- DSCR
- —
- Eligible?
- —
No personal income docs; deal must DSCR.
Hard money
10% down · 12.0% · 12mo
- Down + closing
- —
- Monthly P&I
- —
- Monthly cashflow
- —
- DSCR
- —
- Eligible?
- —
Short-term bridge; refi at stabilization.
Rent comps 9 comps
| Address | Beds | Baths | Sqft | Rent | $/sqft | DOM | Units | Dist |
|---|---|---|---|---|---|---|---|---|
| 17 Midway Dr Brownsville, TX | 2.0 | 1.0 | 600 | $800 | $1.33 | 22d | 1 | 0.18mi |
| 158 Garden St Brownsville, TX | 2.0 | 1.0 | 868 | $900 | $1.04 | 44d | 1 | 0.23mi |
| 2100 Laredo Rd Brownsville, TX | 1.0–2.0 | 1.0–2.0 | 976 | $1,540 | $1.58 | 14d | 6 | 0.51mi |
| 3055 El Paso Rd Unit H-1 Brownsville, TX | 2.0 | 2.0 | 900 | $1,050 | $1.17 | 44d | 1 | 0.78mi |
| 34 W Hawthorne Ave Brownsville, TX | 3.0 | 2.0 | 940 | $1,400 | $1.49 | 44d | 1 | 0.90mi |
| 2394 El Arca Dr Brownsville, TX | 3.0 | 1.0 | 968 | $1,300 | $1.34 | 14d | 1 | 1.27mi |
| 402 Champions Dr Brownsville, TX | 2.0 | 1.5 | 814 | $1,300 | $1.60 | 22d | 1 | 1.34mi |
| 600 Lakeside Blvd Brownsville, TX | 1.0–2.0 | 1.0–2.0 | 763 | $950 | $1.25 | 14d | 2 | 1.35mi |
| 1904 Central Blvd Brownsville, TX | 1.0–3.0 | 1.0–2.0 | 1046 | $1,035 | $0.99 | 44d | 9 | 1.40mi |
Listing history 19 events
-
2026-06-16status $100,000 Pending 91 DOM
-
2026-06-15days on market $100,000 Active 91 DOM
-
2026-06-14days on market $100,000 Active 89 DOM
-
2026-06-13days on market $100,000 Active 88 DOM
-
2026-06-10days on market $100,000 Active 86 DOM
-
2026-06-09days on market $100,000 Active 85 DOM
-
2026-06-08days on market $100,000 Active 84 DOM
-
2026-06-07days on market $100,000 Active 83 DOM
-
2026-06-05days on market $100,000 Active 80 DOM
-
2026-06-03days on market $100,000 Active 79 DOM
-
2026-06-02days on market $100,000 Active 78 DOM
-
2026-06-01days on market $100,000 Active 77 DOM
-
2026-05-31days on market $100,000 Active 76 DOM
-
2026-05-30days on market $100,000 Active 75 DOM
-
2026-04-25price $100,000 706-char remark
Show marketing remark (706 chars)
Investor Opportunity in Brownsville! Offering 2k in Seller concessions Located at 35 Jo Ann St, Brownsville, TX 78520, this 3-bedroom, 1-bath home offers a great opportunity for investors seeking immediate rental income. With 816 sq ft of living space, the property is currently tenant-occupied, making it a perfect addition to any investment portfolio. Conveniently located near James Pace Early College High School, the home provides easy access to schools, shopping, and everyday conveniences. Its practical layout and established tenancy make it a solid option for investors looking for steady cash flow. Don’t miss the chance to own an income-producing property in a growing Brownsville market.
-
2026-03-16price $105,000 706-char remark
Show marketing remark (706 chars)
Investor Opportunity in Brownsville! Offering 2k in Seller concessions Located at 35 Jo Ann St, Brownsville, TX 78520, this 3-bedroom, 1-bath home offers a great opportunity for investors seeking immediate rental income. With 816 sq ft of living space, the property is currently tenant-occupied, making it a perfect addition to any investment portfolio. Conveniently located near James Pace Early College High School, the home provides easy access to schools, shopping, and everyday conveniences. Its practical layout and established tenancy make it a solid option for investors looking for steady cash flow. Don’t miss the chance to own an income-producing property in a growing Brownsville market.
-
2026-03-16$105 Active 706-char remark
Show marketing remark (706 chars)
Investor Opportunity in Brownsville! Offering 2k in Seller concessions Located at 35 Jo Ann St, Brownsville, TX 78520, this 3-bedroom, 1-bath home offers a great opportunity for investors seeking immediate rental income. With 816 sq ft of living space, the property is currently tenant-occupied, making it a perfect addition to any investment portfolio. Conveniently located near James Pace Early College High School, the home provides easy access to schools, shopping, and everyday conveniences. Its practical layout and established tenancy make it a solid option for investors looking for steady cash flow. Don’t miss the chance to own an income-producing property in a growing Brownsville market.
-
2018-09-13soldstatus
-
2012-04-24soldstatus
ⓘ Source: listings_history table (triggers on properties + properties_extension) + one-shot
backfill from property_details.listing_events for pre-trigger history.
Tax reassessment forecast TX · Resets to sale price
- Current annual tax
- $1,425 · $119/mo
- Projected year-2 tax
- $1,830 · $152/mo
- Expected delta
- +$405/yr (+$34/mo · 28.4%)
ⓘ Screening estimate from a state-policy table — verify with the county assessor before closing.
Climate risk First Street
- Flood 1/10 Low FEMA zone X (unshaded) · 0% chance over 30 yrs
- Wildfire 3/10 Moderate
- Heat 9/10 Extreme 7 d/yr ≥111°F today · 25 d/yr by 30 yrs out
- Wind 9/10 Extreme 99% chance of damaging wind over 30 yrs
- Air quality 3/10 Moderate 2 unhealthy d/yr today · 3 by 30 yrs out
Nearby sold comps map
Loading sold comps map…
Walkable amenities ~0.75 mi
Loading nearby amenities…
Taxation est. · year 1
- Rental income
- $16,035
- − Mortgage interest
- −$5,602
- − Property taxes
- −$1,425
- − Insurance
- −$500
- − Repairs & maintenance
- −$1,283
- − Management
- −$1,283
- − Depreciation
- −$2,909
- Taxable income
- $3,034
- Est. tax owed @ 24.0%
- −$728
- After-tax cash flow
- $3,722/yr
For passive investors: Depreciation is non-cash, so a rental often shows a tax loss while cash-flowing — sheltering income. Rental losses are passive: they offset passive income freely, and up to $25,000/yr can offset ordinary (W-2) income if you actively participate and your MAGI is under $100k (phasing out to $0 by $150k); unused losses carry forward. On sale, claimed depreciation is recaptured at up to 25%, and gains may owe capital-gains tax (a 1031 exchange can defer both). Figures are a year-1 estimate at your 24.0% rate — not tax advice; consult a CPA.
Schools (NCES district)
- District
- Brownsville ISD
- NCES district ID
- 4811680
- Math proficiency
- 20% ▼ -36.00%
- Reading proficiency
- 34% ▼ -13.00%
- Median HH income
- $30,490
- Composite
- 21.8/100
- National rank
- #8249
- State rank
- #710 of 826 in TX
Livability — Brownsville
- Score
- 79/100
- State rank
- #62
- US rank
- #2311
Category grades
Schools grade is shown separately in the Schools card above.
Census & demographics
- Census place
- Brownsville, TX
- County
- Cameron County · 310,734 people
- City population
- 212,132
- Metro
- Brownsville-Harlingen, TX
- Population (ZIP)
- 64,740
- Household income
- $50,116
- Rent vs Own
- Severe rent burden
- 1800.0
Population outlook (Cameron County) Hauer SSP2
- Today (2025)
- 441,603 people
- By 2030
- 448,113 · +1.5%
- By 2040
- 456,385 · +3.3%
- By 2050
- 456,294 · +3.3%
- By 2075
- 423,851 · -4.0%
- By 2100
- 342,787 · -22.4%
Race, ethnicity, and origin ACS 2023
- Neighborhood character
- Predominantly Hispanic (93%)
- Race & ethnicity
- Hispanic / Latino 93% Two or more races 44% White 6%
- Hispanic origin (detail)
- Mexican 88%
- Foreign-born
- 26% · Canada
- Languages at home
- 18% English-only · Spanish 82%
Political lean MEDSL · Cameron
- 2024 margin
- Lean R (+5.8) · D 46.7% · R 52.5%
- 2008→2024 swing
- -34.6pp toward R · 2008: 28.8pp · 2024: -5.8pp
- All cycles
- 2024: R+5.8 2020: D+13.2 2016: D+32.5 2012: D+32.4 2008: D+28.8
Not yet ingested
- Civics
- —
Market trends
- HPI YoY
- ▼ -52.91%
- Current HPI
- 214.4335
- Rent YoY
- ▲ 11.41%
- Metro
- Brownsville-Harlingen, TX
- State GDP YoY
- ▲ 3.95%
- F500 in state
- 110
Industry mix (Fortune 500 HQ in TX)
| Industry | F500 HQs | Revenue |
|---|---|---|
| Energy | 16 | $1,198B |
|
||
| Technology | 5 | $198B |
|
||
| Engineering / Construction | 4 | $72B |
|
||
| Energy Services | 3 | $60B |
|
||
| Utilities | 3 | $41B |
|
||
| Healthcare | 2 | $330B |
|
||
Price history
-4.8% since first listed5 events — show timeline
- 2026-04-25 Price Changed $100,000 MCALLENMLS
- 2026-03-16 Price Changed $105,000 MCALLENMLS
- 2026-03-16 Listed $105 MCALLENMLS
- 2018-09-13 Sold (Public Records) — Public Records
- 2012-04-24 Sold (Public Records) — Public Records
Property tax history
+4.2%/yrLatest (2025): $1,425 · -9.0% YoY. Source: county tax records.
Cash-flow waterfall
monthlySold comps — $/sqft
last 12 mo · ≤1 miLoading sold comps…