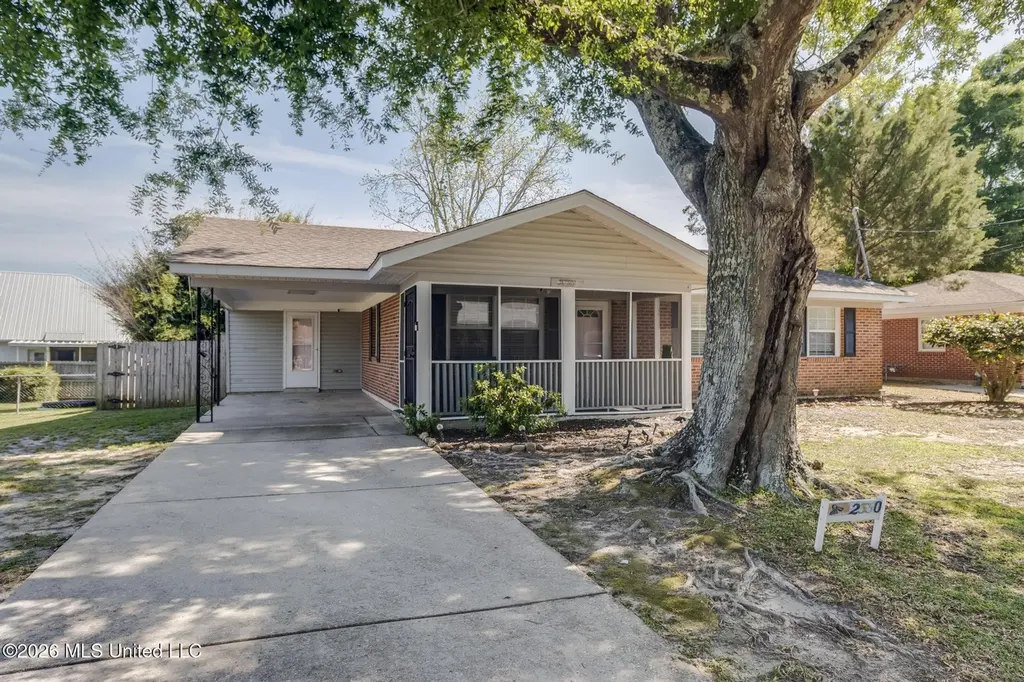
2330 Curcor Dr · Gulfport, MS
Flood risk 5/10 · Moderate
- FEMA flood zone
- X (shaded)
- Chance of flooding over 30 yrs
- 0.24%
- Est. flood insurance / yr
- $507 – $1,088
Fire risk 1/10 · Minimal
- Est. fire insurance / yr
- $1,241 – $2,305
Heat risk 10/10 · Severe
- Hot days now (above 106°F)
- 7 days/yr
- Hot days in 30 yrs
- 23 days/yr
Wind risk 9/10 · Severe
- Chance of severe wind over 30 yrs
- 99.0%
Air-quality risk 3/10 · Minor
- Unhealthy air days now
- 2 days/yr
- Unhealthy air days in 30 yrs
- 3 days/yr
Risk factors via First Street. Map © Google.
Why this score? — see what drove the D- grade
The composite is a weighted blend of 9 inputs, each scored 0–100. Each bar is that input's sub-score; the figure is the points it added to the 100-point composite (weight × sub-score).
- Cash flow +13.7/30.0
- DSCR +4.1/10.0
- Livability +3.7/5.0
- Rent growth +3.6/5.0
- Schools +3.4/10.0
- 1% rule +3.0/10.0
- ARV discount +3.0/15.0
- Condition / age +2.5/5.0
- Appreciation +0.0/10.0
$228,900
🖨 Deal sheet (PDF) 📄 Offer letter ✓ Due diligence
Listing remarks MLS
Discover this beautifully updated 3-bedroom, 2-bath home--perfectly furnished and ready for you to settle in or invest. Enjoy living just minutes from the stunning Gulf Coast beaches, vibrant shopping destinations, and exciting entertainment options. Everything inside the home stays (except washer and dryer), making your move effortless. Don't miss out--schedule your viewing today and experience Gulf Coast living at its finest!
Key facts
- 7,840 sq ft lot
- 2 parking spots
- Built 1958
Neighborhood map
What this means for you Summary
Snapshot
- This is a 3-bed/2.0-bath single-family listed at $229k.
Deal economics
- At list price, monthly cash flow is $18 ($210/yr) — positive.
- The deal already cash-flows at list — no discount required.
- To meet the 1% rule (rent ≥ 1% of price), the offer needs to be $182k (20.4% below list).
- Recommended offer: $182k (20.4% below list) — sets the bar for 1% rule.
- Cap rate 6.4% vs local median 4.9% in Gulfport — meaningfully above typical; check what's discounted (condition, days-on-market, listing class) to confirm the premium yield is real.
Location & tenants
- Location reads 73/100 on livability (#15 in MS) — a middle-class / working-renter tenant base. Strengths: cost of living A+, housing A+, health & safety A+; Watch: schools D, amenities F, commute F.
- Gulfport School District (urban): math 41% / reading 42% proficiency, ranked #37 of 130 in MS (top 28%) — families likely to look elsewhere, expect single-tenant / working-renter base with shorter leases; 67% free/reduced lunch — lower-income household profile, screen leases tightly.
- Market conditions: Rents rising fast (+4.3%/yr); 301 active listings in the ZIP; 22 comparable units currently listed for rent nearby; rentals lingering (median 45d on market — plan ~5-8 weeks vacancy on turnover, expect pricing pressure); 55% of comp listings sitting > 30 days — soft ceiling on asking rent; 2,194 units permitted in Harrison County in 2024 (0 in 5+ unit buildings).
- This rent runs 40% of the median local income ($55k/yr) — at the standard rent-burdened threshold; future hikes will face affordability resistance.
Forward outlook
- Local home prices are declining (-3.0%/yr); year-one equity from $2k of loan paydown is wiped out by about $7k of value loss. Plan a longer hold.
- Harrison County population projected at +27% by 2050 — long-run rental-demand tailwind backs the buy-and-hold thesis.
Negotiation context
- It's been on market 63 days — a 6% lower offer ($215k) is reasonable based on typical stale-listing flexibility.
- 4 sale attempts since 3y ago; this cycle's ask has dropped $16k (7%) from the opening price — seller is motivated, your offer sets the floor, not the list.
Risks & watch-outs
- Watch-outs: built in 1958 — expect roof / HVAC / electrical / plumbing capex.
- Climate carrying-cost: moderate flood risk; severe wind risk, 99% chance of damaging wind over 30y; extreme-heat days projected 7→23/yr by 2055 (HVAC capex compounding) — expect insurance premiums to compound above CPI over the hold.
Questions for the listing agent
- It's been on market 63 days. Have you received any prior offers? Is the seller open to a 20% concession, seller financing, or rate buy-down credit?
- Built in 1958 — when were the roof, HVAC, electrical panel, plumbing, and water heater last replaced?
- Why hasn't it sold? Are there any deal-killer items the seller is aware of (foundation, flood, title, zoning, code violations)?
- Is there a deadline driving the sale (1031 exchange, divorce, estate, relocation)? That informs how much negotiation room exists.
- Schools are D-rated, which usually means shorter tenancies and higher turnover. Who's the typical renter profile here, and what's been the actual vacancy rate?
- The area grade is low — what's the realistic commute time and amenity access for the typical tenant pool here? Any planned neighborhood developments (good or bad) we should know about?
- What's the average days-on-market for RENTAL listings here right now (not sales)? A rising rental-DOM trend means longer vacancies and softer asking-rent achievability than the comps imply.
- What's the recent tenant-quality profile in this submarket — average credit score on applications, eviction rate, late-payment / NSF rate, and stable-employment percentage? A property-management company in the area should have these aggregated.
- How much new for-sale + rental construction is in the pipeline within 1–3 miles? Heavy new supply typically softens prices + rents 12–24 months out; constrained supply supports both.
Investment metrics
- 1% rule
- 0.80% ✗
- Cap rate
- 6.38%
- Cash-on-cash
- 0.33%
- DSCR
- 1.01
- GRM
- 10.5
CMA / ARV
- ARV (median comp)
- $208,108
- List price
- $228,900
- Delta
- 9.99%
- Verdict
- FAIR
- Comps
- 20 within 1.0 mi
Show comp detail 12 sales within ~0.75 mi
| Address | Dist | Beds/Ba | Sqft | Sold | Price | $/sf | Match |
|---|---|---|---|---|---|---|---|
| 2101 South St | 0.26mi | 3/2.0 | 1,189 (+5%) | 5mo | $165,000 | $139 | 75 |
| 492 Weaver Ave | 0.20mi | 3/2.0 | 1,285 (+14%) | 4mo | $199,000 | $155 | 64 |
| 760 Hunters Glen Ln | 0.71mi | 3/1.5 | 1,000 (-12%) | 0mo | $183,990 | $184 | 45 |
| 294 Meadows Ln | 0.65mi | 3/1.5 | 1,000 (-12%) | 4mo | $177,600 | $178 | 45 |
| 696 Hunters Glen Ln | 0.71mi | 3/1.5 | 1,000 (-12%) | 2mo | $179,600 | $180 | 44 |
| 768 Hunters Glen Ln | 0.71mi | 3/1.5 | 1,000 (-12%) | 2mo | $183,990 | $184 | 43 |
| 704 Hunters Glen Ln | 0.71mi | 3/1.5 | 1,000 (-12%) | 3mo | $178,600 | $179 | 43 |
| 752 Hunters Glen Ln | 0.71mi | 2/2.5 (-1) | 1,000 (-12%) | 2mo | $188,990 | $189 | 39 |
| 744 Hunters Glen Ln | 0.71mi | 2/2.5 (-1) | 1,000 (-12%) | 2mo | $188,990 | $189 | 38 |
| 720 Hunters Glen Ln | 0.71mi | 2/2.5 (-1) | 1,000 (-12%) | 4mo | $178,100 | $178 | 38 |
| 800 Hunters Glen Ln | 0.72mi | 2/2.5 (-1) | 1,000 (-12%) | 4mo | $187,490 | $187 | 37 |
| 688 Hunters Glen Ln | 0.71mi | 2/2.5 (-1) | 1,000 (-12%) | 5mo | $176,700 | $177 | 37 |
Match score weights: distance 35% · size 25% · config 20% · recency 20%. Top-matched comps best support the ARV.
Projected returns pro-forma
-3.0% appreciation · 4.26% rent growth · sell at horizon
- IRR
- -14.6%
- Equity multiple
- 0.47×
- Total profit
- $-33,709
- Equity at exit
- $34,130
- IRR
- -4.1%
- Equity multiple
- 0.71×
- Total profit
- $-18,357
- Equity at exit
- $19,791
Cash invested: $64,092 (down + closing). Projections, not guarantees.
Landlord ↔ Tenant lean methodology
- Overall (STATE)
- 90 Strongly Landlord-Friendly
- State Mississippi
- 90 Strongly Landlord-Friendly · R+11
- County
- — inherits STATE
- City
- — inherits STATE
ZIP-level market 39507
- Home prices YoY
- -27.1%
- Rents YoY
- 4.3%
- Active inventory
- 301
- Price-to-rent
- 10.5×
Monthly cashflow live
- Estimated rent
- $1,822 high interval (Pro) →
- Mortgage (P&I)
- −$1,200
- Tax from tax record
- −$126 /mo · $1,515/yr
- Insurance
- −$95
- HOA
- −$0
- Vacancy / Maint / Mgmt
- −$383
- Net cashflow
- $18
Break-even live
Sensitivity live
| Price | -10% $147 | -5% $82 | +0% $18 | +5% $-47 | +10% $-112 |
|---|---|---|---|---|---|
| Rent | -10% $-126 | -5% $-54 | +0% $18 | +5% $89 | +10% $161 |
| Rate | -1.0pp $133 | -0.5pp $76 | base $18 | +0.5pp $-42 | +1.0pp $-102 |
UW: 25.0% down · 7.5% · 30yr · 1.5% tax · 5.0% vac · 8.0% maint · 8.0% mgmt
Financing live
Cash to close
- Down payment
- $57,225
- Closing costs
- $6,867
- Reserves months
- —
- Total cash needed
- —
Loan-product check · same deal, 3 products live
Conventional
25% down · 7.5% · 30yr
- Down + closing
- —
- Monthly P&I
- —
- Monthly cashflow
- —
- DSCR
- —
- Eligible?
- —
Personal DTI + credit; lowest rate.
DSCR
20% down · 8.5% · 30yr
- Down + closing
- —
- Monthly P&I
- —
- Monthly cashflow
- —
- DSCR
- —
- Eligible?
- —
No personal income docs; deal must DSCR.
Hard money
10% down · 12.0% · 12mo
- Down + closing
- —
- Monthly P&I
- —
- Monthly cashflow
- —
- DSCR
- —
- Eligible?
- —
Short-term bridge; refi at stabilization.
Rent comps 22 comps
| Address | Beds | Baths | Sqft | Rent | $/sqft | DOM | Units | Dist |
|---|---|---|---|---|---|---|---|---|
| 1276 Century Oaks Dr Gulfport, MS | 3.0 | 3.0 | 1283 | $2,100 | $1.64 | 44d | 1 | 0.59mi |
| 1270 Century Oaks Dr Gulfport, MS | 3.0 | 3.0 | 1158 | $1,950 | $1.68 | 44d | 1 | 0.62mi |
| 1100 Century Oaks Dr Unit A Gulfport, MS | 3.0 | 3.0 | 1156 | $2,200 | $1.90 | 44d | 1 | 0.65mi |
| 1229 Century Oaks Dr Gulfport, MS | 3.0 | 3.0 | 1200 | $2,600 | $2.17 | 22d | 1 | 0.65mi |
| 1131 Century Oaks Dr Gulfport, MS | 3.0 | 3.0 | 1156 | $1,800 | $1.56 | 44d | 1 | 0.67mi |
| 1101 Century Oaks Dr Gulfport, MS | 3.0 | 3.0 | 1330 | $1,700 | $1.28 | 44d | 1 | 0.67mi |
| 986 Waterford Ln Gulfport, MS | 3.0 | 1.5 | 1000 | $1,650 | $1.65 | 44d | 1 | 0.70mi |
| 696 Hunters Glen Ln Gulfport, MS | 3.0 | 1.5 | 1000 | $1,800 | $1.80 | 22d | 1 | 0.72mi |
| 1525 E Pass Rd Gulfport, MS | 1.0–3.0 | 1.0–2.0 | 1070 | $1,519 | $1.42 | 22d | 1 | 0.73mi |
| 229 Milray Ln Gulfport, MS | 2.0 | 2.5 | 889 | $1,795 | $2.02 | 22d | 1 | 0.77mi |
| 2228 Beach Dr #506 Gulfport, MS | 2.0 | 2.0 | 1164 | $2,995 | $2.57 | 44d | 1 | 0.93mi |
| 2228 Beach Dr Gulfport, MS | 2.0 | 2.0 | 1279 | $2,895 | $2.26 | 22d | 1 | 0.93mi |
| 1956 E Pass Rd Gulfport, MS | 2.0 | 1.0 | 900 | $950 | $1.06 | 44d | 1 | 0.98mi |
| 477 Tegarden Rd Unit D Gulfport, MS | 3.0 | 2.0 | 1300 | $1,300 | $1.00 | 14d | 1 | 1.02mi |
| 710 Lindh Rd Gulfport, MS | 2.0 | 1.0 | 950 | $1,199 | $1.26 | 44d | 1 | 1.11mi |
| 1339 Foxwood Pl Gulfport, MS | 3.0 | 2.0 | 1100 | $1,375 | $1.25 | 44d | 1 | 1.14mi |
| 1114 Washington Ave Gulfport, MS | 3.0 | 2.0 | 1200 | $1,350 | $1.12 | 22d | 1 | 1.18mi |
| 880 Lindh Rd Gulfport, MS | 1.0–2.0 | 1.0 | 779 | $1,050 | $1.35 | 44d | 1 | 1.29mi |
| 190 Gateway Dr Biloxi, MS | 1.0–2.0 | 1.0–2.0 | 878 | $1,240 | $1.41 | 14d | 6 | 1.34mi |
| 2668 Beach Blvd Biloxi, MS | 2.0 | 2.0 | 1392 | $2,300 | $1.65 | 44d | 1 | 1.42mi |
| 248 Debuys Rd Biloxi, MS | 1.0–2.0 | 1.0–2.0 | 979 | $1,300 | $1.33 | 14d | 11 | 1.44mi |
| 2255 Switzer Rd Gulfport, MS | 1.0–3.0 | 1.0–2.0 | 1072 | $1,500 | $1.40 | 14d | 12 | 1.47mi |
Listing history 33 events
-
2026-06-18days on market $228,900 Active 63 DOM
-
2026-06-17days on market $228,900 Active 62 DOM
-
2026-06-16days on market $228,900 Active 61 DOM
-
2026-06-15days on market $228,900 Active 60 DOM
-
2026-06-14days on market $228,900 Active 58 DOM
-
2026-06-13days on market $228,900 Active 57 DOM
-
2026-06-10days on market $228,900 Active 55 DOM
-
2026-06-09days on market $228,900 Active 54 DOM
-
2026-06-08days on market $228,900 Active 53 DOM
-
2026-06-07days on market $228,900 Active 52 DOM
-
2026-06-05days on market $228,900 Active 49 DOM
-
2026-06-02days on market $228,900 Active 47 DOM
-
2026-06-01days on market $228,900 Active 46 DOM
-
2026-05-31days on market $228,900 Active 45 DOM
-
2026-05-30days on market $228,900 Active 44 DOM
-
2026-04-26price $237,000 431-char remark
Show marketing remark (431 chars)
Discover this beautifully updated 3-bedroom, 2-bath home--perfectly furnished and ready for you to settle in or invest. Enjoy living just minutes from the stunning Gulf Coast beaches, vibrant shopping destinations, and exciting entertainment options. Everything inside the home stays (except washer and dryer), making your move effortless. Don't miss out--schedule your viewing today and experience Gulf Coast living at its finest!
-
2026-04-15$245,000 Active 431-char remark
Show marketing remark (431 chars)
Discover this beautifully updated 3-bedroom, 2-bath home--perfectly furnished and ready for you to settle in or invest. Enjoy living just minutes from the stunning Gulf Coast beaches, vibrant shopping destinations, and exciting entertainment options. Everything inside the home stays (except washer and dryer), making your move effortless. Don't miss out--schedule your viewing today and experience Gulf Coast living at its finest!
-
2025-09-12soldstatus
-
2025-09-10soldstatus Closed 14-char remark
Show marketing remark (14 chars)
2330 Curcor Dr
-
2025-08-17status Pending 14-char remark
Show marketing remark (14 chars)
2330 Curcor Dr
-
2025-08-14$225,000 Active 14-char remark
Show marketing remark (14 chars)
2330 Curcor Dr
-
2024-08-30soldstatus Closed
-
2024-08-30soldstatus
-
2024-08-06status Pending
-
2024-07-31price $219,900
-
2024-07-01$225,000 Active
-
2024-04-15soldstatus
-
2024-04-01soldstatus Closed
-
2024-03-04status Pending
-
2024-02-27price $159,900
-
2024-01-31price $165,000
-
2023-10-24price $174,000
-
2023-10-07$177,000 Active
ⓘ Source: listings_history table (triggers on properties + properties_extension) + one-shot
backfill from property_details.listing_events for pre-trigger history.
Tax reassessment forecast MS · Resets to sale price
- Current annual tax
- $1,515 · $126/mo
- Projected year-2 tax
- $1,808 · $151/mo
- Expected delta
- +$293/yr (+$24/mo · 19.4%)
ⓘ Screening estimate from a state-policy table — verify with the county assessor before closing.
Climate risk First Street
- Flood 5/10 Major FEMA zone X (shaded) · 24% chance over 30 yrs
- Wildfire 1/10 Low
- Heat 10/10 Extreme 7 d/yr ≥106°F today · 23 d/yr by 30 yrs out
- Wind 9/10 Extreme 99% chance of damaging wind over 30 yrs
- Air quality 3/10 Moderate 2 unhealthy d/yr today · 3 by 30 yrs out
Nearby sold comps map
Loading sold comps map…
Walkable amenities ~0.75 mi
Loading nearby amenities…
Taxation est. · year 1
- Rental income
- $21,866
- − Mortgage interest
- −$12,822
- − Property taxes
- −$1,515
- − Insurance
- −$1,144
- − Repairs & maintenance
- −$1,749
- − Management
- −$1,749
- − Depreciation
- −$6,659
- Taxable loss
- −$3,773
- Est. tax savings @ 24.0%
- +$906
- After-tax cash flow
- $1,116/yr
For passive investors: Depreciation is non-cash, so a rental often shows a tax loss while cash-flowing — sheltering income. Rental losses are passive: they offset passive income freely, and up to $25,000/yr can offset ordinary (W-2) income if you actively participate and your MAGI is under $100k (phasing out to $0 by $150k); unused losses carry forward. On sale, claimed depreciation is recaptured at up to 25%, and gains may owe capital-gains tax (a 1031 exchange can defer both). Figures are a year-1 estimate at your 24.0% rate — not tax advice; consult a CPA.
Schools (NCES district)
- District
- Gulfport School District
- NCES district ID
- 2801710
- Math proficiency
- 41% ▼ -15.00%
- Reading proficiency
- 42% ▼ -6.00%
- Median HH income
- $35,712
- Composite
- 34.38/100
- National rank
- #5213
- State rank
- #37 of 130 in MS
Livability — Gulfport
- Score
- 73/100
- State rank
- #15
- US rank
- #5010
Category grades
Schools grade is shown separately in the Schools card above.
Census & demographics
- Census place
- Gulfport, MS
- County
- Harrison County · 178,171 people
- City population
- 96,188
- Metro
- Gulfport-Biloxi, MS
- Population (ZIP)
- 18,564
- Household income
- $54,657
- Rent vs Own
- Severe rent burden
- 1059.0
Population outlook (Harrison County) Hauer SSP2
- Today (2025)
- 228,444 people
- By 2030
- 241,942 · +5.9%
- By 2040
- 267,531 · +17.1%
- By 2050
- 291,062 · +27.4%
- By 2075
- 346,711 · +51.8%
- By 2100
- 378,165 · +65.5%
Race, ethnicity, and origin ACS 2023
- Neighborhood character
- Majority White (65%)
- Race & ethnicity
- White 65% Black 24% Hispanic / Latino 6% Two or more races 5% Asian 1%
- Hispanic origin (detail)
- Mexican 2% Cuban 1%
- Common ancestry
- Slovak 4% Lithuanian 4% Romanian 2%
- Foreign-born
- 4% · Canada
- Languages at home
- 94% English-only · Spanish 2% French/Haitian/Cajun 2% Other Indo-European 1%
Political lean MEDSL · Harrison
- 2024 margin
- Strong R (+28.9) · D 35.0% · R 63.9% · Other 1.1%
- 2008→2024 swing
- -2.9pp toward R · 2008: -26.0pp · 2024: -28.9pp
- All cycles
- 2024: R+28.9 2020: R+25.2 2016: R+30.7 2012: R+26.6 2008: R+26.0
Not yet ingested
- Civics
- —
Market trends
- HPI YoY
- ▼ -67.48%
- Current HPI
- 181.6606
- Rent YoY
- ▲ 4.26%
- Metro
- Gulfport-Biloxi, MS
- State GDP YoY
- —
- F500 in state
- 0
Price history
+33.9% since first listed18 events — show timeline
- 2026-04-26 Price Changed $237,000 MLSU
- 2026-04-15 Listed $245,000 MLSU
- 2025-09-12 Sold (Public Records) — Public Records
- 2025-09-10 Sold (MLS) — MLSU
- 2025-08-17 Pending — MLSU
- 2025-08-14 Listed $225,000 MLSU
- 2024-08-30 Sold (Public Records) — Public Records
- 2024-08-30 Sold (MLS) — MLSU
- 2024-08-06 Pending — MLSU
- 2024-07-31 Price Changed $219,900 MLSU
- 2024-07-01 Listed $225,000 MLSU
- 2024-04-15 Sold (Public Records) — Public Records
- 2024-04-01 Sold (MLS) — MLSU
- 2024-03-04 Pending — MLSU
- 2024-02-27 Price Changed $159,900 MLSU
- 2024-01-31 Price Changed $165,000 MLSU
- 2023-10-24 Price Changed $174,000 MLSU
- 2023-10-07 Listed $177,000 MLSU
Cash-flow waterfall
monthlySold comps — $/sqft
last 12 mo · ≤1 miLoading sold comps…