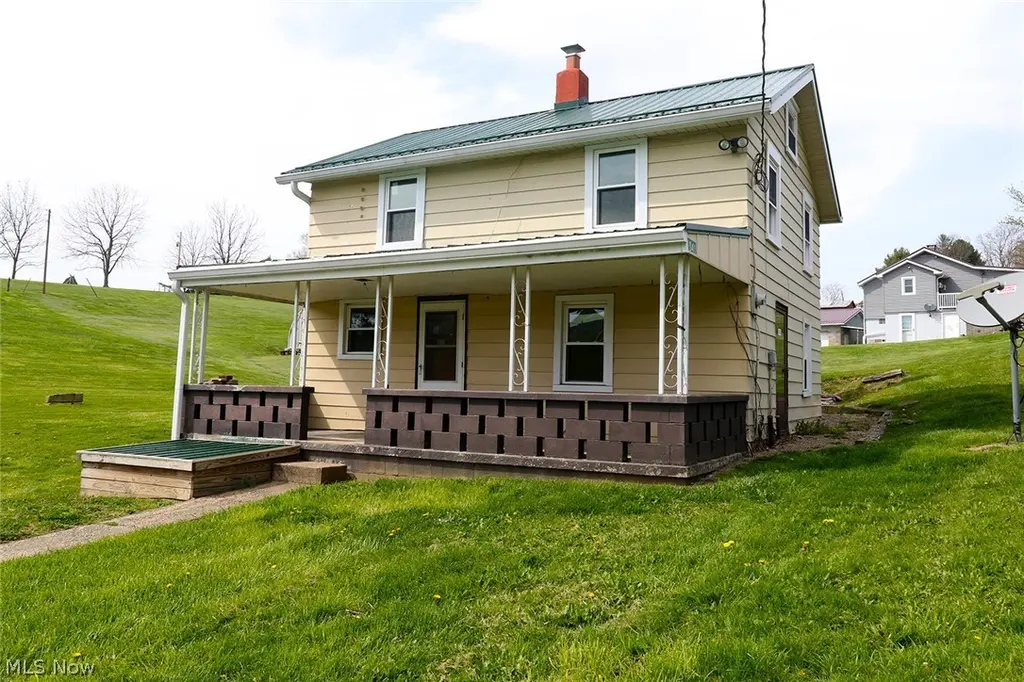
1041 County Road 14 · Connorville, OH
Flood risk 1/10 · Minimal
- FEMA flood zone
- X (unshaded)
- Chance of flooding over 30 yrs
- 0.0%
- Est. flood insurance / yr
- $473 – $860
Fire risk 3/10 · Minor
- Est. fire insurance / yr
- $713 – $1,323
Heat risk 3/10 · Minor
- Hot days now (above 97°F)
- 7 days/yr
- Hot days in 30 yrs
- 18 days/yr
Wind risk 1/10 · Minimal
- Chance of severe wind over 30 yrs
- —
Air-quality risk 2/10 · Minimal
- Unhealthy air days now
- 0 days/yr
- Unhealthy air days in 30 yrs
- 1 days/yr
Risk factors via First Street. Map © Google.
Why this score? — see what drove the D grade
The composite is a weighted blend of 9 inputs, each scored 0–100. Each bar is that input's sub-score; the figure is the points it added to the 100-point composite (weight × sub-score).
- Cash flow +11.0/30.0
- ARV discount +7.5/15.0
- Appreciation +5.8/10.0
- Schools +4.1/10.0
- DSCR +3.2/10.0
- Livability +2.9/5.0
- Rent growth +2.5/5.0
- Condition / age +2.5/5.0
- 1% rule +2.0/10.0
$149,000
🖨 Deal sheet (PDF) 📄 Offer letter ✓ Due diligence
Listing remarks
Plenty of room in the 1800-plus square foot home. Original construction 100 years, but well-kept and remodeled over the years, large addition added in 2012 also includes large two-car garage. Large eat-in kitchen with the washer and dryer so no steps for washing clothes. Very nice country location, approximately three miles from Buckeye Local High school and State Route 150 an additional three miles to State Route 7. Plenty of opportunity and plenty of room.
Key facts
- Large eat-in kitchen
- Large addition
- 1.27 acre lot
Tags
Property features AI
Exterior
- Parking: Front-facing garage; 2-car garage
- Utilities: Septic tank; Well water
- Home design: Two-story home; Aluminum siding exterior
- Construction: Metal roof; Block foundation; Built (year per assessor)
- Exterior features: Front porch; Back yard; Landscaped lot (approx. 1.27 acres); Gravel parking area
Interior
- Kitchen: Eat-in kitchen on the first floor; Kitchen includes washer and dryer
- Bedrooms: Second-floor bedroom (approx. 24 x 19.11) with carpet; Second-floor bedroom (approx. 14.2 x 9.2) with wood flooring; Second-floor bedroom (approx. 8.3 x 13.4) with wood flooring
- Flooring: Carpet in at least one bedroom; Wood flooring in family room and multiple bedrooms; Linoleum in kitchen; Tile in first-floor bathroom; Other flooring in living room
- Bathrooms: Two full bathrooms; One main-level bathroom; Second-floor bathroom (approx. 9.1 x 7.11); First-floor bathroom (approx. 8.6 x 10.0) with tile flooring
- Heating & cooling: Central air and window unit(s) for cooling; Heating by baseboard, forced air, and gas
- Interior features: Double-pane windows; Ceiling fan(s); Entrance foyer; Eat-in kitchen; Partial, unfinished basement; Wood burning stove in family room (fireplace)
- Laundry & utility: Laundry located in the kitchen (washer and dryer included)
Neighborhood map
What this means for you Summary
Snapshot
- This is a 3-bed/1.0-bath single-family listed at $149k.
Deal economics
- At list price, monthly cash flow is $-62 ($-745/yr) — negative.
- To cash-flow at today's rent, offer at most $138k (7.4% below list).
- To meet the 1% rule (rent ≥ 1% of price), the offer needs to be $104k (30.0% below list).
- Recommended offer: $104k (30.0% below list) — sets the bar for 1% rule.
Location & tenants
- Location reads 57/100 on livability (#1,089 in OH) — a working-class tenant base; expect higher turnover. Strengths: cost of living A+, schools A, crime A; Watch: employment C-, amenities F, commute F.
- Buckeye Local (rural): math 44% / reading 53% proficiency, ranked #471 of 656 in OH (top 72%) — families likely to look elsewhere, expect single-tenant / working-renter base with shorter leases.
- Market conditions: 9 active listings in the ZIP; 2 units permitted in Jefferson County in 2024 (0 in 5+ unit buildings).
Forward outlook
- In year one you build about $3k of equity ($1k loan paydown + $2k appreciation (1.6% local appreciation)).
- Jefferson County population projected at -19% by 2050 — secular population decline; favor cash flow + early exit over multi-decade hold.
- At projected returns (1.6% appreciation + 3.0% rent growth), your $42k cash investment doubles in ~10 years — after that, you're playing with house money.
- By year 10, paydown + projected appreciation supports a ~$34k cash-out refi (75% LTV) — recoverable capital for the next deal without selling this one.
Negotiation context
- It's been on market 68 days — a 6% lower offer ($140k) is reasonable based on typical stale-listing flexibility.
Questions for the listing agent
- What do current leases actually rent for vs. the listed asking? Can we see a recent rent roll and the last 12 months of T-12 income?
- It's been on market 68 days. Have you received any prior offers? Is the seller open to a 30% concession, seller financing, or rate buy-down credit?
- Why hasn't it sold? Are there any deal-killer items the seller is aware of (foundation, flood, title, zoning, code violations)?
- Is there a deadline driving the sale (1031 exchange, divorce, estate, relocation)? That informs how much negotiation room exists.
- Schools are A-rated — typically a magnet for longer-tenancy family renters. What's the average tenant stay here, and is there a school-zone premium baked into asking?
- The area grade is low — what's the realistic commute time and amenity access for the typical tenant pool here? Any planned neighborhood developments (good or bad) we should know about?
- What's the average days-on-market for RENTAL listings here right now (not sales)? A rising rental-DOM trend means longer vacancies and softer asking-rent achievability than the comps imply.
- What's the recent tenant-quality profile in this submarket — average credit score on applications, eviction rate, late-payment / NSF rate, and stable-employment percentage? A property-management company in the area should have these aggregated.
- How much new for-sale + rental construction is in the pipeline within 1–3 miles? Heavy new supply typically softens prices + rents 12–24 months out; constrained supply supports both.
Investment metrics
- 1% rule
- 0.70% ✗
- Cap rate
- 5.79%
- Cash-on-cash
- -1.79%
- DSCR
- 0.92
- GRM
- 11.9
CMA / ARV
No comps found within radius.
Projected returns pro-forma
1.58% appreciation · 3.0% rent growth · sell at horizon
- IRR
- 1.4%
- Equity multiple
- 1.07×
- Total profit
- $3,069
- Equity at exit
- $55,450
- IRR
- 5.7%
- Equity multiple
- 1.74×
- Total profit
- $30,705
- Equity at exit
- $77,374
Cash invested: $41,720 (down + closing). Projections, not guarantees.
Landlord ↔ Tenant lean methodology
- Overall (STATE)
- 73 Landlord-Friendly
- State Ohio
- 73 Landlord-Friendly · R+6
- County
- — inherits STATE
- City
- — inherits STATE
ZIP-level market 43943
- Home prices YoY
- 1.1%
- Active inventory
- 9
- Price-to-rent
- 11.9×
Monthly cashflow live
- Estimated rent
- $1,042 medium interval (Pro) →
- Mortgage (P&I)
- −$781
- Tax from tax record
- −$42 /mo · $504/yr
- Insurance
- −$62
- HOA
- −$0
- Vacancy / Maint / Mgmt
- −$219
- Net cashflow
- $-62
Break-even live
Sensitivity live
| Price | -10% $22 | -5% $-20 | +0% $-62 | +5% $-104 | +10% $-146 |
|---|---|---|---|---|---|
| Rent | -10% $-144 | -5% $-103 | +0% $-62 | +5% $-21 | +10% $20 |
| Rate | -1.0pp $13 | -0.5pp $-24 | base $-62 | +0.5pp $-101 | +1.0pp $-140 |
UW: 25.0% down · 7.5% · 30yr · 1.5% tax · 5.0% vac · 8.0% maint · 8.0% mgmt
Financing live
Cash to close
- Down payment
- $37,250
- Closing costs
- $4,470
- Reserves months
- —
- Total cash needed
- —
Loan-product check · same deal, 3 products live
Conventional
25% down · 7.5% · 30yr
- Down + closing
- —
- Monthly P&I
- —
- Monthly cashflow
- —
- DSCR
- —
- Eligible?
- —
Personal DTI + credit; lowest rate.
DSCR
20% down · 8.5% · 30yr
- Down + closing
- —
- Monthly P&I
- —
- Monthly cashflow
- —
- DSCR
- —
- Eligible?
- —
No personal income docs; deal must DSCR.
Hard money
10% down · 12.0% · 12mo
- Down + closing
- —
- Monthly P&I
- —
- Monthly cashflow
- —
- DSCR
- —
- Eligible?
- —
Short-term bridge; refi at stabilization.
Listing history 16 events
-
2026-06-21days on market $149,000 Active 68 DOM
-
2026-06-18days on market $149,000 Active 66 DOM
-
2026-06-17days on market $149,000 Active 65 DOM
-
2026-06-16days on market $149,000 Active 64 DOM
-
2026-06-15days on market $149,000 Active 63 DOM
-
2026-06-13days on market $149,000 Active 61 DOM
-
2026-06-12days on market $149,000 Active 60 DOM
-
2026-06-09days on market $149,000 Active 57 DOM
-
2026-06-08days on market $149,000 Active 56 DOM
-
2026-06-07days on market $149,000 Active 55 DOM
-
2026-06-07days on market $149,000 Active 54 DOM
-
2026-06-04days on market $149,000 Active 51 DOM
-
2026-06-02days on market $149,000 Active 50 DOM
-
2026-06-01days on market $149,000 Active 49 DOM
-
2026-05-31remarks 462-char remark
-
2026-05-31$149,000 Active 48 DOM
ⓘ Source: listings_history table (triggers on properties + properties_extension) + one-shot
backfill from property_details.listing_events for pre-trigger history.
Tax reassessment forecast OH · Partial reset (capped growth)
- Current annual tax
- $504 · $42/mo
- Projected year-2 tax
- $1,414 · $118/mo
- Expected delta
- +$910/yr (+$76/mo · 180.6%)
ⓘ Screening estimate from a state-policy table — verify with the county assessor before closing.
Climate risk First Street
- Flood 1/10 Low FEMA zone X (unshaded) · 0% chance over 30 yrs
- Wildfire 3/10 Moderate
- Heat 3/10 Moderate 7 d/yr ≥97°F today · 18 d/yr by 30 yrs out
- Wind 1/10 Low
- Air quality 2/10 Low 0 unhealthy d/yr today · 1 by 30 yrs out
Nearby sold comps map
Loading sold comps map…
Walkable amenities ~0.75 mi
Loading nearby amenities…
Taxation est. · year 1
- Rental income
- $12,507
- − Mortgage interest
- −$8,346
- − Property taxes
- −$504
- − Insurance
- −$745
- − Repairs & maintenance
- −$1,001
- − Management
- −$1,001
- − Depreciation
- −$4,335
- Taxable loss
- −$3,424
- Est. tax savings @ 24.0%
- +$822
- After-tax cash flow
- $77/yr
For passive investors: Depreciation is non-cash, so a rental often shows a tax loss while cash-flowing — sheltering income. Rental losses are passive: they offset passive income freely, and up to $25,000/yr can offset ordinary (W-2) income if you actively participate and your MAGI is under $100k (phasing out to $0 by $150k); unused losses carry forward. On sale, claimed depreciation is recaptured at up to 25%, and gains may owe capital-gains tax (a 1031 exchange can defer both). Figures are a year-1 estimate at your 24.0% rate — not tax advice; consult a CPA.
Schools (NCES district)
- District
- Buckeye Local
- NCES district ID
- 3904778
- Math proficiency
- 44% ▼ -18.00%
- Reading proficiency
- 53% ▼ -10.00%
- Median HH income
- $41,332
- Composite
- 40.68/100
- National rank
- #3673
- State rank
- #471 of 656 in OH
Livability — Connorville
- Score
- 57/100
- State rank
- #1089
- US rank
- #21837
Category grades
Schools grade is shown separately in the Schools card above.
Census & demographics
- County
- Jefferson · 64,369 people
- Metro
- Weirton-Steubenville, WV-OH
- Population (ZIP)
- 3,288
- Household income
- $49,569
- Rent vs Own
- Severe rent burden
- 5.9
Population outlook (Jefferson County) Hauer SSP2
- Today (2025)
- 63,481 people
- By 2030
- 61,067 · -3.8%
- By 2040
- 55,860 · -12.0%
- By 2050
- 51,236 · -19.3%
- By 2075
- 41,804 · -34.1%
- By 2100
- 32,344 · -49.0%
Race, ethnicity, and origin ACS 2023
- Neighborhood character
- Predominantly White (97%)
- Race & ethnicity
- White 97% Two or more races 1%
- Common ancestry
- Romanian 15% Polish 2% Serbian 1%
- Foreign-born
- 0%
- Languages at home
- 98% English-only · Other Indo-European 1%
Political lean MEDSL · Jefferson
- 2024 margin
- Solid R (+43.9) · D 27.5% · R 71.4% · Other 1.1%
- 2008→2024 swing
- -44.1pp toward R · 2008: 0.2pp · 2024: -43.9pp
- All cycles
- 2024: R+43.9 2020: R+38.4 2016: R+35.7 2012: R+5.5 2008: D+0.2
Not yet ingested
- Civics
- —
Market trends
- HPI YoY
- ▲ 1.58%
- Current HPI
- 138.7959
- Rent YoY
- —
- Metro
- —
- State GDP YoY
- ▲ 1.98%
- F500 in state
- 48
Industry mix (Fortune 500 HQ in OH)
| Industry | F500 HQs | Revenue |
|---|---|---|
| Insurance | 3 | $145B |
|
||
| Industrial Machinery | 3 | $49B |
|
||
| Financial Services | 3 | $24B |
|
||
| Consumer Goods | 2 | $93B |
|
||
| Aerospace / Defense | 2 | $47B |
|
||
| Utilities | 2 | $33B |
|
||
Price history
1 event — show timeline
- 2026-04-13 Listed $149,000 MLSNOW
Property tax history
+1.4%/yrLatest (2025): $504 · -4.3% YoY. Source: county tax records.
Cash-flow waterfall
monthlySold comps — $/sqft
last 12 mo · ≤1 miLoading sold comps…