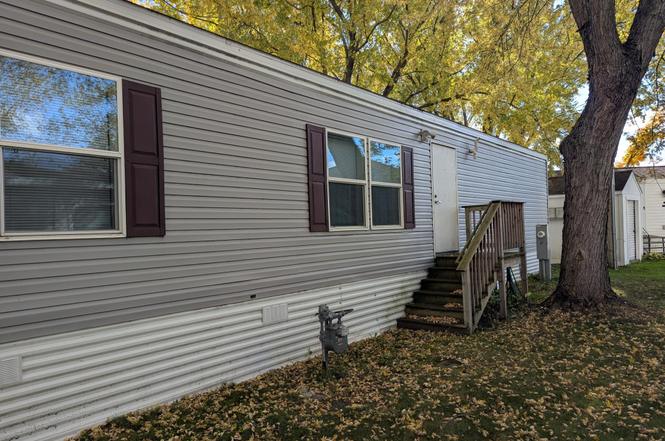
46 Lee St · Forest Lake, MN
Flood risk 1/10 · Minimal
- FEMA flood zone
- X (unshaded)
- Chance of flooding over 30 yrs
- 0.0%
- Est. flood insurance / yr
- $473 – $860
Fire risk 2/10 · Minimal
- Est. fire insurance / yr
- $888 – $1,650
Heat risk 2/10 · Minimal
- Hot days now (above 100°F)
- 7 days/yr
- Hot days in 30 yrs
- 14 days/yr
Wind risk 2/10 · Minimal
- Chance of severe wind over 30 yrs
- —
Air-quality risk 2/10 · Minimal
- Unhealthy air days now
- 1 days/yr
- Unhealthy air days in 30 yrs
- 2 days/yr
Risk factors via First Street. Map © Google.
Why this score? — see what drove the B grade
The composite is a weighted blend of 9 inputs, each scored 0–100. Each bar is that input's sub-score; the figure is the points it added to the 100-point composite (weight × sub-score).
- Cash flow +30.0/30.0
- 1% rule +10.0/10.0
- DSCR +10.0/10.0
- ARV discount +7.5/15.0
- Schools +4.5/10.0
- Livability +3.8/5.0
- Rent growth +3.3/5.0
- Condition / age +2.5/5.0
- Appreciation +0.0/10.0
$52,900
🖨 Deal sheet (PDF) 📄 Offer letter ✓ Due diligence
Listing remarks
Here's your chance to own an affordable 3 bed/2 bath home in a professionally managed park only minutes from restaurants, shopping, and public access to Forest Lake. Efficient floor plan and charming updates to finishes. Kitchen appliances and washer/dryer are included, and next-to-new shed stays and provides great storage for your all your outside toys. Brand new furnace just installed. Lot rent includes water, sewer and garbage service.
Key facts
- Built 2017
- Listed 145 days
Neighborhood map
What this means for you Summary
Snapshot
- This is a 2-bed/2.0-bath single-family listed at $53k.
Deal economics
- At list price, monthly cash flow is $947 ($11k/yr) — positive.
- The deal already cash-flows at list — no discount required.
- Meets the 1% rule at list price ($2k rent vs $53k).
- Recommended offer: $47k (12.0% below list) — sets the bar for market timing.
- Cap rate 27.8% vs local median 3.1% in Forest Lake — top-decile yield for the area; either an underpriced asset or a hidden risk that comps aren't pricing in. Stress-test before assuming the spread holds.
Location & tenants
- Location reads 75/100 on livability (#194 in MN, #4,132 nationally) — a middle-class / working-renter tenant base. Strengths: schools A+, employment A+, housing A+; Watch: cost of living C-, amenities F, commute F.
- Forest Lake Public School District (town): math 48% / reading 52% proficiency, ranked #90 of 301 in MN (top 30%) — acceptable for families but not a draw, mixed tenant base, ~2y average lease; only 17% free/reduced lunch — higher-income household profile.
- Market conditions: Rents rising (+3.3%/yr); 164 active listings in the ZIP; 6 comparable units currently listed for rent nearby; rentals leasing fast (median 0d on market — plan ~1-2 weeks tenant-placement turnaround); solid renter incomes; 1,405 units permitted in Washington County in 2024 (121 in 5+ unit buildings).
Forward outlook
- Local home prices are declining (-3.0%/yr); year-one equity from $366 of loan paydown is wiped out by about $2k of value loss. Plan a longer hold.
- Washington County population projected at +16% by 2050 — long-run rental-demand tailwind backs the buy-and-hold thesis.
- At projected returns (-3.0% appreciation + 3.3% rent growth), your $15k cash investment doubles in ~2 years — after that, you're playing with house money.
Negotiation context
- It's been on market 145 days — a 12% lower offer ($47k) is reasonable based on typical stale-listing flexibility.
Questions for the listing agent
- It's been on market 145 days. Have you received any prior offers? Is the seller open to a 12% concession, seller financing, or rate buy-down credit?
- Why hasn't it sold? Are there any deal-killer items the seller is aware of (foundation, flood, title, zoning, code violations)?
- Is there a deadline driving the sale (1031 exchange, divorce, estate, relocation)? That informs how much negotiation room exists.
- Schools are A-rated — typically a magnet for longer-tenancy family renters. What's the average tenant stay here, and is there a school-zone premium baked into asking?
- What's the average days-on-market for RENTAL listings here right now (not sales)? A rising rental-DOM trend means longer vacancies and softer asking-rent achievability than the comps imply.
- What's the recent tenant-quality profile in this submarket — average credit score on applications, eviction rate, late-payment / NSF rate, and stable-employment percentage? A property-management company in the area should have these aggregated.
- How much new for-sale + rental construction is in the pipeline within 1–3 miles? Heavy new supply typically softens prices + rents 12–24 months out; constrained supply supports both.
Investment metrics
- 1% rule
- 3.14% ✓
- Cap rate
- 27.77%
- Cash-on-cash
- 76.69%
- DSCR
- 4.41
- GRM
- 2.7
CMA / ARV
No comps found within radius.
Projected returns pro-forma
-3.0% appreciation · 3.33% rent growth · sell at horizon
- IRR
- 77.0%
- Equity multiple
- 4.53×
- Total profit
- $52,296
- Equity at exit
- $7,888
- IRR
- 80.7%
- Equity multiple
- 9.48×
- Total profit
- $125,559
- Equity at exit
- $4,574
Cash invested: $14,812 (down + closing). Projections, not guarantees.
Landlord ↔ Tenant lean methodology
- Overall (STATE)
- 46 Balanced
- State Minnesota
- 46 Balanced · D+2
- County
- — inherits STATE
- City
- — inherits STATE
ZIP-level market 55025
- Rents YoY
- 3.3%
- Active inventory
- 164
- Price-to-rent
- 2.7×
Monthly cashflow live
- Estimated rent
- $1,661 high interval (Pro) →
- Mortgage (P&I)
- −$277
- Tax est. 1.5%
- −$66 /mo · $794/yr
- Insurance
- −$22
- HOA
- −$0
- Vacancy / Maint / Mgmt
- −$349
- Net cashflow
- $947
Break-even live
Sensitivity live
| Price | -10% $983 | -5% $965 | +0% $947 | +5% $928 | +10% $910 |
|---|---|---|---|---|---|
| Rent | -10% $815 | -5% $881 | +0% $947 | +5% $1,012 | +10% $1,078 |
| Rate | -1.0pp $973 | -0.5pp $960 | base $947 | +0.5pp $933 | +1.0pp $919 |
UW: 25.0% down · 7.5% · 30yr · 1.5% tax · 5.0% vac · 8.0% maint · 8.0% mgmt
Financing live
Cash to close
- Down payment
- $13,225
- Closing costs
- $1,587
- Reserves months
- —
- Total cash needed
- —
Loan-product check · same deal, 3 products live
Conventional
25% down · 7.5% · 30yr
- Down + closing
- —
- Monthly P&I
- —
- Monthly cashflow
- —
- DSCR
- —
- Eligible?
- —
Personal DTI + credit; lowest rate.
DSCR
20% down · 8.5% · 30yr
- Down + closing
- —
- Monthly P&I
- —
- Monthly cashflow
- —
- DSCR
- —
- Eligible?
- —
No personal income docs; deal must DSCR.
Hard money
10% down · 12.0% · 12mo
- Down + closing
- —
- Monthly P&I
- —
- Monthly cashflow
- —
- DSCR
- —
- Eligible?
- —
Short-term bridge; refi at stabilization.
Rent comps 6 comps
| Address | Beds | Baths | Sqft | Rent | $/sqft | DOM | Units | Dist |
|---|---|---|---|---|---|---|---|---|
| 1081 4th St SW Forest Lake, MN | 1.0–3.0 | 1.0–2.0 | 939 | $2,026 | $2.16 | 0d | 12 | 0.50mi |
| 407 11th Ave SW Forest Lake, MN | 2.0 | 1.0–2.0 | 775 | $1,741 | $2.25 | 0d | 34 | 0.58mi |
| 525 4th St SW Forest Lake, MN | 2.0–3.0 | 1.0 | 1070 | $1,629 | $1.52 | 0d | 9 | 0.80mi |
| 231 4th Ave NW Forest Lake, MN | 1.0–2.0 | 1.0 | 763 | $1,349 | $1.77 | 0d | 5 | 0.87mi |
| 956 12th St SW Forest Lake, MN | 1.0–2.0 | 1.0 | 830 | $1,279 | $1.54 | 5d | 6 | 1.00mi |
| 607 W Broadway Ave Forest Lake, MN | 2.0 | 1.0 | 960 | $1,400 | $1.46 | 25d | 1 | 1.26mi |
Listing history 6 events
-
2026-03-18status Pending
-
2026-03-04historical Contingent - Inspection
-
2025-12-18price $52,900
-
2025-11-29price $54,900
-
2025-10-25$57,500 Active
-
2025-10-22historical $57,500
ⓘ Source: listings_history table (triggers on properties + properties_extension) + one-shot
backfill from property_details.listing_events for pre-trigger history.
Climate risk First Street
- Flood 1/10 Low FEMA zone X (unshaded) · 0% chance over 30 yrs
- Wildfire 2/10 Low
- Heat 2/10 Low 7 d/yr ≥100°F today · 14 d/yr by 30 yrs out
- Wind 2/10 Low
- Air quality 2/10 Low 1 unhealthy d/yr today · 2 by 30 yrs out
Nearby sold comps map
Loading sold comps map…
Walkable amenities ~0.75 mi
Loading nearby amenities…
Taxation est. · year 1
- Rental income
- $19,932
- − Mortgage interest
- −$2,963
- − Property taxes
- −$794
- − Insurance
- −$264
- − Repairs & maintenance
- −$1,595
- − Management
- −$1,595
- − Depreciation
- −$1,539
- Taxable income
- $11,183
- Est. tax owed @ 24.0%
- −$2,684
- After-tax cash flow
- $8,675/yr
For passive investors: Depreciation is non-cash, so a rental often shows a tax loss while cash-flowing — sheltering income. Rental losses are passive: they offset passive income freely, and up to $25,000/yr can offset ordinary (W-2) income if you actively participate and your MAGI is under $100k (phasing out to $0 by $150k); unused losses carry forward. On sale, claimed depreciation is recaptured at up to 25%, and gains may owe capital-gains tax (a 1031 exchange can defer both). Figures are a year-1 estimate at your 24.0% rate — not tax advice; consult a CPA.
Schools (NCES district)
- District
- Forest Lake Public School District
- NCES district ID
- 2712270
- Math proficiency
- 48% ▼ -12.00%
- Reading proficiency
- 52% ▼ -9.00%
- Median HH income
- $75,736
- Composite
- 45.24/100
- National rank
- #2664
- State rank
- #90 of 301 in MN
Livability — Forest Lake
- Score
- 75/100
- State rank
- #194
- US rank
- #4132
Category grades
Schools grade is shown separately in the Schools card above.
Census & demographics
- Census place
- Forest Lake, MN
- County
- Washington County · 235,613 people
- City population
- 25,891
- Metro
- Minneapolis-St. Paul-Bloomington, MN-WI
- Population (ZIP)
- 25,891
- Household income
- $98,382
- Rent vs Own
- Severe rent burden
- 420.0
Population outlook (Washington County) Hauer SSP2
- Today (2025)
- 278,554 people
- By 2030
- 290,465 · +4.3%
- By 2040
- 310,014 · +11.3%
- By 2050
- 324,118 · +16.4%
- By 2075
- 362,697 · +30.2%
- By 2100
- 381,491 · +37.0%
Race, ethnicity, and origin ACS 2023
- Neighborhood character
- Predominantly White (84%)
- Race & ethnicity
- White 84% Asian 5% Two or more races 5% Hispanic / Latino 4% Black 3%
- Common ancestry
- Portuguese 10% Romanian 4% Lithuanian 3%
- Foreign-born
- 5% · Canada, China
- Languages at home
- 92% English-only · Other Asian/Pacific 3% Spanish 2% Chinese 1%
Political lean MEDSL · Washington
- 2024 margin
- Lean D (+8.9) · D 53.5% · R 44.6% · Other 1.9%
- 2008→2024 swing
- +4.6pp toward D · 2008: 4.3pp · 2024: 8.9pp
- All cycles
- 2024: D+8.9 2020: D+9.2 2016: D+1.9 2012: D+0.8 2008: D+4.3
Not yet ingested
- Civics
- —
Market trends
- HPI YoY
- ▼ -280.92%
- Current HPI
- 235.3166
- Rent YoY
- ▲ 3.33%
- Metro
- Minneapolis-St. Paul-Bloomington, MN-WI
- State GDP YoY
- ▲ 2.41%
- F500 in state
- 34
Industry mix (Fortune 500 HQ in MN)
| Industry | F500 HQs | Revenue |
|---|---|---|
| Healthcare | 2 | $407B |
|
||
| Retail | 2 | $150B |
|
||
| Consumer Goods | 2 | $32B |
|
||
| Industrial Machinery | 2 | $6B |
|
||
| Agriculture | 1 | $40B |
|
||
| Healthcare / Medical Devices | 1 | $32B |
|
||
Price history
-8.0% since first listed6 events — show timeline
- 2026-03-18 Pending — NORTHSTARMLS as Distributed by MLS Grid
- 2026-03-04 Contingent — NORTHSTARMLS as Distributed by MLS Grid
- 2025-12-18 Price Changed $52,900 NORTHSTARMLS as Distributed by MLS Grid
- 2025-11-29 Price Changed $54,900 NORTHSTARMLS as Distributed by MLS Grid
- 2025-10-25 Listed $57,500 NORTHSTARMLS as Distributed by MLS Grid
- 2025-10-22 Coming Soon $57,500 NORTHSTARMLS as Distributed by MLS Grid
Cash-flow waterfall
monthlySold comps — $/sqft
last 12 mo · ≤1 miLoading sold comps…