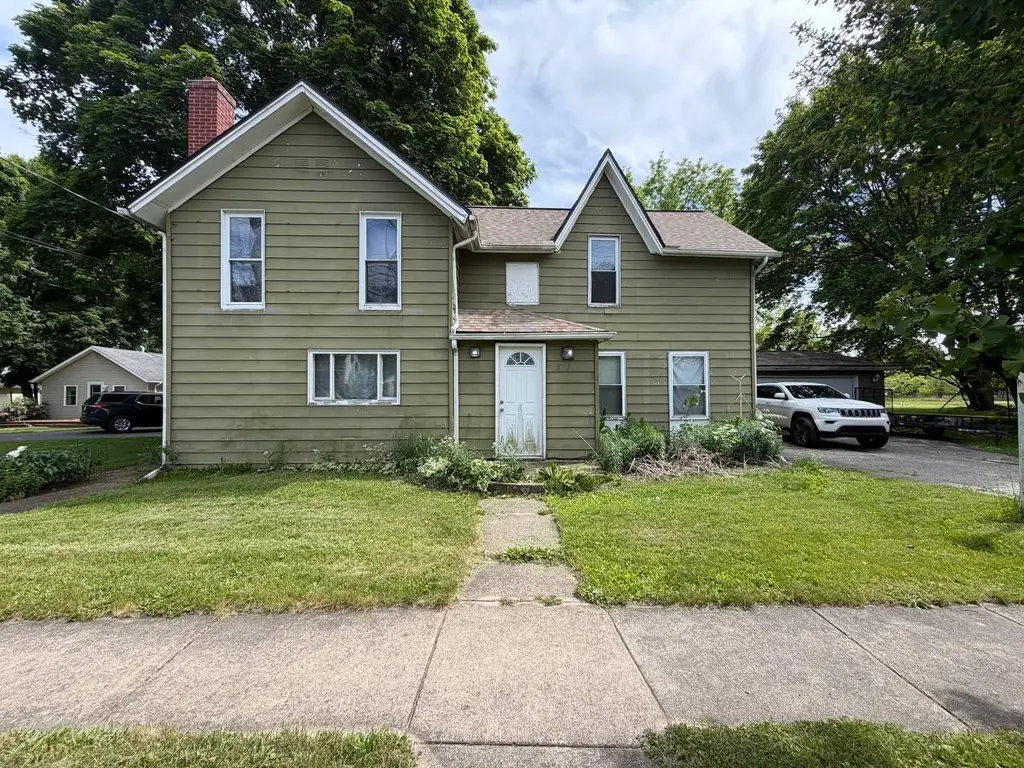
831 W Hanover St · Marshall, MI
Flood risk 1/10 · Minimal
- FEMA flood zone
- X (unshaded)
- Chance of flooding over 30 yrs
- 0.0%
- Est. flood insurance / yr
- $473 – $860
Fire risk 3/10 · Minor
- Est. fire insurance / yr
- $784 – $1,456
Heat risk 3/10 · Minor
- Hot days now (above 98°F)
- 7 days/yr
- Hot days in 30 yrs
- 16 days/yr
Wind risk 2/10 · Minimal
- Chance of severe wind over 30 yrs
- —
Air-quality risk 2/10 · Minimal
- Unhealthy air days now
- 1 days/yr
- Unhealthy air days in 30 yrs
- 2 days/yr
Risk factors via First Street. Map © Google.
Why this score? — see what drove the B+ grade
The composite is a weighted blend of 9 inputs, each scored 0–100. Each bar is that input's sub-score; the figure is the points it added to the 100-point composite (weight × sub-score).
- Cash flow +30.0/30.0
- ARV discount +15.0/15.0
- 1% rule +10.0/10.0
- DSCR +10.0/10.0
- Livability +3.6/5.0
- Schools +3.1/10.0
- Rent growth +2.5/5.0
- Condition / age +2.5/5.0
- Appreciation +0.0/10.0
$95,000
🖨 Deal sheet 📄 Offer letter ✓ Due diligence
Listing remarks MLS
INVESTOR SPECIAL - AS-IS. 2BR/2BA, 1,902 sqft on the BIGGEST LOT IN THE AREA - huge upside! Full rehab needed, BUT major mechanicals are DONE: 2022 roof, HVAC, furnace, heat
Key facts
- Hvac
- Biggest lot
- 2022 roof
Tags
Property features AI
Exterior
- Parking: Detached garage; 2 garage spaces; No attached garage
- Home design: Single-family residence; Residential property; Other architectural style; Built in 1915; Living area approximately 1,902
- Construction: Vinyl siding
- Exterior features: Public water; Lot of approximately 0.69 acre
Interior
- Bedrooms: Primary bedroom (dimensions listed)
- Bathrooms: 2 full bathrooms
- Heating & cooling: Forced air heating; Cooling present
- Interior features: Fireplace; Full basement; Total of 2 rooms
Neighborhood map
What this means for you Summary
Snapshot
- This is a 2-bed/2.0-bath single-family listed at $95k.
Deal economics
- At list price, monthly cash flow is $473 ($6k/yr) — positive.
- The deal already cash-flows at list — no discount required.
- Meets the 1% rule at list price ($1k rent vs $95k).
- Recommended offer: $94k (1.5% below list) — sets the bar for market timing.
- Cap rate 12.3% vs local median 2.6% in Marshall — top-decile yield for the area; either an underpriced asset or a hidden risk that comps aren't pricing in. Stress-test before assuming the spread holds.
Location & tenants
- Location reads 72/100 on livability (#254 in MI) — a middle-class / working-renter tenant base. Strengths: cost of living A+, housing A+, crime B; Watch: schools C-, employment C-, amenities F.
- Marshall Public Schools (town): math 28% / reading 44% proficiency, ranked #268 of 540 in MI (top 50%) — families likely to look elsewhere, expect single-tenant / working-renter base with shorter leases.
- Market conditions: 153 active listings in the ZIP; 4 comparable units currently listed for rent nearby; rentals lingering (median 44d on market — plan ~5-8 weeks vacancy on turnover, expect pricing pressure); 100% of comp listings sitting > 30 days — soft ceiling on asking rent; 132 units permitted in Calhoun County in 2024 (0 in 5+ unit buildings).
Forward outlook
- Local home prices are declining (-3.0%/yr); year-one equity from $657 of loan paydown is wiped out by about $3k of value loss. Plan a longer hold.
- Calhoun County population projected at -16% by 2050 — secular population decline; favor cash flow + early exit over multi-decade hold.
- At projected returns (-3.0% appreciation + 3.0% rent growth), your $27k cash investment doubles in ~6 years — after that, you're playing with house money.
Negotiation context
- It's been on market 16 days — a 2% lower offer ($94k) is reasonable based on typical stale-listing flexibility.
- 11 sale attempts since 22y ago with the ask held roughly flat each time — persistent listings suggest the price (not the market) is what's stuck; bring a comps-based counter.
- Current owner paid $30k; list at $95k implies a 217% gain — meaningful room to come down on a strong offer.
Risks & watch-outs
- Watch-outs: built in 1915 — expect roof / HVAC / electrical / plumbing capex.
Questions for the listing agent
- Built in 1915 — when were the roof, HVAC, electrical panel, plumbing, and water heater last replaced?
- Is there a deadline driving the sale (1031 exchange, divorce, estate, relocation)? That informs how much negotiation room exists.
- What's the average days-on-market for RENTAL listings here right now (not sales)? A rising rental-DOM trend means longer vacancies and softer asking-rent achievability than the comps imply.
- What's the recent tenant-quality profile in this submarket — average credit score on applications, eviction rate, late-payment / NSF rate, and stable-employment percentage? A property-management company in the area should have these aggregated.
- How much new for-sale + rental construction is in the pipeline within 1–3 miles? Heavy new supply typically softens prices + rents 12–24 months out; constrained supply supports both.
Investment metrics
- 1% rule
- 1.54% ✓
- Cap rate
- 12.26%
- Cash-on-cash
- 21.32%
- DSCR
- 1.95
- GRM
- 5.4
CMA / ARV
- ARV (on-the-fly)
- $170,408
- Comps found
- 10
Show comp detail 10 sales within ~0.75 mi
| Address | Dist | Beds/Ba | Sqft | Sold | Price | $/sf | Match |
|---|---|---|---|---|---|---|---|
| 325 Mitchell St | 0.27mi | 3/2.0 (+1) | 1,225 (-2%) | 12mo | $181,000 | $148 | 68 |
| 738 W Green St | 0.14mi | 3/1.0 (+1) | 1,288 (+3%) | 14mo | $135,000 | $105 | 68 |
| 111 Greenfield Blvd | 0.28mi | 3/1.0 (+1) | 1,208 (-4%) | 12mo | $210,000 | $174 | 62 |
| 707 W Michigan Ave | 0.23mi | 3/1.5 (+1) | 1,178 (-6%) | 18mo | $152,000 | $129 | 57 |
| 317 S Kalamazoo Ave | 0.48mi | 3/1.0 (+1) | 1,209 (-4%) | 13mo | $175,000 | $145 | 52 |
| 313 S Eagle St | 0.62mi | 3/1.5 (+1) | 1,252 (-0%) | 18mo | $160,000 | $128 | 49 |
| 122 Hart St | 0.67mi | 3/1.0 (+1) | 1,248 (-0%) | 13mo | $70,000 | $56 | 48 |
| 124 W Spruce St | 0.67mi | 3/1.0 (+1) | 1,264 (+1%) | 14mo | $172,500 | $136 | 47 |
| 103 Hart St | 0.72mi | 3/2.5 (+1) | 1,344 (+7%) | 1mo | $278,476 | $207 | 47 |
| 612 W Mansion St | 0.36mi | 3/1.0 (+1) | 1,352 (+8%) | 20mo | $140,000 | $104 | 44 |
Match score weights: distance 35% · size 25% · config 20% · recency 20%. Top-matched comps best support the ARV.
Projected returns pro-forma
-3.0% appreciation · 3.0% rent growth · sell at horizon
- IRR
- 13.9%
- Equity multiple
- 1.55×
- Total profit
- $14,740
- Equity at exit
- $14,165
- IRR
- 22.7%
- Equity multiple
- 2.95×
- Total profit
- $51,740
- Equity at exit
- $8,214
Cash invested: $26,600 (down + closing). Projections, not guarantees.
Landlord ↔ Tenant lean methodology
- Overall (STATE)
- 62 Landlord-Friendly
- State Michigan
- 62 Landlord-Friendly · EVEN
- County
- — inherits STATE
- City
- — inherits STATE
ZIP-level market 49068
- Active inventory
- 153
- Price-to-rent
- 5.4×
Monthly cashflow live
- Estimated rent
- $1,461 medium interval (Pro) →
- Mortgage (P&I)
- −$498
- Tax from tax record
- −$144 /mo · $1,722/yr
- Insurance
- −$40
- HOA
- −$0
- Vacancy / Maint / Mgmt
- −$307
- Net cashflow
- $473
Break-even live
UW: 25.0% down · 7.5% · 30yr · 1.5% tax · 5.0% vac · 8.0% maint · 8.0% mgmt
Financing live
Cash to close
- Down payment
- $23,750
- Closing costs
- $2,850
- Reserves months
- —
- Total cash needed
- —
Loan-product check · same deal, 3 products live
Conventional
25% down · 7.5% · 30yr
- Down + closing
- —
- Monthly P&I
- —
- Monthly cashflow
- —
- DSCR
- —
- Eligible?
- —
Personal DTI + credit; lowest rate.
DSCR
20% down · 8.5% · 30yr
- Down + closing
- —
- Monthly P&I
- —
- Monthly cashflow
- —
- DSCR
- —
- Eligible?
- —
No personal income docs; deal must DSCR.
Hard money
10% down · 12.0% · 12mo
- Down + closing
- —
- Monthly P&I
- —
- Monthly cashflow
- —
- DSCR
- —
- Eligible?
- —
Short-term bridge; refi at stabilization.
Rent comps 4 comps
| Address | Beds | Baths | Sqft | Rent | $/sqft | DOM | Units | Dist |
|---|---|---|---|---|---|---|---|---|
| 1257 Arms St Marshall, MI | 2.0 | 1.5 | 1480 | $1,375 | $0.93 | 43d | 1 | 0.53mi |
| 312 Crary St Marshall, MI | 3.0 | 1.0–1.5 | 790 | $1,217 | $1.54 | 43d | 1 | 0.63mi |
| 201 West Dr N Marshall, MI | 1.0–2.0 | 1.0 | 800 | $1,300 | $1.62 | 43d | 1 | 0.70mi |
| 1045 Rebecca St Marshall, MI | 3.0 | 2.0 | 1216 | $2,000 | $1.64 | 43d | 1 | 0.99mi |
Listing history 13 events
-
2026-06-19days on market $95,000 Active 16 DOM
-
2026-06-18days on market $95,000 Active 15 DOM
-
2026-06-17days on market $95,000 Active 14 DOM
-
2026-06-16days on market $95,000 Active 13 DOM
-
2026-06-15days on market $95,000 Active 12 DOM
-
2026-06-14days on market $95,000 Active 10 DOM
-
2026-06-13days on market $95,000 Active 9 DOM
-
2026-06-10days on market $95,000 Active 7 DOM
-
2026-06-09days on market $95,000 Active 6 DOM
-
2026-06-08days on market $95,000 Active 5 DOM
-
2026-06-07days on market $95,000 Active 4 DOM
-
2026-06-03remarks 174-char remark
Show marketing remark (173 chars)
INVESTOR SPECIAL - AS-IS. 2BR/2BA, 1,902 sqft on the BIGGEST LOT IN THE AREA - huge upside! Full rehab needed, BUT major mechanicals are DONE: 2022 roof, HVAC, furnace, heat
-
2026-06-03$95,000 Active 1 DOM
Show marketing remark (173 chars)
INVESTOR SPECIAL - AS-IS. 2BR/2BA, 1,902 sqft on the BIGGEST LOT IN THE AREA - huge upside! Full rehab needed, BUT major mechanicals are DONE: 2022 roof, HVAC, furnace, heat
ⓘ Source: listings_history table (triggers on properties + properties_extension) + one-shot
backfill from property_details.listing_events for pre-trigger history.
Tax reassessment forecast MI · Partial reset (capped growth)
- Current annual tax
- $1,722 · $144/mo
- Projected year-2 tax
- $1,722 · $144/mo
- Expected delta
- $0/yr ($0/mo · -0.0%)
ⓘ Screening estimate from a state-policy table — verify with the county assessor before closing.
Climate risk First Street
- Flood 1/10 Low FEMA zone X (unshaded) · 0% chance over 30 yrs
- Wildfire 3/10 Moderate
- Heat 3/10 Moderate 7 d/yr ≥98°F today · 16 d/yr by 30 yrs out
- Wind 2/10 Low
- Air quality 2/10 Low 1 unhealthy d/yr today · 2 by 30 yrs out
Nearby sold comps map
Loading sold comps map…
Walkable amenities ~0.75 mi
Loading nearby amenities…
Taxation est. · year 1
- Rental income
- $17,526
- − Mortgage interest
- −$5,321
- − Property taxes
- −$1,722
- − Insurance
- −$475
- − Repairs & maintenance
- −$1,402
- − Management
- −$1,402
- − Depreciation
- −$2,764
- Taxable income
- $4,440
- Est. tax owed @ 24.0%
- −$1,066
- After-tax cash flow
- $4,605/yr
For passive investors: Depreciation is non-cash, so a rental often shows a tax loss while cash-flowing — sheltering income. Rental losses are passive: they offset passive income freely, and up to $25,000/yr can offset ordinary (W-2) income if you actively participate and your MAGI is under $100k (phasing out to $0 by $150k); unused losses carry forward. On sale, claimed depreciation is recaptured at up to 25%, and gains may owe capital-gains tax (a 1031 exchange can defer both). Figures are a year-1 estimate at your 24.0% rate — not tax advice; consult a CPA.
Schools (NCES district)
- District
- Marshall Public Schools
- NCES district ID
- 2622970
- Math proficiency
- 28% ▼ -4.00%
- Reading proficiency
- 44% ▼ -2.00%
- Median HH income
- $48,020
- Composite
- 30.93/100
- National rank
- #6112
- State rank
- #268 of 540 in MI
Livability — Marshall
- Score
- 72/100
- State rank
- #254
- US rank
- #6352
Category grades
Schools grade is shown separately in the Schools card above.
Census & demographics
- Census place
- Marshall, MI
- Population (ZIP)
- 14,954
Population outlook (Calhoun County) Hauer SSP2
- Today (2025)
- 130,157 people
- By 2030
- 126,691 · -2.7%
- By 2040
- 118,517 · -8.9%
- By 2050
- 109,855 · -15.6%
- By 2075
- 90,486 · -30.5%
- By 2100
- 70,766 · -45.6%
Race, ethnicity, and origin ACS 2023
- Neighborhood character
- Predominantly White (90%)
- Race & ethnicity
- White 90% Two or more races 5% Hispanic / Latino 4% Asian 2%
- Common ancestry
- Romanian 4% Iranian 3% Lithuanian 2%
- Foreign-born
- 2% · South Korea
- Languages at home
- 97% English-only · Spanish 1% Other Indo-European 1%
Political lean MEDSL · Calhoun
- 2024 margin
- R (+14.1) · D 42.3% · R 56.4% · Other 1.3%
- 2008→2024 swing
- -23.4pp toward R · 2008: 9.4pp · 2024: -14.1pp
- All cycles
- 2024: R+14.1 2020: R+11.1 2016: R+12.5 2012: D+1.6 2008: D+9.4
Not yet ingested
- Civics
- —
Market trends
- HPI YoY
- ▼ -108.10%
- Current HPI
- 192.69
- Rent YoY
- —
- Metro
- —
- State GDP YoY
- ▲ 1.37%
- F500 in state
- 28
Industry mix (Fortune 500 HQ in MI)
| Industry | F500 HQs | Revenue |
|---|---|---|
| Automotive Parts | 3 | $48B |
|
||
| Automotive | 2 | $372B |
|
||
| Chemicals | 1 | $45B |
|
||
| Automotive Retail | 1 | $29B |
|
||
| Healthcare / Medical Devices | 1 | $23B |
|
||
| Automotive Technology | 1 | $20B |
|
||
Price history
+5.7% since first listed20 events — show timeline
- 2026-06-03 Listed $95,000 REALCOMP
- 2026-06-03 Listed $95,000 MiRealSource-MiMLS
- 2026-06-03 Listed $95,000 SW Michigan MLS
- 2014-09-25 Listing Removed — SW Michigan MLS
- 2012-03-29 Sold (MLS) $30,000 REALCOMP
- 2012-03-29 Sold (MLS) $30,000 SW Michigan MLS
- 2012-02-14 Listed $28,900 REALCOMP
- 2012-02-14 Listed $28,900 SW Michigan MLS
- 2007-03-26 Sold (MLS) $51,500 REALCOMP
- 2007-03-26 Sold (MLS) $51,500 SW Michigan MLS
- 2007-03-05 Listed $52,900 REALCOMP
- 2007-03-05 Listed $52,900 SW Michigan MLS
- 2007-03-03 Listing Removed — REALCOMP
- 2007-01-03 Listed $54,900 REALCOMP
- 2007-01-03 Listed $54,900 SW Michigan MLS
- 2005-04-07 Sold (Public Records) $87,700 Public Records
- 2005-03-31 Sold (MLS) $87,700 REALCOMP
- 2005-03-31 Sold (MLS) $87,700 SW Michigan MLS
- 2004-10-04 Listed $89,900 REALCOMP
- 2004-10-04 Listed $89,900 SW Michigan MLS
Property tax history
-1.3%/yrLatest (2025): $1,722 · +225.8% YoY. Source: county tax records.
Cash-flow waterfall
monthlySold comps — $/sqft
last 12 mo · ≤1 miLoading sold comps…