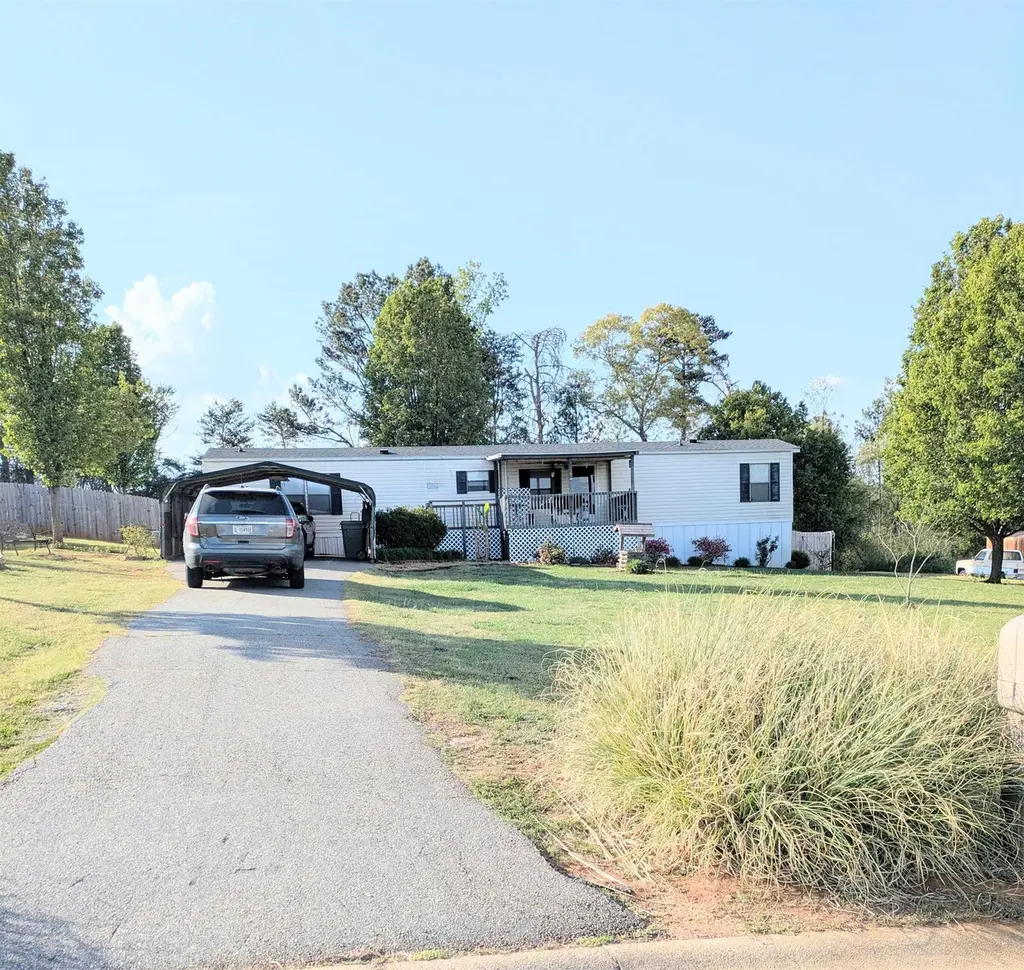
712 Ohenry Drive Dr · Campobello, SC
Flood risk 1/10 · Minimal
- FEMA flood zone
- X (unshaded)
- Chance of flooding over 30 yrs
- 0.0%
- Est. flood insurance / yr
- $507 – $1,088
Fire risk 5/10 · Moderate
- Est. fire insurance / yr
- $783 – $1,453
Heat risk 6/10 · Moderate
- Hot days now (above 104°F)
- 7 days/yr
- Hot days in 30 yrs
- 17 days/yr
Wind risk 2/10 · Minimal
- Chance of severe wind over 30 yrs
- 1.0%
Air-quality risk 4/10 · Minor
- Unhealthy air days now
- 4 days/yr
- Unhealthy air days in 30 yrs
- 5 days/yr
Risk factors via First Street. Map © Google.
Why this score? — see what drove the C+ grade
The composite is a weighted blend of 9 inputs, each scored 0–100. Each bar is that input's sub-score; the figure is the points it added to the 100-point composite (weight × sub-score).
- Cash flow +25.1/30.0
- DSCR +8.2/10.0
- ARV discount +7.5/15.0
- 1% rule +6.6/10.0
- Schools +4.1/10.0
- Livability +3.1/5.0
- Rent growth +2.9/5.0
- Condition / age +2.5/5.0
- Appreciation +0.0/10.0
$139,900
🖨 Deal sheet (PDF) 📄 Offer letter ✓ Due diligence
Listing remarks
Discover the perfect blend of affordability and outdoor freedom! This well-maintained 3 bedroom, 2 bathroom single-wide mobile home sits on a spacious half-acre lot. The highlight of this property is your very own outdoor retreat, featuring an above ground pool-perfect for cooling off on warm summer days or hosting weekend gatherings. The expansive yard provides endless possibilities for gardening, play or future expansions. The building to the right of the backyard will convey with property. Seller will de-title and get FHA Certificate with acceptable offer.
Key facts
- Expansive yard
- Above ground pool
- 0.58 acre lot
Tags
Property features AI
Exterior
- Parking: Has garage (2 spaces); Paved parking; Carport; Driveway
- Utilities: Public water; Septic tank
- Home design: Residential mobile home; Single wide; One story
- Construction: Vinyl siding; Composition roof
- Exterior features: Deck; Fenced yard; Above-ground pool; Outbuilding; Wooded lot
Interior
- Kitchen: Free-standing range; Refrigerator; Electric water heater
- Flooring: Carpet; Laminate; Vinyl
- Bathrooms: 2 full bathrooms
- Heating & cooling: Heat pump; Electric cooling; Electric heating; Forced air heating
- Interior features: Electric water heater; Free-standing range; Refrigerator; Washer; Deck; Fenced yard; Outbuilding
- Laundry & utility: Washer; Electric dryer hookup; Washer hookup
Neighborhood map
What this means for you Summary
Snapshot
- This is a 3-bed/2.0-bath land listed at $140k.
Deal economics
- At list price, monthly cash flow is $311 ($4k/yr) — positive.
- The deal already cash-flows at list — no discount required.
- Meets the 1% rule at list price ($2k rent vs $140k).
- Recommended offer: $136k (3.0% below list) — sets the bar for market timing.
- Cap rate 9.0% vs local median 3.0% in Campobello — top-decile yield for the area; either an underpriced asset or a hidden risk that comps aren't pricing in. Stress-test before assuming the spread holds.
Location & tenants
- Location reads 62/100 on livability (#191 in SC) — a middle-class / working-renter tenant base. Strengths: cost of living A+, housing A+, employment B+; Watch: crime D, amenities F, commute F.
- Spartanburg 01 (rural): math 44% / reading 53% proficiency, ranked #14 of 80 in SC (top 18%) — families likely to look elsewhere, expect single-tenant / working-renter base with shorter leases.
- Zoned schools: Inman Elementary (math 57% / reading 47%, grade C-, #145 of 597 statewide, top 26%, 615 students, 100% FRL); Chapman High (math 42% / reading 88%, grade B, #85 of 196 statewide, top 45%, 1,046 students, 59% FRL) — zoned schools average 80% FRL vs 45% district-wide (35 pts higher); higher-poverty schools than district average — tighter screening recommended.
- Market conditions: Rents rising (+1.8%/yr); 693 active listings in the ZIP; solid renter incomes; 3,129 units permitted in Spartanburg County in 2024 (40 in 5+ unit buildings).
Forward outlook
- Local home prices are declining (-3.0%/yr); year-one equity from $967 of loan paydown is wiped out by about $4k of value loss. Plan a longer hold.
- Spartanburg County population projected at +18% by 2050 — long-run rental-demand tailwind backs the buy-and-hold thesis.
Negotiation context
- It's been on market 40 days — a 3% lower offer ($136k) is reasonable based on typical stale-listing flexibility.
- Current owner paid $18k; list at $140k implies a 682% gain — meaningful room to come down on a strong offer.
Risks & watch-outs
- Climate carrying-cost: moderate wildfire risk; extreme-heat days projected 7→17/yr by 2055 (HVAC capex compounding) — expect insurance premiums to compound above CPI over the hold.
Questions for the listing agent
- It's been on market 40 days. Have you received any prior offers? Is the seller open to a 3% concession, seller financing, or rate buy-down credit?
- Is there a deadline driving the sale (1031 exchange, divorce, estate, relocation)? That informs how much negotiation room exists.
- Crime grade is D in this area — have there been break-ins, vandalism, or insurance claims at this property in the last 3 years? What carrier currently insures it and at what premium?
- What's the average days-on-market for RENTAL listings here right now (not sales)? A rising rental-DOM trend means longer vacancies and softer asking-rent achievability than the comps imply.
- What's the recent tenant-quality profile in this submarket — average credit score on applications, eviction rate, late-payment / NSF rate, and stable-employment percentage? A property-management company in the area should have these aggregated.
- How much new for-sale + rental construction is in the pipeline within 1–3 miles? Heavy new supply typically softens prices + rents 12–24 months out; constrained supply supports both.
Investment metrics
- 1% rule
- 1.16% ✓
- Cap rate
- 8.96%
- Cash-on-cash
- 9.52%
- DSCR
- 1.42
- GRM
- 7.2
CMA / ARV
No comps found within radius.
Projected returns pro-forma
-3.0% appreciation · 1.79% rent growth · sell at horizon
- IRR
- -3.3%
- Equity multiple
- 0.88×
- Total profit
- $-4,796
- Equity at exit
- $20,860
- IRR
- 5.0%
- Equity multiple
- 1.35×
- Total profit
- $13,621
- Equity at exit
- $12,096
Cash invested: $39,172 (down + closing). Projections, not guarantees.
Landlord ↔ Tenant lean methodology
- Overall (STATE)
- 90 Strongly Landlord-Friendly
- State South Carolina
- 90 Strongly Landlord-Friendly · R+6
- County
- — inherits STATE
- City
- — inherits STATE
ZIP-level market 29349
- Home prices YoY
- -31.8%
- Rents YoY
- 1.8%
- Active inventory
- 693
- Price-to-rent
- 7.2×
Monthly cashflow live
- Estimated rent
- $1,617 medium interval (Pro) →
- Mortgage (P&I)
- −$734
- Tax est. 1.5%
- −$175 /mo · $2,098/yr
- Insurance
- −$58
- HOA
- −$0
- Vacancy / Maint / Mgmt
- −$340
- Net cashflow
- $311
Break-even live
Sensitivity live
| Price | -10% $407 | -5% $359 | +0% $311 | +5% $262 | +10% $214 |
|---|---|---|---|---|---|
| Rent | -10% $183 | -5% $247 | +0% $311 | +5% $375 | +10% $439 |
| Rate | -1.0pp $381 | -0.5pp $346 | base $311 | +0.5pp $275 | +1.0pp $238 |
UW: 25.0% down · 7.5% · 30yr · 1.5% tax · 5.0% vac · 8.0% maint · 8.0% mgmt
Financing live
Cash to close
- Down payment
- $34,975
- Closing costs
- $4,197
- Reserves months
- —
- Total cash needed
- —
Loan-product check · same deal, 3 products live
Conventional
25% down · 7.5% · 30yr
- Down + closing
- —
- Monthly P&I
- —
- Monthly cashflow
- —
- DSCR
- —
- Eligible?
- —
Personal DTI + credit; lowest rate.
DSCR
20% down · 8.5% · 30yr
- Down + closing
- —
- Monthly P&I
- —
- Monthly cashflow
- —
- DSCR
- —
- Eligible?
- —
No personal income docs; deal must DSCR.
Hard money
10% down · 12.0% · 12mo
- Down + closing
- —
- Monthly P&I
- —
- Monthly cashflow
- —
- DSCR
- —
- Eligible?
- —
Short-term bridge; refi at stabilization.
Listing history 5 events
-
2026-05-19status Pending
-
2026-05-12price $139,900
-
2026-04-24price $147,500
-
2026-04-09$160,000 Active
-
1998-05-01soldstatus $17,900
ⓘ Source: listings_history table (triggers on properties + properties_extension) + one-shot
backfill from property_details.listing_events for pre-trigger history.
Climate risk First Street
- Flood 1/10 Low FEMA zone X (unshaded) · 0% chance over 30 yrs
- Wildfire 5/10 Major
- Heat 6/10 Major 7 d/yr ≥104°F today · 17 d/yr by 30 yrs out
- Wind 2/10 Low 100% chance of damaging wind over 30 yrs
- Air quality 4/10 Moderate 4 unhealthy d/yr today · 5 by 30 yrs out
Nearby sold comps map
Loading sold comps map…
Walkable amenities ~0.75 mi
Loading nearby amenities…
Taxation est. · year 1
- Rental income
- $19,407
- − Mortgage interest
- −$7,837
- − Property taxes
- −$2,098
- − Insurance
- −$700
- − Repairs & maintenance
- −$1,553
- − Management
- −$1,553
- − Depreciation
- −$4,070
- Taxable income
- $1,597
- Est. tax owed @ 24.0%
- −$383
- After-tax cash flow
- $3,346/yr
For passive investors: Depreciation is non-cash, so a rental often shows a tax loss while cash-flowing — sheltering income. Rental losses are passive: they offset passive income freely, and up to $25,000/yr can offset ordinary (W-2) income if you actively participate and your MAGI is under $100k (phasing out to $0 by $150k); unused losses carry forward. On sale, claimed depreciation is recaptured at up to 25%, and gains may owe capital-gains tax (a 1031 exchange can defer both). Figures are a year-1 estimate at your 24.0% rate — not tax advice; consult a CPA.
Schools (NCES district)
- District
- Spartanburg 01
- NCES district ID
- 4503480
- Math proficiency
- 44% ▼ -11.00%
- Reading proficiency
- 53% ▼ -1.00%
- Median HH income
- $44,612
- Composite
- 41.0/100
- National rank
- #3590
- State rank
- #14 of 80 in SC
Livability — Campobello
- Score
- 62/100
- State rank
- #191
- US rank
- #16537
Category grades
Schools grade is shown separately in the Schools card above.
Census & demographics
- County
- Spartanburg County · 258,607 people
- Metro
- Spartanburg, SC
- Population (ZIP)
- 39,083
- Household income
- $76,168
- Rent vs Own
- Severe rent burden
- 271.0
Population outlook (Spartanburg County) Hauer SSP2
- Today (2025)
- 325,495 people
- By 2030
- 338,800 · +4.1%
- By 2040
- 363,471 · +11.7%
- By 2050
- 384,156 · +18.0%
- By 2075
- 430,137 · +32.1%
- By 2100
- 442,733 · +36.0%
Race, ethnicity, and origin ACS 2023
- Neighborhood character
- Predominantly White (80%)
- Race & ethnicity
- White 80% Black 9% Hispanic / Latino 6% Two or more races 4% Asian 2%
- Hispanic origin (detail)
- Mexican 5%
- Common ancestry
- Subsaharan African 6% Serbian 3% Scotch-Irish 3%
- Foreign-born
- 9% · Canada
- Languages at home
- 86% English-only · Russian/Polish/Slavic 7% Spanish 3% Other Asian/Pacific 2%
Political lean MEDSL · Spartanburg
- 2024 margin
- Solid R (+33.6) · D 32.6% · R 66.2% · Other 1.2%
- 2008→2024 swing
- -12.0pp toward R · 2008: -21.6pp · 2024: -33.6pp
- All cycles
- 2024: R+33.6 2020: R+27.3 2016: R+30.0 2012: R+23.1 2008: R+21.6
Not yet ingested
- Civics
- —
Market trends
- HPI YoY
- ▼ -113.67%
- Current HPI
- 244.0359
- Rent YoY
- ▲ 1.79%
- Metro
- Spartanburg, SC
- State GDP YoY
- ▲ 4.51%
- F500 in state
- 2
Industry mix (Fortune 500 HQ in SC)
| Industry | F500 HQs | Revenue |
|---|---|---|
| Packaging | 1 | $7B |
|
||
Price history
+681.6% since first listed5 events — show timeline
- 2026-05-19 Pending — SPMLS
- 2026-05-12 Price Changed $139,900 SPMLS
- 2026-04-24 Price Changed $147,500 SPMLS
- 2026-04-09 Listed $160,000 SPMLS
- 1998-05-01 Sold (Public Records) $17,900 Public Records
Property tax history
-10.0%/yrLatest (2025): $98 · +1.1% YoY. Source: county tax records.
Cash-flow waterfall
monthlySold comps — $/sqft
last 12 mo · ≤1 miLoading sold comps…