 Multi-family
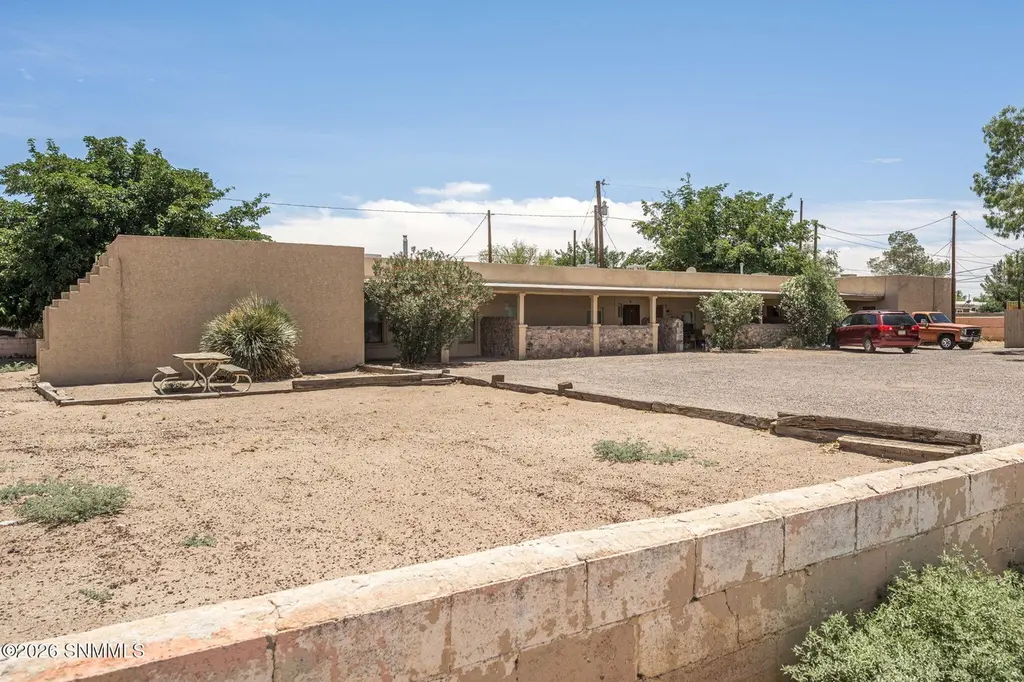
809 W Van Patten Ave · Las Cruces, NM
Flood risk 3/10 · Minor
- FEMA flood zone
- X (unshaded)
- Chance of flooding over 30 yrs
- 0.2%
- Est. flood insurance / yr
- $507 – $1,088
Fire risk 3/10 · Minor
- Est. fire insurance / yr
- $706 – $1,312
Heat risk 6/10 · Moderate
- Hot days now (above 100°F)
- 7 days/yr
- Hot days in 30 yrs
- 25 days/yr
Wind risk 1/10 · Minimal
- Chance of severe wind over 30 yrs
- —
Air-quality risk 1/10 · Minimal
- Unhealthy air days now
- 0 days/yr
- Unhealthy air days in 30 yrs
- 0 days/yr
Risk factors via First Street. Map © Google.
Why this score? — see what drove the F grade
The composite is a weighted blend of 9 inputs, each scored 0–100. Each bar is that input's sub-score; the figure is the points it added to the 100-point composite (weight × sub-score).
- Cash flow +8.3/30.0
- ARV discount +7.5/15.0
- Schools +4.6/10.0
- Livability +3.0/5.0
- Condition / age +2.5/5.0
- DSCR +2.3/10.0
- Rent growth +2.3/5.0
- 1% rule +2.0/10.0
- Appreciation +0.0/10.0
$315,000
🖨 Deal sheet (PDF) 📄 Offer letter ✓ Due diligence
Multi-family units
County records classify this as Multi-Family (2-4 Unit). Listing-text estimate: 1 unit. estimate disagrees with records
Listing remarks
Eight-unit multifamily investment opportunity with a diverse unit mix and value-add potential. The property consists of six apartment units located at the rear of the site, including five currently leased units and one recently renovated unit that is available for rent. At the front of the property, a detached single-family home and studio provide additional income-producing flexibility. The rear apartment units each offer approximately 600 square feet of living space with 2 bd/ 1 bath corner units and 1 bd/ 1 bath interior units. Ample on-site parking is available for tenants, and the property includes additional outdoor space that could be enhanced to improve tenant enjoyment and overall
Key facts
- Diverse unit mix
- Value-add potential
- 0.57 acre lot
Tags
Property features AI
Exterior
- Parking: Paved parking with 10 spaces
- Utilities: Public water; Public sewer
- Home design: Residential income property (multi-family apartment complex)
- Construction: Adobe, stucco, and block construction; Slab foundation; Flat roof; Built as a multi-family apartment complex
- Exterior features: Patio; Block fencing
Interior
- Kitchen: Range, Refrigerator
- Heating & cooling: Evaporative cooling; Wall furnace heating
- Interior features: Range, Refrigerator, Water Heater
- Laundry & utility: Water Heater
Neighborhood map
What this means for you Summary
Snapshot
- This is a 5-bed/3.0-bath multifamily listed at $315k.
Deal economics
- At list price, monthly cash flow is $-286 ($-3k/yr) — negative.
- To cash-flow at today's rent, offer at most $264k (16.0% below list).
- To meet the 1% rule (rent ≥ 1% of price), the offer needs to be $220k (30.0% below list).
- Recommended offer: $220k (30.0% below list) — sets the bar for 1% rule.
Location & tenants
- Location reads 59/100 on livability (#120 in NM) — a working-class tenant base; expect higher turnover. Strengths: cost of living A+, housing A; Watch: amenities D+, schools D-, crime F.
- Las Cruces Public Schools (urban): math 42% / reading 68% proficiency, ranked #5 of 29 in NM (top 17%) — acceptable for families but not a draw, mixed tenant base, ~2y average lease; 62% free/reduced lunch — lower-income household profile, screen leases tightly.
- Market conditions: Rents soft (-0.9%/yr); 178 active listings in the ZIP; 1 comparable units currently listed for rent nearby; 964 units permitted in Doña Ana County in 2024 (0 in 5+ unit buildings).
- At $2,204/mo this rent would consume 49% of the median local household income ($54k/yr) (locally 1248% of renters already pay >50% of income on rent) — very limited rent-growth headroom before tenants either downsize or default.
Forward outlook
- Local home prices are declining (-3.0%/yr); year-one equity from $2k of loan paydown is wiped out by about $9k of value loss. Plan a longer hold.
Negotiation context
- Only 9 days on market — expect competitive offers; lowballing is unlikely to land.
Risks & watch-outs
- Watch-outs: built in 1940 — expect roof / HVAC / electrical / plumbing capex.
- Climate carrying-cost: extreme-heat days projected 7→25/yr by 2055 (HVAC capex compounding) — expect insurance premiums to compound above CPI over the hold.
Questions for the listing agent
- What do current leases actually rent for vs. the listed asking? Can we see a recent rent roll and the last 12 months of T-12 income?
- Built in 1940 — when were the roof, HVAC, electrical panel, plumbing, and water heater last replaced?
- Is there a deadline driving the sale (1031 exchange, divorce, estate, relocation)? That informs how much negotiation room exists.
- Schools are D-rated, which usually means shorter tenancies and higher turnover. Who's the typical renter profile here, and what's been the actual vacancy rate?
- Crime grade is F in this area — have there been break-ins, vandalism, or insurance claims at this property in the last 3 years? What carrier currently insures it and at what premium?
- The area grade is low — what's the realistic commute time and amenity access for the typical tenant pool here? Any planned neighborhood developments (good or bad) we should know about?
- What's the average days-on-market for RENTAL listings here right now (not sales)? A rising rental-DOM trend means longer vacancies and softer asking-rent achievability than the comps imply.
- What's the recent tenant-quality profile in this submarket — average credit score on applications, eviction rate, late-payment / NSF rate, and stable-employment percentage? A property-management company in the area should have these aggregated.
- How much new apartment / multifamily construction is in the pipeline within 1–3 miles? Heavy new supply (>2% of stock underway) typically softens rents 12–24 months out; light construction supports rent growth.
Investment metrics
- 1% rule
- 0.70% ✗
- Cap rate
- 5.20%
- Cash-on-cash
- -3.89%
- DSCR
- 0.83
- GRM
- 11.9
CMA / ARV
No comps found within radius.
Projected returns pro-forma
-3.0% appreciation · 0.0% rent growth · sell at horizon
- IRR
- -26.0%
- Equity multiple
- 0.14×
- Total profit
- $-75,788
- Equity at exit
- $46,968
- IRR
- -35.2%
- Equity multiple
- -0.30×
- Total profit
- $-114,664
- Equity at exit
- $27,235
Cash invested: $88,200 (down + closing). Projections, not guarantees.
Landlord ↔ Tenant lean methodology
- Overall (STATE)
- 55 Moderately Landlord-Leaning
- State New Mexico
- 55 Moderately Landlord-Leaning · D+3
- County
- — inherits STATE
- City
- — inherits STATE
ZIP-level market 88005
- Rents YoY
- -0.9%
- Active inventory
- 178
- Price-to-rent
- 22.8×
Monthly cashflow live
- Estimated rent
- $2,204 high interval (Pro) →
- Mortgage (P&I)
- −$1,652
- Tax from tax record
- −$244 /mo · $2,930/yr
- Insurance
- −$131
- HOA
- −$0
- Vacancy / Maint / Mgmt
- −$463
- Net cashflow
- $-286
Break-even live
Sensitivity live
| Price | -10% $-108 | -5% $-197 | +0% $-286 | +5% $-375 | +10% $-464 |
|---|---|---|---|---|---|
| Rent | -10% $-460 | -5% $-373 | +0% $-286 | +5% $-199 | +10% $-112 |
| Rate | -1.0pp $-128 | -0.5pp $-206 | base $-286 | +0.5pp $-368 | +1.0pp $-451 |
2-unit breakdown (identical units grouped — click to expand)
| Units | Beds | Baths | Est. rent |
|---|---|---|---|
| 1× unit | 2 | 1 | $1,151 |
| 1× unit | 1 | 1 | $1,053 |
| Total (2 units) | $2,204 | ||
UW: 25.0% down · 7.5% · 30yr · 1.5% tax · 5.0% vac · 8.0% maint · 8.0% mgmt
Financing live
Cash to close
- Down payment
- $78,750
- Closing costs
- $9,450
- Reserves months
- —
- Total cash needed
- —
Loan-product check · same deal, 3 products live
Conventional
25% down · 7.5% · 30yr
- Down + closing
- —
- Monthly P&I
- —
- Monthly cashflow
- —
- DSCR
- —
- Eligible?
- —
Personal DTI + credit; lowest rate.
DSCR
20% down · 8.5% · 30yr
- Down + closing
- —
- Monthly P&I
- —
- Monthly cashflow
- —
- DSCR
- —
- Eligible?
- —
No personal income docs; deal must DSCR.
Hard money
10% down · 12.0% · 12mo
- Down + closing
- —
- Monthly P&I
- —
- Monthly cashflow
- —
- DSCR
- —
- Eligible?
- —
Short-term bridge; refi at stabilization.
Rent comps 1 comps
| Address | Beds | Baths | Sqft | Rent | $/sqft | DOM | Units | Dist |
|---|---|---|---|---|---|---|---|---|
| 2074 Briarwood Ln Las Cruces, NM | 4.0 | 2.0 | 1581 | $1,700 | $1.08 | 44d | 1 | 1.24mi |
Listing history 8 events
-
2026-06-18days on market $315,000 Active 9 DOM
-
2026-06-17days on market $315,000 Active 8 DOM
-
2026-06-16days on market $315,000 Active 7 DOM
-
2026-06-15days on market $315,000 Active 6 DOM
-
2026-06-14days on market $315,000 Active 4 DOM
-
2026-06-13days on market $315,000 Active 3 DOM
-
2026-06-09remarks 699-char remark
-
2026-06-09$315,000 Active 1 DOM
ⓘ Source: listings_history table (triggers on properties + properties_extension) + one-shot
backfill from property_details.listing_events for pre-trigger history.
Tax reassessment forecast NM · Resets to sale price
- Current annual tax
- $2,930 · $244/mo
- Projected year-2 tax
- $2,930 · $244/mo
- Expected delta
- $0/yr ($0/mo · 0.0%)
ⓘ Screening estimate from a state-policy table — verify with the county assessor before closing.
Climate risk First Street
- Flood 3/10 Moderate FEMA zone X (unshaded) · 20% chance over 30 yrs
- Wildfire 3/10 Moderate
- Heat 6/10 Major 7 d/yr ≥100°F today · 25 d/yr by 30 yrs out
- Wind 1/10 Low
- Air quality 1/10 Low 0 unhealthy d/yr today · 0 by 30 yrs out
Nearby sold comps map
Loading sold comps map…
Walkable amenities ~0.75 mi
Loading nearby amenities…
Taxation est. · year 1
- Rental income
- $26,448
- − Mortgage interest
- −$17,645
- − Property taxes
- −$2,930
- − Insurance
- −$1,575
- − Repairs & maintenance
- −$2,116
- − Management
- −$2,116
- − Depreciation
- −$9,164
- Taxable loss
- −$9,097
- Est. tax savings @ 24.0%
- +$2,183
- After-tax cash flow
- $-1,251/yr
For passive investors: Depreciation is non-cash, so a rental often shows a tax loss while cash-flowing — sheltering income. Rental losses are passive: they offset passive income freely, and up to $25,000/yr can offset ordinary (W-2) income if you actively participate and your MAGI is under $100k (phasing out to $0 by $150k); unused losses carry forward. On sale, claimed depreciation is recaptured at up to 25%, and gains may owe capital-gains tax (a 1031 exchange can defer both). Figures are a year-1 estimate at your 24.0% rate — not tax advice; consult a CPA.
Schools (NCES district)
- District
- Las Cruces Public Schools
- NCES district ID
- 3501500
- Math proficiency
- 42% ▲ 24.00%
- Reading proficiency
- 68% ▲ 35.00%
- Median HH income
- $41,157
- Composite
- 45.98/100
- National rank
- #2535
- State rank
- #5 of 29 in NM
Livability — Las Cruces
- Score
- 59/100
- State rank
- #120
- US rank
- #19687
Category grades
Schools grade is shown separately in the Schools card above.
Census & demographics
- Census place
- Las Cruces, NM
- County
- Dona Ana County · 144,044 people
- City population
- 131,421
- Metro
- Las Cruces, NM
- Population (ZIP)
- 27,509
- Household income
- $54,452
- Rent vs Own
- Severe rent burden
- 1248.0
Population outlook (Doña Ana County) Hauer SSP2
- Today (2025)
- 219,177 people
- By 2030
- 220,967 · +0.8%
- By 2040
- 222,775 · +1.6%
- By 2050
- 223,576 · +2.0%
- By 2075
- 228,461 · +4.2%
- By 2100
- 214,536 · -2.1%
Race, ethnicity, and origin ACS 2023
- Neighborhood character
- Majority Hispanic (58%)
- Race & ethnicity
- Hispanic / Latino 58% White 35% Two or more races 28% Black 2% Native American 1%
- Hispanic origin (detail)
- Mexican 48%
- Common ancestry
- Italian 2% Lithuanian 1% Slovak 1%
- Foreign-born
- 9% · Canada
- Languages at home
- 68% English-only · Spanish 30%
Political lean MEDSL · Doña Ana
- 2024 margin
- Lean D (+9.8) · D 53.8% · R 44.0% · Other 2.2%
- 2008→2024 swing
- -7.9pp toward R · 2008: 17.6pp · 2024: 9.8pp
- All cycles
- 2024: D+9.8 2020: D+18.3 2016: D+18.0 2012: D+14.9 2008: D+17.6
Not yet ingested
- Civics
- —
Market trends
- HPI YoY
- ▼ -186.66%
- Current HPI
- 188.4624
- Rent YoY
- ▼ -0.88%
- Metro
- Las Cruces, NM
- State GDP YoY
- —
- F500 in state
- 0
Price history
3 events — show timeline
- 2026-06-08 Listed $315,000 SNMMLS as distributed by MLS GRID
- 2007-07-17 Sold (Public Records) — Public Records
- 2005-09-23 Sold (Public Records) — Public Records
Property tax history
+3.0%/yrLatest (2025): $2,930 · +2.4% YoY. Source: county tax records.
Cash-flow waterfall
monthlySold comps — $/sqft
last 12 mo · ≤1 miLoading sold comps…