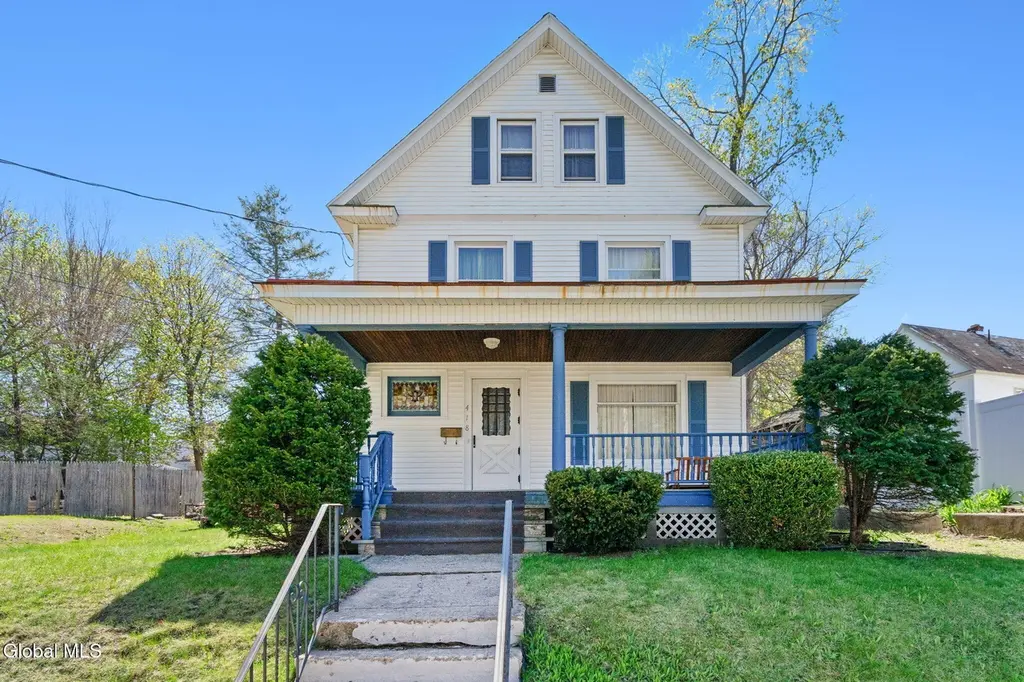
418 Plymouth Ave · Schenectady, NY
Flood risk 1/10 · Minimal
- FEMA flood zone
- X (unshaded)
- Chance of flooding over 30 yrs
- 0.0%
- Est. flood insurance / yr
- $473 – $860
Fire risk 1/10 · Minimal
- Est. fire insurance / yr
- $691 – $1,283
Heat risk 4/10 · Minor
- Hot days now (above 95°F)
- 7 days/yr
- Hot days in 30 yrs
- 16 days/yr
Wind risk 3/10 · Minor
- Chance of severe wind over 30 yrs
- 4.0%
Air-quality risk 1/10 · Minimal
- Unhealthy air days now
- 0 days/yr
- Unhealthy air days in 30 yrs
- 0 days/yr
Risk factors via First Street. Map © Google.
Why this score? — see what drove the C grade
The composite is a weighted blend of 9 inputs, each scored 0–100. Each bar is that input's sub-score; the figure is the points it added to the 100-point composite (weight × sub-score).
- Cash flow +17.6/30.0
- ARV discount +14.2/15.0
- DSCR +5.5/10.0
- 1% rule +4.7/10.0
- Livability +3.9/5.0
- Condition / age +3.8/5.0
- Schools +3.0/10.0
- Rent growth +2.5/5.0
- Appreciation +0.0/10.0
$225,000
🖨 Deal sheet (PDF) 📄 Offer letter ✓ Due diligence
Listing remarks
* * * Multiple offers have been received. The owners are asking for best and final by Tuesday, May 5th, at 3:00 pm * * * . Welcome home to this move-in ready colonial that perfectly blends turn-of-the-century character with modern convenience. Step inside to discover timeless craftsmanship featuring gorgeous hardwood floors that flow seamlessly throughout most of the first and second floors. The spacious layout includes a classic eat-in kitchen perfect for morning coffee, a bright and expansive living room that is filled with natural light as well as a formal dining room with elegant built-in cabinetry that adds both storage and historic soul to this home. Upstairs offers 4 well appoint
Key facts
- Built-in cabinetry
- Formal dining room
- Living room
Tags
Property features AI
Exterior
- Parking: Two off-street parking spaces via driveway
- Utilities: Public water; Public sewer; Cable available
- Home design: Single family residence; Vinyl siding construction
- Construction: Block foundation; Asphalt roof
- Exterior features: Composite deck; Paved driveway; Exterior lighting; Wood fencing; Rolling slope lot with cleared areas
Interior
- Kitchen: Dishwasher; Disposal; Electric oven; Microwave; Oven; Refrigerator
- Bedrooms: Four bedrooms on the second level
- Flooring: Tile; Vinyl; Wood
- Bathrooms: One full bathroom on the second level; One half bathroom on the first level
- Heating & cooling: Hot water heating
- Interior features: Paddle fans; Built-in features; Chair rail; Wood and aluminum framed windows with blinds
- Laundry & utility: Washer hookup; Electric dryer hookup; Laundry located in the basement
Neighborhood map
What this means for you Summary
Snapshot
- This is a 4-bed/1.5-bath single-family listed at $225k. Condition is rated good.
Deal economics
- At list price, monthly cash flow is $176 ($2k/yr) — positive.
- The deal already cash-flows at list — no discount required.
- To meet the 1% rule (rent ≥ 1% of price), the offer needs to be $219k (2.6% below list).
- Recommended offer: $219k (2.6% below list) — sets the bar for 1% rule.
Location & tenants
- Location reads 78/100 on livability (#167 in NY, #2,597 nationally) — a middle-class / working-renter tenant base. Strengths: commute A+, health & safety A+, cost of living A; Watch: employment D+, crime F.
- Schenectady City School District (urban): math 38% / reading 34% proficiency, ranked #556 of 590 in NY (top 94%) — families likely to look elsewhere, expect single-tenant / working-renter base with shorter leases; 65% free/reduced lunch — lower-income household profile, screen leases tightly.
- Zoned schools: Howe Elementary School (math 44% / reading 54%, grade D, #1,085 of 2,108 statewide, top 56%, 363 students, 69% FRL); Mont Pleasant Middle School (math 2% / reading 27%, grade F, #704 of 729 statewide, top 98%, 671 students, 81% FRL); Schenectady High School (math 75% / reading 90%, grade A, #446 of 1,100 statewide, top 41%, 2,743 students, 71% FRL).
- Zoned-school proficiency averages 49% at this address vs 36% district-wide (+13 pts) — the actual schools serving this property are materially stronger than the Schenectady City School District average implies; a family-tenant draw the district grade alone would hide.
- Market conditions: 79 active listings in the ZIP; 9 comparable units currently listed for rent nearby; rentals lingering (median 45d on market — plan ~5-8 weeks vacancy on turnover, expect pricing pressure); 56% of comp listings sitting > 30 days — soft ceiling on asking rent; 154 units permitted in Schenectady County in 2024 (54 in 5+ unit buildings).
- This rent runs 41% of the median local income ($63k/yr) — at the standard rent-burdened threshold; future hikes will face affordability resistance.
Forward outlook
- Local home prices are declining (-3.0%/yr); year-one equity from $2k of loan paydown is wiped out by about $7k of value loss. Plan a longer hold.
- Schenectady County population projected to shrink 4% by 2050 — rents likely to lag national; underwrite the cash flow, not the appreciation.
Negotiation context
- Only 6 days on market — expect competitive offers; lowballing is unlikely to land.
Risks & watch-outs
- Watch-outs: built in 1900 — expect roof / HVAC / electrical / plumbing capex.
Questions for the listing agent
- Built in 1900 — when were the roof, HVAC, electrical panel, plumbing, and water heater last replaced?
- Is there a deadline driving the sale (1031 exchange, divorce, estate, relocation)? That informs how much negotiation room exists.
- Crime grade is F in this area — have there been break-ins, vandalism, or insurance claims at this property in the last 3 years? What carrier currently insures it and at what premium?
- What's the average days-on-market for RENTAL listings here right now (not sales)? A rising rental-DOM trend means longer vacancies and softer asking-rent achievability than the comps imply.
- What's the recent tenant-quality profile in this submarket — average credit score on applications, eviction rate, late-payment / NSF rate, and stable-employment percentage? A property-management company in the area should have these aggregated.
- How much new for-sale + rental construction is in the pipeline within 1–3 miles? Heavy new supply typically softens prices + rents 12–24 months out; constrained supply supports both.
Investment metrics
- 1% rule
- 0.97% ✗
- Cap rate
- 7.23%
- Cash-on-cash
- 3.35%
- DSCR
- 1.15
- GRM
- 8.6
CMA / ARV
- ARV (median comp)
- $264,535
- List price
- $225,000
- Delta
- -14.95%
- Verdict
- UNDERPRICED
- Comps
- 20 within 1.0 mi
Show comp detail 12 sales within ~0.75 mi
| Address | Dist | Beds/Ba | Sqft | Sold | Price | $/sf | Match |
|---|---|---|---|---|---|---|---|
| 32 Eagle St | 0.42mi | 4/1.5 | 1,683 (+8%) | 3mo | $265,000 | $157 | 65 |
| 1522 Union St | 0.50mi | 4/1.5 | 1,701 (+9%) | 2mo | $325,000 | $191 | 60 |
| 91 Snowden Ave | 0.69mi | 4/1.0 | 1,488 (-5%) | 2mo | $170,000 | $114 | 56 |
| 828 Decamp Ave | 0.53mi | 3/1.5 (-1) | 1,724 (+10%) | 2mo | $371,100 | $215 | 51 |
| 122 Haigh Ave | 0.60mi | 4/1.5 | 1,748 (+12%) | 2mo | $247,000 | $141 | 51 |
| 1023 Lexington Ave | 0.68mi | 3/1.5 (-1) | 1,442 (-8%) | 1mo | $250,000 | $173 | 49 |
| 2 Bigelow Ave | 0.69mi | 3/1.5 (-1) | 1,450 (-7%) | 2mo | $298,000 | $206 | 49 |
| 1028 Maryland Ave | 0.46mi | 3/1.5 (-1) | 1,790 (+14%) | 1mo | $260,000 | $145 | 49 |
| 846 Wright Ave | 0.60mi | 3/2.0 (-1) | 1,754 (+12%) | 0mo | $427,000 | $243 | 45 |
| 1064 Lexington Ave | 0.74mi | 5/2.0 (+1) | 1,707 (+9%) | 1mo | $300,000 | $176 | 42 |
| 1152 Van Curler Ave | 0.64mi | 3/1.5 (-1) | 1,364 (-13%) | 2mo | $265,000 | $194 | 42 |
| 82 Haigh Ave | 0.63mi | 3/1.5 (-1) | 1,364 (-13%) | 4mo | $209,000 | $153 | 42 |
Match score weights: distance 35% · size 25% · config 20% · recency 20%. Top-matched comps best support the ARV.
Projected returns pro-forma
-3.0% appreciation · 3.0% rent growth · sell at horizon
- IRR
- -11.0%
- Equity multiple
- 0.60×
- Total profit
- $-25,226
- Equity at exit
- $33,548
- IRR
- -1.7%
- Equity multiple
- 0.88×
- Total profit
- $-7,409
- Equity at exit
- $19,454
Cash invested: $63,000 (down + closing). Projections, not guarantees.
Landlord ↔ Tenant lean methodology
- Overall (STATE)
- 15 Strongly Tenant-Friendly
- State New York
- 15 Strongly Tenant-Friendly · D+10
- County
- — inherits STATE
- City
- — inherits STATE
ZIP-level market 12308
- Home prices YoY
- -14.6%
- Active inventory
- 79
- Price-to-rent
- 8.6×
Monthly cashflow live
- Estimated rent
- $2,191 high interval (Pro) →
- Mortgage (P&I)
- −$1,180
- Tax est. 1.5%
- −$281 /mo · $3,375/yr
- Insurance
- −$94
- HOA
- −$0
- Vacancy / Maint / Mgmt
- −$460
- Net cashflow
- $176
Break-even live
Sensitivity live
| Price | -10% $331 | -5% $254 | +0% $176 | +5% $98 | +10% $20 |
|---|---|---|---|---|---|
| Rent | -10% $3 | -5% $89 | +0% $176 | +5% $262 | +10% $349 |
| Rate | -1.0pp $289 | -0.5pp $233 | base $176 | +0.5pp $118 | +1.0pp $58 |
UW: 25.0% down · 7.5% · 30yr · 1.5% tax · 5.0% vac · 8.0% maint · 8.0% mgmt
Financing live
Cash to close
- Down payment
- $56,250
- Closing costs
- $6,750
- Reserves months
- —
- Total cash needed
- —
Loan-product check · same deal, 3 products live
Conventional
25% down · 7.5% · 30yr
- Down + closing
- —
- Monthly P&I
- —
- Monthly cashflow
- —
- DSCR
- —
- Eligible?
- —
Personal DTI + credit; lowest rate.
DSCR
20% down · 8.5% · 30yr
- Down + closing
- —
- Monthly P&I
- —
- Monthly cashflow
- —
- DSCR
- —
- Eligible?
- —
No personal income docs; deal must DSCR.
Hard money
10% down · 12.0% · 12mo
- Down + closing
- —
- Monthly P&I
- —
- Monthly cashflow
- —
- DSCR
- —
- Eligible?
- —
Short-term bridge; refi at stabilization.
Rent comps 9 comps
| Address | Beds | Baths | Sqft | Rent | $/sqft | DOM | Units | Dist |
|---|---|---|---|---|---|---|---|---|
| 1347 Union St Schenectady, NY | 4.0 | 1.5 | 2188 | $3,750 | $1.71 | 45d | 1 | 0.39mi |
| 1037 University Pl Unit 2 Schenectady, NY | 3.0 | 1.0 | 1200 | $1,600 | $1.33 | 45d | 1 | 0.68mi |
| 918 Delamont Ave Schenectady, NY | 3.0 | 1.0 | 1192 | $1,600 | $1.34 | 25d | 1 | 0.88mi |
| 901 Nott St Unit 1R Schenectady, NY | 3.0 | 1.0 | 1500 | $1,250 | $0.83 | 25d | 1 | 1.07mi |
| 1747 Oneida St Schenectady, NY | 4.0 | 2.0 | 1620 | $2,700 | $1.67 | 15d | 1 | 1.16mi |
| 509 Nott St Unit 507 Schenectady, NY | 4.0 | 1.0 | 1400 | $1,695 | $1.21 | 45d | 1 | 1.19mi |
| 1687 Avenue A Schenectady, NY | 4.0 | 1.0 | 1672 | $2,300 | $1.38 | 45d | 1 | 1.29mi |
| 1673 Van Vranken Ave Schenectady, NY | 3.0 | 1.0 | 1335 | $1,750 | $1.31 | 45d | 1 | 1.30mi |
| 1755 Avenue B Unit B Schenectady, NY | 3.0 | 1.0 | 1200 | $1,700 | $1.42 | 15d | 1 | 1.35mi |
Listing history 2 events
-
2026-05-06status Pending 1352-char remark
-
2026-04-30$225,000 Active 1352-char remark
ⓘ Source: listings_history table (triggers on properties + properties_extension) + one-shot
backfill from property_details.listing_events for pre-trigger history.
Climate risk First Street
- Flood 1/10 Low FEMA zone X (unshaded) · 0% chance over 30 yrs
- Wildfire 1/10 Low
- Heat 4/10 Moderate 7 d/yr ≥95°F today · 16 d/yr by 30 yrs out
- Wind 3/10 Moderate 4% chance of damaging wind over 30 yrs
- Air quality 1/10 Low 0 unhealthy d/yr today · 0 by 30 yrs out
Nearby sold comps map
Loading sold comps map…
Walkable amenities ~0.75 mi
Loading nearby amenities…
Taxation est. · year 1
- Rental income
- $26,290
- − Mortgage interest
- −$12,603
- − Property taxes
- −$3,375
- − Insurance
- −$1,125
- − Repairs & maintenance
- −$2,103
- − Management
- −$2,103
- − Depreciation
- −$6,545
- Taxable loss
- −$1,565
- Est. tax savings @ 24.0%
- +$376
- After-tax cash flow
- $2,486/yr
For passive investors: Depreciation is non-cash, so a rental often shows a tax loss while cash-flowing — sheltering income. Rental losses are passive: they offset passive income freely, and up to $25,000/yr can offset ordinary (W-2) income if you actively participate and your MAGI is under $100k (phasing out to $0 by $150k); unused losses carry forward. On sale, claimed depreciation is recaptured at up to 25%, and gains may owe capital-gains tax (a 1031 exchange can defer both). Figures are a year-1 estimate at your 24.0% rate — not tax advice; consult a CPA.
Condition & rehab AI · 12 photos
This move-in ready colonial blends turn-of-the-century charm with modern convenience, featuring hardwood floors, a classic eat-in kitchen, and a bright living room. The home is in good condition with minimal updates needed to maximize its value.
Value-add opportunities
- Both Painting exterior and interior — Fresh paint enhances curb appeal and interior aesthetics
- Both Updating light fixtures — Modern light fixtures improve aesthetics and energy efficiency
- Both Reorganizing interior layout — Improved flow and functionality can increase both resale and rental value
Renovation cost estimate screening
Value-add ROI direction
- Both Painting exterior and interior — Fresh paint enhances curb appeal and interior aesthetics ↑
- Both Updating light fixtures — Modern light fixtures improve aesthetics and energy efficiency ↑
- Both Reorganizing interior layout — Improved flow and functionality can increase both resale and rental value ↑
ⓘ Cost ranges are severity-bucket heuristics (US national rule-of-thumb). Get contractor quotes + a written scope before underwriting a rehab budget.
Schools (NCES district)
- District
- Schenectady City School District
- NCES district ID
- 3626010
- Math proficiency
- 38% ▲ 12.00%
- Reading proficiency
- 34% ▲ 2.00%
- Median HH income
- $39,453
- Composite
- 30.2/100
- National rank
- #6309
- State rank
- #556 of 590 in NY
Livability — Schenectady
- Score
- 78/100
- State rank
- #167
- US rank
- #2597
Category grades
Schools grade is shown separately in the Schools card above.
Census & demographics
- Census place
- Schenectady, NY
- County
- Schenectady County · 141,369 people
- City population
- 141,369
- Metro
- Albany-Schenectady-Troy, NY
- Population (ZIP)
- 15,511
- Household income
- $63,434
- Rent vs Own
- Severe rent burden
- 1016.0
Population outlook (Schenectady County) Hauer SSP2
- Today (2025)
- 155,046 people
- By 2030
- 154,322 · -0.5%
- By 2040
- 151,796 · -2.1%
- By 2050
- 148,621 · -4.1%
- By 2075
- 141,229 · -8.9%
- By 2100
- 126,014 · -18.7%
Race, ethnicity, and origin ACS 2023
- Neighborhood character
- Diverse neighborhood (Simpson 0.63)
- Race & ethnicity
- White 57% Black 17% Hispanic / Latino 13% Two or more races 7% Asian 3%
- Hispanic origin (detail)
- Mexican 2% Puerto Rican 8%
- Common ancestry
- Lithuanian 4% Romanian 4% Slovak 3%
- Foreign-born
- 10% · Canada
- Languages at home
- 89% English-only · Spanish 5% Other Indo-European 2% Arabic 1%
Political lean MEDSL · Schenectady
- 2024 margin
- D (+10.8) · D 55.4% · R 44.6%
- 2008→2024 swing
- -1.8pp toward R · 2008: 12.7pp · 2024: 10.8pp
- All cycles
- 2024: D+10.8 2020: D+15.7 2016: D+5.8 2012: D+15.4 2008: D+12.7
Not yet ingested
- Civics
- —
Market trends
- HPI YoY
- ▼ -59.17%
- Current HPI
- 344.8675
- Rent YoY
- —
- Metro
- Albany-Schenectady-Troy, NY
- State GDP YoY
- ▲ 2.60%
- F500 in state
- 92
Industry mix (Fortune 500 HQ in NY)
| Industry | F500 HQs | Revenue |
|---|---|---|
| Financial Services | 10 | $950B |
|
||
| Consumer Goods | 9 | $162B |
|
||
| Insurance | 4 | $225B |
|
||
| Telecommunications | 2 | $144B |
|
||
| Pharmaceuticals | 2 | $112B |
|
||
| Media / Entertainment | 2 | $69B |
|
||
Price history
2 events — show timeline
- 2026-05-06 Pending — Global MLS
- 2026-04-30 Listed $225,000 Global MLS
Cash-flow waterfall
monthlySold comps — $/sqft
last 12 mo · ≤1 miLoading sold comps…