220 Lafayette Ave · Lawrenceburg, TN
Flood risk 1/10 · Minimal
- FEMA flood zone
- X (unshaded)
- Chance of flooding over 30 yrs
- 0.0%
- Est. flood insurance / yr
- $507 – $1,088
Fire risk 4/10 · Minor
- Est. fire insurance / yr
- $949 – $1,763
Heat risk 5/10 · Moderate
- Hot days now (above 103°F)
- 7 days/yr
- Hot days in 30 yrs
- 20 days/yr
Wind risk 4/10 · Minor
- Chance of severe wind over 30 yrs
- 17.0%
Air-quality risk 2/10 · Minimal
- Unhealthy air days now
- 0 days/yr
- Unhealthy air days in 30 yrs
- 1 days/yr
Risk factors via First Street. Map © Google.
Why this score? — see what drove the C+ grade
The composite is a weighted blend of 9 inputs, each scored 0–100. Each bar is that input's sub-score; the figure is the points it added to the 100-point composite (weight × sub-score).
- Cash flow +26.3/30.0
- DSCR +8.9/10.0
- ARV discount +7.5/15.0
- 1% rule +7.0/10.0
- Livability +3.4/5.0
- Rent growth +2.5/5.0
- Schools +2.4/10.0
- Condition / age +2.2/5.0
- Appreciation +0.0/10.0
$120,000
🖨 Deal sheet (PDF) 📄 Offer letter ✓ Due diligence
Listing remarks
This home is a bonus!!! Not only are you buying the home, you are getting a commercial building with 1147 sq ft. This is a great home that has had some renovations done but could still use some of your own personalization!!! Great location, close to everything! Garage in back of home also has a bath installed.
Key facts
- 0.5 acre lot
- 2 garage spots
- Built 1922
Property features AI
Finance
- HOA & community: Pets allowed
Exterior
- Parking: Detached 2-car garage; 2 covered parking spaces (total 2 parking spaces)
- Utilities: Public water; Public sewer; Electricity available
- Home design: Single-family residence; One story
- Construction: Constructed with other/unspecified materials; Existing structure (year built listed as existing)
- Exterior features: Approximately 0.5-acre lot
Interior
- Kitchen: Kitchen present (approximate size 12x10)
- Bedrooms: 4 bedrooms total; 2 main-level bedrooms; Bedroom sizes approximately 12x11, 11x11, 10x11, and 10x10
- Flooring: Wood flooring; Laminate flooring
- Bathrooms: 1 full bathroom
- Heating & cooling: Electric heating; Electric cooling
- Interior features: No built-in appliances listed; Wood and laminate flooring throughout
Neighborhood map
What this means for you Summary
Snapshot
- This is a 4-bed/1.0-bath single-family listed at $120k. Condition is rated fair.
Deal economics
- At list price, monthly cash flow is $310 ($4k/yr) — positive.
- The deal already cash-flows at list — no discount required.
- Meets the 1% rule at list price ($1k rent vs $120k).
- Recommended offer: $113k (6.0% below list) — sets the bar for market timing.
Location & tenants
- Location reads 67/100 on livability (#105 in TN) — a middle-class / working-renter tenant base. Strengths: cost of living A+, housing A+, health & safety A+; Watch: amenities F, commute F, employment F.
- Lawrence County (rural): math 29% / reading 29% proficiency, ranked #67 of 139 in TN (top 48%) — low school quality limits family demand, transient renter base, plan for 1-2y turnover.
- Zoned schools: Ingram Sowell Elementary (math 8% / reading 12%, grade F, #818 of 952 statewide, top 87%, 428 students, 0% FRL); Lawrence Co High School (math 26% / reading 23%, grade F, #129 of 332 statewide, top 43%, 1,143 students, 0% FRL) — zoned schools average 0% FRL vs 50% district-wide (50 pts lower); this property's tenant base skews higher-income than the district average.
- Market conditions: 172 active listings in the ZIP; 27 units permitted in Lawrence County in 2024 (0 in 5+ unit buildings).
Forward outlook
- Local home prices are declining (-3.0%/yr); year-one equity from $830 of loan paydown is wiped out by about $4k of value loss. Plan a longer hold.
- Lawrence County population projected to shrink 4% by 2050 — rents likely to lag national; underwrite the cash flow, not the appreciation.
- At projected returns (-3.0% appreciation + 3.0% rent growth), your $34k cash investment doubles in ~10 years — after that, you're playing with house money.
Negotiation context
- It's been on market 75 days — a 6% lower offer ($113k) is reasonable based on typical stale-listing flexibility.
- 5 sale attempts with the ask held roughly flat each time — persistent listings suggest the price (not the market) is what's stuck; bring a comps-based counter.
Risks & watch-outs
- Watch-outs: built in 1922 — expect roof / HVAC / electrical / plumbing capex.
- Climate carrying-cost: extreme-heat days projected 7→20/yr by 2055 (HVAC capex compounding) — expect insurance premiums to compound above CPI over the hold.
Questions for the listing agent
- It's been on market 75 days. Have you received any prior offers? Is the seller open to a 6% concession, seller financing, or rate buy-down credit?
- Have any recent inspections been done? Can we get a copy of the seller's disclosures and any deferred-maintenance estimates?
- Built in 1922 — when were the roof, HVAC, electrical panel, plumbing, and water heater last replaced?
- Why hasn't it sold? Are there any deal-killer items the seller is aware of (foundation, flood, title, zoning, code violations)?
- Is there a deadline driving the sale (1031 exchange, divorce, estate, relocation)? That informs how much negotiation room exists.
- Schools are D-rated, which usually means shorter tenancies and higher turnover. Who's the typical renter profile here, and what's been the actual vacancy rate?
- What's the average days-on-market for RENTAL listings here right now (not sales)? A rising rental-DOM trend means longer vacancies and softer asking-rent achievability than the comps imply.
- What's the recent tenant-quality profile in this submarket — average credit score on applications, eviction rate, late-payment / NSF rate, and stable-employment percentage? A property-management company in the area should have these aggregated.
- How much new for-sale + rental construction is in the pipeline within 1–3 miles? Heavy new supply typically softens prices + rents 12–24 months out; constrained supply supports both.
Investment metrics
- 1% rule
- 1.20% ✓
- Cap rate
- 9.40%
- Cash-on-cash
- 11.09%
- DSCR
- 1.49
- GRM
- 6.9
CMA / ARV
No comps found within radius.
Projected returns pro-forma
-3.0% appreciation · 3.0% rent growth · sell at horizon
- IRR
- 0.3%
- Equity multiple
- 1.01×
- Total profit
- $350
- Equity at exit
- $17,892
- IRR
- 9.9%
- Equity multiple
- 1.77×
- Total profit
- $25,855
- Equity at exit
- $10,375
Cash invested: $33,600 (down + closing). Projections, not guarantees.
Landlord ↔ Tenant lean methodology
- Overall (STATE)
- 87 Strongly Landlord-Friendly
- State Tennessee
- 87 Strongly Landlord-Friendly · R+13
- County
- — inherits STATE
- City
- — inherits STATE
ZIP-level market 38464
- Home prices YoY
- -19.4%
- Active inventory
- 172
- Price-to-rent
- 6.9×
Monthly cashflow live
- Estimated rent
- $1,443 medium interval (Pro) →
- Mortgage (P&I)
- −$629
- Tax est. 1.5%
- −$150 /mo · $1,800/yr
- Insurance
- −$50
- HOA
- −$0
- Vacancy / Maint / Mgmt
- −$303
- Net cashflow
- $310
Break-even live
Sensitivity live
| Price | -10% $393 | -5% $352 | +0% $310 | +5% $269 | +10% $228 |
|---|---|---|---|---|---|
| Rent | -10% $196 | -5% $253 | +0% $310 | +5% $367 | +10% $424 |
| Rate | -1.0pp $371 | -0.5pp $341 | base $310 | +0.5pp $279 | +1.0pp $248 |
UW: 25.0% down · 7.5% · 30yr · 1.5% tax · 5.0% vac · 8.0% maint · 8.0% mgmt
Financing live
Cash to close
- Down payment
- $30,000
- Closing costs
- $3,600
- Reserves months
- —
- Total cash needed
- —
Loan-product check · same deal, 3 products live
Conventional
25% down · 7.5% · 30yr
- Down + closing
- —
- Monthly P&I
- —
- Monthly cashflow
- —
- DSCR
- —
- Eligible?
- —
Personal DTI + credit; lowest rate.
DSCR
20% down · 8.5% · 30yr
- Down + closing
- —
- Monthly P&I
- —
- Monthly cashflow
- —
- DSCR
- —
- Eligible?
- —
No personal income docs; deal must DSCR.
Hard money
10% down · 12.0% · 12mo
- Down + closing
- —
- Monthly P&I
- —
- Monthly cashflow
- —
- DSCR
- —
- Eligible?
- —
Short-term bridge; refi at stabilization.
Listing history 26 events
-
2026-06-21days on market $120,000 Active 75 DOM
-
2026-06-21days on market $120,000 Active 74 DOM
-
2026-06-18days on market $120,000 Active 72 DOM
-
2026-06-17days on market $120,000 Active 71 DOM
-
2026-06-16days on market $120,000 Active 70 DOM
-
2026-06-15days on market $120,000 Active 69 DOM
-
2026-06-13days on market $120,000 Active 67 DOM
-
2026-06-12days on market $120,000 Active 66 DOM
-
2026-06-09days on market $120,000 Active 63 DOM
-
2026-06-08days on market $120,000 Active 62 DOM
-
2026-06-08days on market $120,000 Active 61 DOM
-
2026-06-07days on market $120,000 Active 60 DOM
-
2026-06-03days on market $120,000 Active 57 DOM
-
2026-06-02days on market $120,000 Active 56 DOM
-
2026-06-01days on market $120,000 Active 55 DOM
-
2026-05-31days on market $120,000 Active 54 DOM
-
2026-04-07$120,000 Active
-
2026-03-10historical
-
2026-01-15price $120,000
-
2025-12-08status Active
-
2025-12-06historical
-
2025-10-21status Active
-
2025-10-20historical Active Under Contract
-
2025-10-14status Active
-
2025-09-24status Pending
-
2025-06-05$80,000 Active
ⓘ Source: listings_history table (triggers on properties + properties_extension) + one-shot
backfill from property_details.listing_events for pre-trigger history.
Climate risk First Street
- Flood 1/10 Low FEMA zone X (unshaded) · 0% chance over 30 yrs
- Wildfire 4/10 Moderate
- Heat 5/10 Major 7 d/yr ≥103°F today · 20 d/yr by 30 yrs out
- Wind 4/10 Moderate 17% chance of damaging wind over 30 yrs
- Air quality 2/10 Low 0 unhealthy d/yr today · 1 by 30 yrs out
Nearby sold comps map
Loading sold comps map…
Walkable amenities ~0.75 mi
Loading nearby amenities…
Taxation est. · year 1
- Rental income
- $17,313
- − Mortgage interest
- −$6,722
- − Property taxes
- −$1,800
- − Insurance
- −$600
- − Repairs & maintenance
- −$1,385
- − Management
- −$1,385
- − Depreciation
- −$3,491
- Taxable income
- $1,930
- Est. tax owed @ 24.0%
- −$463
- After-tax cash flow
- $3,262/yr
For passive investors: Depreciation is non-cash, so a rental often shows a tax loss while cash-flowing — sheltering income. Rental losses are passive: they offset passive income freely, and up to $25,000/yr can offset ordinary (W-2) income if you actively participate and your MAGI is under $100k (phasing out to $0 by $150k); unused losses carry forward. On sale, claimed depreciation is recaptured at up to 25%, and gains may owe capital-gains tax (a 1031 exchange can defer both). Figures are a year-1 estimate at your 24.0% rate — not tax advice; consult a CPA.
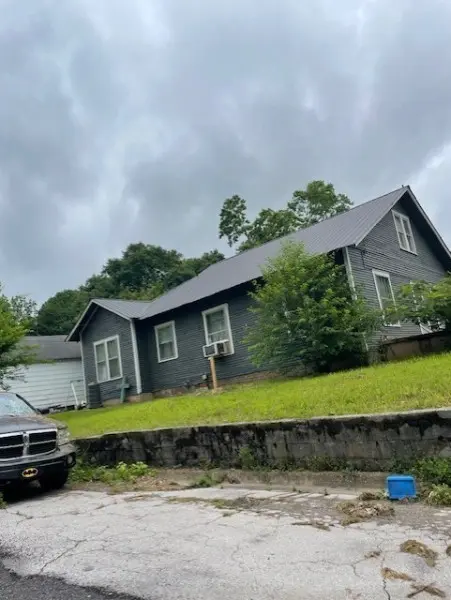
Condition & rehab AI · 3 photos
This single-family home requires moderate renovations, including exterior repairs, painting, and interior updates, to improve its condition and value.
Repairs flagged
- Major siding — Significant wear and tear
- Major roof — No visible damage, but age is unknown
- Major flooring — No visible flooring, but wear is implied
- Major interior walls/paint — No visible interior, but paint is implied to be old
- Major systems — No visible systems, but age is implied
Value-add opportunities
- Both paint exterior and interior — Fresh paint enhances curb appeal and interior aesthetics
- Both repair and replace siding — New siding improves curb appeal and structural integrity
- Both repair and replace roof — A new roof ensures long-term durability and energy efficiency
- Both repair and replace flooring — New flooring improves comfort and aesthetics
- Both repair and replace interior walls/paint — Fresh paint and repairs enhance interior aesthetics and value
Renovation cost estimate screening
| Repair item | Severity | Est. cost |
|---|---|---|
| siding · Significant wear and tear | Major | $15,000–50,000 |
| roof · No visible damage, but age is unknown | Major | $15,000–50,000 |
| flooring · No visible flooring, but wear is implied | Major | $15,000–50,000 |
| interior walls/paint · No visible interior, but paint is implied to be old | Major | $15,000–50,000 |
| systems · No visible systems, but age is implied | Major | $15,000–50,000 |
| Total estimated repair cost · 5 items | $75,000–250,000 |
Value-add ROI direction
- Both paint exterior and interior — Fresh paint enhances curb appeal and interior aesthetics ↑
- Both repair and replace siding — New siding improves curb appeal and structural integrity ↑
- Both repair and replace roof — A new roof ensures long-term durability and energy efficiency ↑
- Both repair and replace flooring — New flooring improves comfort and aesthetics ↑
- Both repair and replace interior walls/paint — Fresh paint and repairs enhance interior aesthetics and value ↑
ⓘ Cost ranges are severity-bucket heuristics (US national rule-of-thumb). Get contractor quotes + a written scope before underwriting a rehab budget.
Schools (NCES district)
- District
- Lawrence County
- NCES district ID
- 4702340
- Math proficiency
- 29% ▼ -11.00%
- Reading proficiency
- 29% ▼ -8.00%
- Median HH income
- $37,613
- Composite
- 24.2/100
- National rank
- #7729
- State rank
- #67 of 139 in TN
Livability — Lawrenceburg
- Score
- 67/100
- State rank
- #105
- US rank
- #10729
Category grades
Schools grade is shown separately in the Schools card above.
Census & demographics
- Census place
- Lawrenceburg, TN
- Population (ZIP)
- 23,727
Population outlook (Lawrence County) Hauer SSP2
- Today (2025)
- 42,724 people
- By 2030
- 42,627 · -0.2%
- By 2040
- 42,144 · -1.4%
- By 2050
- 40,800 · -4.5%
- By 2075
- 36,643 · -14.2%
- By 2100
- 29,193 · -31.7%
Race, ethnicity, and origin ACS 2023
- Neighborhood character
- Predominantly White (88%)
- Race & ethnicity
- White 88% Two or more races 6% Hispanic / Latino 4% Black 3%
- Common ancestry
- Slovak 2% Iranian 2% Italian 1%
- Foreign-born
- 2% · Canada
- Languages at home
- 96% English-only · Spanish 2% German/W. Germanic 1%
Political lean MEDSL · Lawrence
- 2024 margin
- Solid R (+69.1) · D 15.1% · R 84.1%
- 2008→2024 swing
- -35.3pp toward R · 2008: -33.7pp · 2024: -69.1pp
- All cycles
- 2024: R+69.1 2020: R+64.8 2016: R+61.3 2012: R+42.9 2008: R+33.7
Not yet ingested
- Civics
- —
Market trends
- HPI YoY
- ▼ -70.17%
- Current HPI
- 291.6302
- Rent YoY
- —
- Metro
- —
- State GDP YoY
- ▲ 2.78%
- F500 in state
- 22
Industry mix (Fortune 500 HQ in TN)
| Industry | F500 HQs | Revenue |
|---|---|---|
| Healthcare | 3 | $91B |
|
||
| Retail | 3 | $72B |
|
||
| Transportation / Logistics | 1 | $88B |
|
||
| Paper / Packaging | 1 | $19B |
|
||
| Insurance | 1 | $13B |
|
||
| Energy | 1 | $12B |
|
||
Price history
+50.0% since first listed10 events — show timeline
- 2026-04-07 Listed $120,000 REALTRACS as Distributed by MLS Grid
- 2026-03-10 Listing Removed — REALTRACS as Distributed by MLS Grid
- 2026-01-15 Price Changed $120,000 REALTRACS as Distributed by MLS Grid
- 2025-12-08 Relisted — REALTRACS as Distributed by MLS Grid
- 2025-12-06 Listing Removed — REALTRACS as Distributed by MLS Grid
- 2025-10-21 Relisted — REALTRACS as Distributed by MLS Grid
- 2025-10-20 Contingent — REALTRACS as Distributed by MLS Grid
- 2025-10-14 Relisted — REALTRACS as Distributed by MLS Grid
- 2025-09-24 Pending — REALTRACS as Distributed by MLS Grid
- 2025-06-05 Listed $80,000 REALTRACS as Distributed by MLS Grid
Cash-flow waterfall
monthlySold comps — $/sqft
last 12 mo · ≤1 miLoading sold comps…