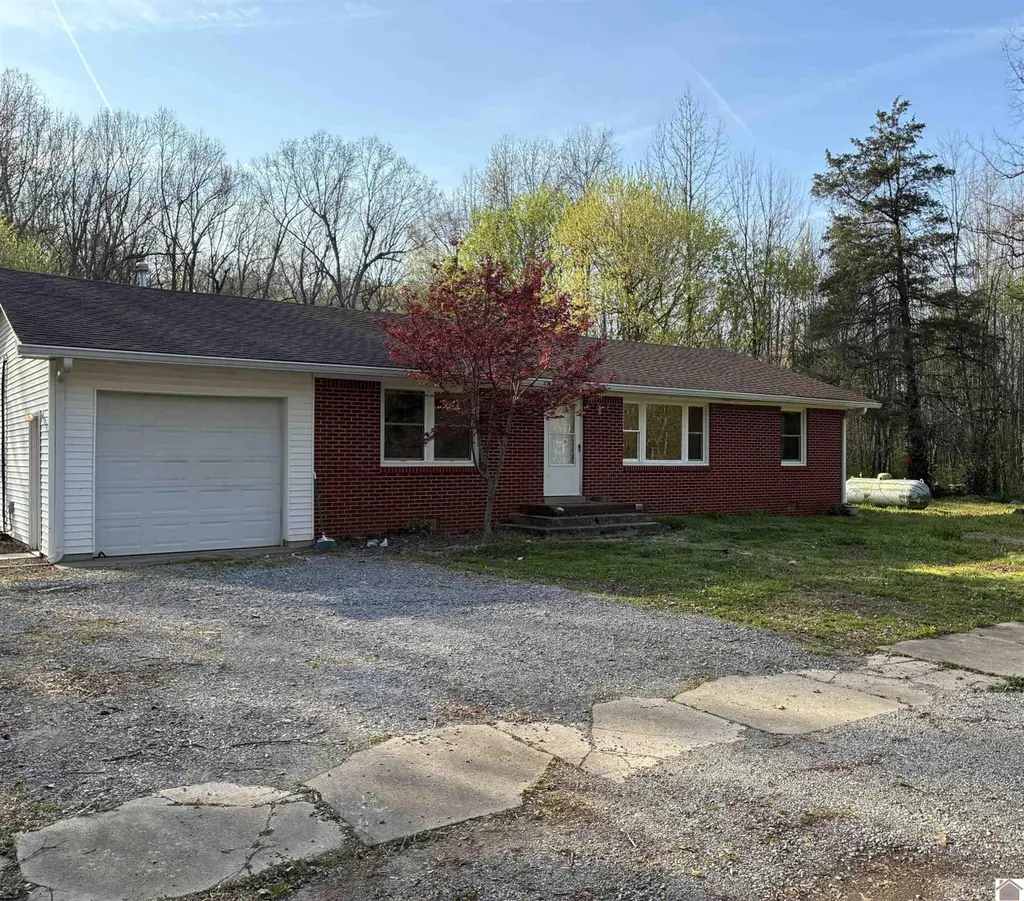
129 3rd St · Dexter, KY
Flood risk 1/10 · Minimal
- FEMA flood zone
- A
- Chance of flooding over 30 yrs
- 0.0%
- Est. flood insurance / yr
- $1,009 – $1,996
Fire risk 2/10 · Minimal
- Est. fire insurance / yr
- $839 – $1,559
Heat risk 5/10 · Moderate
- Hot days now (above 109°F)
- 7 days/yr
- Hot days in 30 yrs
- 20 days/yr
Wind risk 4/10 · Minor
- Chance of severe wind over 30 yrs
- 9.0%
Air-quality risk 1/10 · Minimal
- Unhealthy air days now
- 0 days/yr
- Unhealthy air days in 30 yrs
- 0 days/yr
Risk factors via First Street. Map © Google.
Why this score? — see what drove the B grade
The composite is a weighted blend of 9 inputs, each scored 0–100. Each bar is that input's sub-score; the figure is the points it added to the 100-point composite (weight × sub-score).
- Cash flow +26.4/30.0
- Appreciation +10.0/10.0
- DSCR +9.0/10.0
- ARV discount +7.5/15.0
- 1% rule +7.0/10.0
- Schools +3.8/10.0
- Livability +3.0/5.0
- Rent growth +2.5/5.0
- Condition / age +2.2/5.0
$99,900
🖨 Deal sheet 📄 Offer letter ✓ Due diligence
Listing remarks
MOTIVATED SELLERS - ALL OFFERS WILL BE CONSIDERED. Charming all-brick 3-bedroom, 1-bath home with a 1-car garage, featuring original hardwood floors throughout the living room, hallway, and all bedrooms — a perfect blend of character and opportunity. New roof in 2024. Nestled in a peaceful country setting, this property offers peace and privacy while presenting excellent investment potential. Bring your ideas to update and add value.
Key facts
- New roof
- 1 acre lot
- Garage
Tags
Property features AI
Exterior
- Parking: Attached garage (1 car)
- Utilities: Public water; Septic tank sewer
- Home design: Single family residence; Single-story
- Construction: Composition roof
- Exterior features: 1-acre lot
Interior
- Flooring: Ceramic tile; Tile; Vinyl; Wood
- Bathrooms: 1 full bathroom
- Heating & cooling: Forced air heating (propane); Central air conditioning
- Interior features: Electric water heater; Crawl space basement
Neighborhood map
What this means for you Summary
Snapshot
- This is a 3-bed/1.0-bath single-family listed at $100k. Condition is rated fair.
Deal economics
- At list price, monthly cash flow is $135 ($2k/yr) — positive.
- The deal already cash-flows at list — no discount required.
- Meets the 1% rule at list price ($1k rent vs $100k).
- Recommended offer: $94k (6.0% below list) — sets the bar for market timing.
Location & tenants
- Location reads 59/100 on livability (#425 in KY) — a working-class tenant base; expect higher turnover. Strengths: cost of living A+, housing A-; Watch: employment D, schools F, amenities F.
- Calloway County (town): math 44% / reading 48% proficiency, ranked #19 of 165 in KY (top 12%) — families likely to look elsewhere, expect single-tenant / working-renter base with shorter leases.
- Market conditions: 18 active listings in the ZIP; 81 units permitted in Calloway County in 2024 (66 in 5+ unit buildings).
Forward outlook
- In year one you build about $11k of equity ($691 loan paydown + $10k appreciation (10.0% local appreciation)).
- Calloway County population projected at +18% by 2050 — long-run rental-demand tailwind backs the buy-and-hold thesis.
- At projected returns (10.0% appreciation + 3.0% rent growth), your $28k cash investment doubles in ~3 years — after that, you're playing with house money.
- By year 4, paydown + projected appreciation supports a ~$38k cash-out refi (75% LTV) — recoverable capital for the next deal without selling this one.
Negotiation context
- It's been on market 69 days — a 6% lower offer ($94k) is reasonable based on typical stale-listing flexibility.
Risks & watch-outs
- Watch-outs: flood insurance adds $125/mo.
- Climate carrying-cost: in FEMA flood zone A (mandatory federal flood insurance); extreme-heat days projected 7→20/yr by 2055 (HVAC capex compounding) — expect insurance premiums to compound above CPI over the hold.
Questions for the listing agent
- It's been on market 69 days. Have you received any prior offers? Is the seller open to a 6% concession, seller financing, or rate buy-down credit?
- Have any recent inspections been done? Can we get a copy of the seller's disclosures and any deferred-maintenance estimates?
- What's the actual annual flood-insurance premium (NFIP or private), and is the property in a SFHA with mandatory coverage?
- Why hasn't it sold? Are there any deal-killer items the seller is aware of (foundation, flood, title, zoning, code violations)?
- Is there a deadline driving the sale (1031 exchange, divorce, estate, relocation)? That informs how much negotiation room exists.
- Schools are F-rated, which usually means shorter tenancies and higher turnover. Who's the typical renter profile here, and what's been the actual vacancy rate?
- What's the average days-on-market for RENTAL listings here right now (not sales)? A rising rental-DOM trend means longer vacancies and softer asking-rent achievability than the comps imply.
- What's the recent tenant-quality profile in this submarket — average credit score on applications, eviction rate, late-payment / NSF rate, and stable-employment percentage? A property-management company in the area should have these aggregated.
- How much new for-sale + rental construction is in the pipeline within 1–3 miles? Heavy new supply typically softens prices + rents 12–24 months out; constrained supply supports both.
Investment metrics
- 1% rule
- 1.20% ✓
- Cap rate
- 9.42%
- Cash-on-cash
- 11.17%
- DSCR
- 1.50
- GRM
- 6.9
CMA / ARV
- ARV (on-the-fly)
- $208,145
- Comps found
- 2
Show comp detail 2 sales within ~0.75 mi
| Address | Dist | Beds/Ba | Sqft | Sold | Price | $/sf | Match |
|---|---|---|---|---|---|---|---|
| 129 3rd St | 0.00mi | 3/1.0 | 1,565 (0%) | 0mo | $90,000 | $58 | 100 |
| 1558 Almo Rd | 0.20mi | 3/2.0 | 1,616 (+3%) | 9mo | $215,000 | $133 | 74 |
Match score weights: distance 35% · size 25% · config 20% · recency 20%. Top-matched comps best support the ARV.
Projected returns pro-forma
10.0% appreciation · 3.0% rent growth · sell at horizon
- IRR
- 28.5%
- Equity multiple
- 3.26×
- Total profit
- $63,110
- Equity at exit
- $89,998
- IRR
- 24.8%
- Equity multiple
- 7.41×
- Total profit
- $179,269
- Equity at exit
- $194,084
Cash invested: $27,972 (down + closing). Projections, not guarantees.
Landlord ↔ Tenant lean methodology
- Overall (STATE)
- 83 Strongly Landlord-Friendly
- State Kentucky
- 83 Strongly Landlord-Friendly · R+16
- County
- — inherits STATE
- City
- — inherits STATE
ZIP-level market 42020
- Home prices YoY
- 10.4%
- Active inventory
- 18
- Price-to-rent
- 6.9×
Monthly cashflow live
- Estimated rent
- $1,203 medium interval (Pro) →
- Mortgage (P&I)
- −$524
- Tax est. 1.5%
- −$125 /mo · $1,498/yr
- Insurance
- −$42
- Flood insurance flood zone
- −$125 /mo · $1,502/yr
- HOA
- −$0
- Vacancy / Maint / Mgmt
- −$253
- Net cashflow
- $135
Break-even live
UW: 25.0% down · 7.5% · 30yr · 1.5% tax · 5.0% vac · 8.0% maint · 8.0% mgmt
Financing live
Cash to close
- Down payment
- $24,975
- Closing costs
- $2,997
- Reserves months
- —
- Total cash needed
- —
Loan-product check · same deal, 3 products live
Conventional
25% down · 7.5% · 30yr
- Down + closing
- —
- Monthly P&I
- —
- Monthly cashflow
- —
- DSCR
- —
- Eligible?
- —
Personal DTI + credit; lowest rate.
DSCR
20% down · 8.5% · 30yr
- Down + closing
- —
- Monthly P&I
- —
- Monthly cashflow
- —
- DSCR
- —
- Eligible?
- —
No personal income docs; deal must DSCR.
Hard money
10% down · 12.0% · 12mo
- Down + closing
- —
- Monthly P&I
- —
- Monthly cashflow
- —
- DSCR
- —
- Eligible?
- —
Short-term bridge; refi at stabilization.
Listing history 9 events
-
2026-06-08days on market $99,900 Active 69 DOM
-
2026-06-07days on market $99,900 Active 68 DOM
-
2026-06-02days on market $99,900 Active 63 DOM
-
2026-06-01days on market $99,900 Active 62 DOM
-
2026-05-31days on market $99,900 Active 61 DOM
-
2026-05-30days on market $99,900 Active 60 DOM
-
2026-05-11price $99,900
-
2026-04-20price $115,000
-
2026-03-31$125,000 Active
ⓘ Source: listings_history table (triggers on properties + properties_extension) + one-shot
backfill from property_details.listing_events for pre-trigger history.
Climate risk First Street
- Flood 1/10 Low FEMA zone A · 0% chance over 30 yrs
- Wildfire 2/10 Low
- Heat 5/10 Major 7 d/yr ≥109°F today · 20 d/yr by 30 yrs out
- Wind 4/10 Moderate 9% chance of damaging wind over 30 yrs
- Air quality 1/10 Low 0 unhealthy d/yr today · 0 by 30 yrs out
Nearby sold comps map
Loading sold comps map…
Walkable amenities ~0.75 mi
Loading nearby amenities…
Taxation est. · year 1
- Rental income
- $14,441
- − Mortgage interest
- −$5,596
- − Property taxes
- −$1,498
- − Insurance
- −$2,002
- − Repairs & maintenance
- −$1,155
- − Management
- −$1,155
- − Depreciation
- −$2,906
- Taxable income
- $128
- Est. tax owed @ 24.0%
- −$31
- After-tax cash flow
- $1,591/yr
For passive investors: Depreciation is non-cash, so a rental often shows a tax loss while cash-flowing — sheltering income. Rental losses are passive: they offset passive income freely, and up to $25,000/yr can offset ordinary (W-2) income if you actively participate and your MAGI is under $100k (phasing out to $0 by $150k); unused losses carry forward. On sale, claimed depreciation is recaptured at up to 25%, and gains may owe capital-gains tax (a 1031 exchange can defer both). Figures are a year-1 estimate at your 24.0% rate — not tax advice; consult a CPA.
Condition & rehab AI · 13 photos
This charming all-brick home with original hardwood floors and a new roof in 2024 requires moderate repairs and maintenance to improve its condition and value.
Repairs flagged
- Minor Brick siding — Some discoloration
- Minor Hardwood floors — Some wear
- Minor Painted walls — Some scuff marks
Value-add opportunities
- Both Paint exterior — Enhances curb appeal and value
- Both Replace water heater — Improves comfort and reduces maintenance costs
- Both Replace flooring — Freshens up the interior and improves comfort
- Both Paint interior walls — Enhances the look and feel of the home
Renovation cost estimate screening
| Repair item | Severity | Est. cost |
|---|---|---|
| Brick siding · Some discoloration | Minor | $500–3,000 |
| Hardwood floors · Some wear | Minor | $500–3,000 |
| Painted walls · Some scuff marks | Minor | $500–3,000 |
| Total estimated repair cost · 3 items | $1,500–9,000 |
Value-add ROI direction
- Both Paint exterior — Enhances curb appeal and value ↑
- Both Replace water heater — Improves comfort and reduces maintenance costs ↑
- Both Replace flooring — Freshens up the interior and improves comfort ↑
- Both Paint interior walls — Enhances the look and feel of the home ↑
ⓘ Cost ranges are severity-bucket heuristics (US national rule-of-thumb). Get contractor quotes + a written scope before underwriting a rehab budget.
Schools (NCES district)
- District
- Calloway County
- NCES district ID
- 2100870
- Math proficiency
- 44% ▼ -12.00%
- Reading proficiency
- 48% ▼ -13.00%
- Median HH income
- $38,849
- Composite
- 38.39/100
- National rank
- #4208
- State rank
- #19 of 165 in KY
Livability — Dexter
- Score
- 59/100
- State rank
- #425
- US rank
- #20528
Category grades
Schools grade is shown separately in the Schools card above.
Census & demographics
- Population (ZIP)
- 2,215
Population outlook (Calloway County) Hauer SSP2
- Today (2025)
- 41,071 people
- By 2030
- 42,608 · +3.7%
- By 2040
- 45,435 · +10.6%
- By 2050
- 48,501 · +18.1%
- By 2075
- 56,481 · +37.5%
- By 2100
- 63,271 · +54.1%
Race, ethnicity, and origin ACS 2023
- Neighborhood character
- Predominantly White (96%)
- Race & ethnicity
- White 96% Two or more races 3% Hispanic / Latino 3%
- Common ancestry
- Italian 7% Scotch-Irish 2% Slovak 1%
- Foreign-born
- 0%
Political lean MEDSL · Calloway
- 2024 margin
- Solid R (+38.0) · D 30.2% · R 68.1% · Other 1.7%
- 2008→2024 swing
- -19.6pp toward R · 2008: -18.4pp · 2024: -38.0pp
- All cycles
- 2024: R+38.0 2020: R+31.8 2016: R+35.0 2012: R+27.4 2008: R+18.4
Not yet ingested
- Civics
- —
Market trends
- HPI YoY
- ▲ 25.44%
- Current HPI
- 269.0871
- Rent YoY
- —
- Metro
- —
- State GDP YoY
- ▲ 1.81%
- F500 in state
- 4
Industry mix (Fortune 500 HQ in KY)
| Industry | F500 HQs | Revenue |
|---|---|---|
| Healthcare | 1 | $118B |
|
||
| Food / Beverage | 1 | $7B |
|
||
Price history
-20.1% since first listed3 events — show timeline
- 2026-05-11 Price Changed $99,900 WKRMLS
- 2026-04-20 Price Changed $115,000 WKRMLS
- 2026-03-31 Listed $125,000 WKRMLS
Cash-flow waterfall
monthlySold comps — $/sqft
last 12 mo · ≤1 miLoading sold comps…