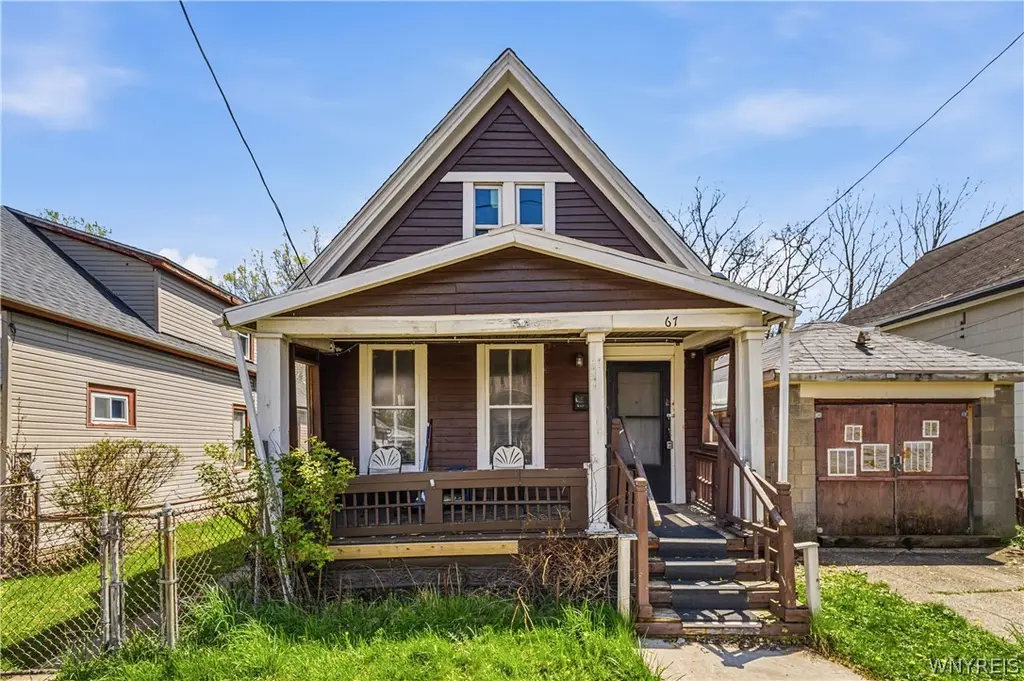
67 Halbert St · Buffalo, NY
Flood risk 1/10 · Minimal
- FEMA flood zone
- X (unshaded)
- Chance of flooding over 30 yrs
- 0.0%
- Est. flood insurance / yr
- $473 – $860
Fire risk 1/10 · Minimal
- Est. fire insurance / yr
- $691 – $1,283
Heat risk 3/10 · Minor
- Hot days now (above 93°F)
- 7 days/yr
- Hot days in 30 yrs
- 15 days/yr
Wind risk 1/10 · Minimal
- Chance of severe wind over 30 yrs
- —
Air-quality risk 3/10 · Minor
- Unhealthy air days now
- 2 days/yr
- Unhealthy air days in 30 yrs
- 3 days/yr
Risk factors via First Street. Map © Google.
Why this score? — see what drove the B grade
The composite is a weighted blend of 9 inputs, each scored 0–100. Each bar is that input's sub-score; the figure is the points it added to the 100-point composite (weight × sub-score).
- Cash flow +30.0/30.0
- 1% rule +10.0/10.0
- DSCR +10.0/10.0
- ARV discount +7.5/15.0
- Rent growth +4.0/5.0
- Livability +3.9/5.0
- Schools +3.3/10.0
- Condition / age +2.5/5.0
- Appreciation +0.0/10.0
$99,999
🖨 Deal sheet 📄 Offer letter ✓ Due diligence
Listing remarks
Calling all investors! Welcome to 67 Halbert Street — a unique investment opportunity featuring two homes on one lot, including a front house and a rear house. The front home offers 3 bedrooms, a 100-amp breaker panel, wall furnace heating, a small basement, and a detached one-car garage. Between the two homes, you’ll find a sizable yard offering additional outdoor space and potential. The rear home features 3 bedrooms and 1 full bathroom, making this property ideal for investors seeking strong rental potential or a value-add opportunity. Whether you’re searching for your next fix-and-flip project or a BRRRR investment opportunity, 67 Halbert Street may be the perfect addi
Key facts
- Sizable yard
- Two homes on one lot
- 6,960 sq ft lot
Tags
Property features AI
Finance
- Other: Two total residential units (multi-family property)
- Financial info: Tenant(s) pay all utilities; Operating expenses include water and sewer
Exterior
- Parking: Detached 2-car garage; One additional parking space
- Utilities: Public water connected; Sewer connected
- Home design: Single-story building; Wood siding construction; Existing/resale property
- Construction: Wood siding exterior
- Exterior features: Rectangular residential lot with 48 x 145 dimensions; City street frontage
Interior
- Kitchen: Gas water heater (appliance noted)
- Bedrooms: Two separate 3-bedroom units (each unit has 3 bedrooms)
- Flooring: Hardwood and varied flooring
- Bathrooms: Each unit has 1 full bathroom (2 full bathrooms total)
- Heating & cooling: Gas forced-air heating
- Interior features: Hardwood flooring in portions of the home; flooring varies throughout; Partial basement
- Laundry & utility: Two separate gas meters; Two separate electric meters
Neighborhood map
What this means for you Summary
Snapshot
- This is a 3-bed/1.0-bath other listed at $100k.
Deal economics
- At list price, monthly cash flow is $682 ($8k/yr) — positive.
- The deal already cash-flows at list — no discount required.
- Meets the 1% rule at list price ($2k rent vs $100k).
- Recommended offer: $97k (3.0% below list) — sets the bar for market timing.
- Cap rate 14.5% vs local median 8.0% in Buffalo — top-decile yield for the area; either an underpriced asset or a hidden risk that comps aren't pricing in. Stress-test before assuming the spread holds.
Location & tenants
- Location reads 77/100 on livability (#195 in NY, #3,011 nationally) — a middle-class / working-renter tenant base. Strengths: commute A+, housing A+, health & safety A+; Watch: crime F, employment D-.
- Buffalo City School District (urban): math 41% / reading 40% proficiency, ranked #535 of 590 in NY (top 91%) — families likely to look elsewhere, expect single-tenant / working-renter base with shorter leases; 75% free/reduced lunch — lower-income household profile, screen leases tightly.
- Market conditions: Rents rising fast (+5.8%/yr); 90 active listings in the ZIP; 25 comparable units currently listed for rent nearby; rentals lingering (median 44d on market — plan ~5-8 weeks vacancy on turnover, expect pricing pressure); 64% of comp listings sitting > 30 days — soft ceiling on asking rent; 1,244 units permitted in Erie County in 2024 (563 in 5+ unit buildings).
- This rent runs 33% of the median local income ($58k/yr) — at the standard rent-burdened threshold; future hikes will face affordability resistance.
Forward outlook
- Local home prices are declining (-3.0%/yr); year-one equity from $691 of loan paydown is wiped out by about $3k of value loss. Plan a longer hold.
- At projected returns (-3.0% appreciation + 5.8% rent growth), your $28k cash investment doubles in ~4 years — after that, you're playing with house money.
Negotiation context
- It's been on market 41 days — a 3% lower offer ($97k) is reasonable based on typical stale-listing flexibility.
- Current owner paid $17k; list at $100k implies a 488% gain — meaningful room to come down on a strong offer.
Risks & watch-outs
- Watch-outs: built in 1910 — expect roof / HVAC / electrical / plumbing capex.
Questions for the listing agent
- It's been on market 41 days. Have you received any prior offers? Is the seller open to a 3% concession, seller financing, or rate buy-down credit?
- Built in 1910 — when were the roof, HVAC, electrical panel, plumbing, and water heater last replaced?
- Is there a deadline driving the sale (1031 exchange, divorce, estate, relocation)? That informs how much negotiation room exists.
- Crime grade is F in this area — have there been break-ins, vandalism, or insurance claims at this property in the last 3 years? What carrier currently insures it and at what premium?
- What's the average days-on-market for RENTAL listings here right now (not sales)? A rising rental-DOM trend means longer vacancies and softer asking-rent achievability than the comps imply.
- What's the recent tenant-quality profile in this submarket — average credit score on applications, eviction rate, late-payment / NSF rate, and stable-employment percentage? A property-management company in the area should have these aggregated.
- How much new for-sale + rental construction is in the pipeline within 1–3 miles? Heavy new supply typically softens prices + rents 12–24 months out; constrained supply supports both.
Investment metrics
- 1% rule
- 1.62% ✓
- Cap rate
- 14.48%
- Cash-on-cash
- 29.24%
- DSCR
- 2.30
- GRM
- 5.1
CMA / ARV
- ARV (median comp)
- $274,746
- List price
- $99,999
- Delta
- -63.60%
- Verdict
- UNDERPRICED
- Comps
- 20 within 1.0 mi
Projected returns pro-forma
-3.0% appreciation · 5.81% rent growth · sell at horizon
- IRR
- 26.6%
- Equity multiple
- 2.14×
- Total profit
- $31,939
- Equity at exit
- $14,910
- IRR
- 35.8%
- Equity multiple
- 4.72×
- Total profit
- $104,144
- Equity at exit
- $8,646
Cash invested: $28,000 (down + closing). Projections, not guarantees.
Landlord ↔ Tenant lean methodology
- Overall (STATE)
- 15 Strongly Tenant-Friendly
- State New York
- 15 Strongly Tenant-Friendly · D+10
- County
- — inherits STATE
- City
- — inherits STATE
ZIP-level market 14214
- Rents YoY
- 5.8%
- Active inventory
- 90
- Price-to-rent
- 5.1×
Monthly cashflow live
- Estimated rent
- $1,622 high interval (Pro) →
- Mortgage (P&I)
- −$524
- Tax from tax record
- −$33 /mo · $400/yr
- Insurance
- −$42
- HOA
- −$0
- Vacancy / Maint / Mgmt
- −$341
- Net cashflow
- $682
Break-even live
UW: 25.0% down · 7.5% · 30yr · 1.5% tax · 5.0% vac · 8.0% maint · 8.0% mgmt
Financing live
Cash to close
- Down payment
- $25,000
- Closing costs
- $3,000
- Reserves months
- —
- Total cash needed
- —
Loan-product check · same deal, 3 products live
Conventional
25% down · 7.5% · 30yr
- Down + closing
- —
- Monthly P&I
- —
- Monthly cashflow
- —
- DSCR
- —
- Eligible?
- —
Personal DTI + credit; lowest rate.
DSCR
20% down · 8.5% · 30yr
- Down + closing
- —
- Monthly P&I
- —
- Monthly cashflow
- —
- DSCR
- —
- Eligible?
- —
No personal income docs; deal must DSCR.
Hard money
10% down · 12.0% · 12mo
- Down + closing
- —
- Monthly P&I
- —
- Monthly cashflow
- —
- DSCR
- —
- Eligible?
- —
Short-term bridge; refi at stabilization.
Rent comps 25 comps
| Address | Beds | Baths | Sqft | Rent | $/sqft | DOM | Units | Dist |
|---|---|---|---|---|---|---|---|---|
| 10 Jewett Pkwy Buffalo, NY | 2.0 | 1.0 | 525 | $1,210 | $2.30 | 44d | 1 | 0.23mi |
| 2532 Main St Apt 7 Buffalo, NY | 2.0 | 1.0 | 850 | $1,300 | $1.53 | 44d | 1 | 0.38mi |
| 2075 Main St Buffalo, NY | 1.0–2.0 | 1.0 | 594 | $1,400 | $2.36 | 44d | 2 | 0.60mi |
| 117 Humboldt Pkwy Unit B Buffalo, NY | 2.0 | 1.0 | 840 | $1,850 | $2.20 | 44d | 1 | 0.61mi |
| 117 Humboldt Pkwy Unit A Buffalo, NY | 3.0 | 1.0 | 1105 | $2,300 | $2.08 | 44d | 1 | 0.61mi |
| 2 Agassiz Cir Unit A Buffalo, NY | 2.0 | 1.0 | 1076 | $2,150 | $2.00 | 24d | 1 | 0.66mi |
| 2 Agassiz Cir Unit B Buffalo, NY | 2.0 | 1.0 | 983 | $2,050 | $2.09 | 24d | 1 | 0.66mi |
| 190 Manhattan Ave Buffalo, NY | 2.0 | 1.0 | 724 | $1,200 | $1.66 | 44d | 1 | 0.78mi |
| 90 Sussex St Unit 2 Buffalo, NY | 2.0 | 1.0 | 1000 | $1,000 | $1.00 | 44d | 1 | 0.88mi |
| 2939 Main St Buffalo, NY | 1.0–2.0 | 1.0–2.0 | 562 | $1,999 | $3.55 | 3d | 1 | 1.07mi |
| 104 Butler Ave Buffalo, NY | 3.0 | 1.0 | 1000 | $1,400 | $1.40 | 44d | 1 | 1.12mi |
| 140 Parkridge Ave Buffalo, NY | 3.0 | 1.0 | 990 | $1,500 | $1.52 | 44d | 1 | 1.12mi |
| 1786 Main St Unit 103 Buffalo, NY | 2.0 | 1.5 | 1110 | $1,677 | $1.51 | 44d | 1 | 1.15mi |
| 89 Lasalle Ave Buffalo, NY | 1.0–4.0 | 1.0–4.0 | 1024 | $2,291 | $2.24 | 2d | 10 | 1.17mi |
| 92 Lasalle Ave Unit 1 Buffalo, NY | 2.0 | 1.0 | 1000 | $1,150 | $1.15 | 44d | 1 | 1.27mi |
| 408 Winslow Ave Unit 2 Buffalo, NY | 3.0 | 1.0 | 1000 | $1,050 | $1.05 | 14d | 1 | 1.31mi |
| 238 Oxford Ave Unit Upper Buffalo, NY | 3.0 | 1.0 | 1100 | $1,600 | $1.45 | 24d | 1 | 1.32mi |
| 1958 Delaware Ave Unit 6 Buffalo, NY | 2.0 | 1.0 | 725 | $1,250 | $1.72 | 44d | 1 | 1.35mi |
| 1982 Delaware Ave Unit 5 Buffalo, NY | 2.0 | 1.0 | 725 | $1,250 | $1.72 | 44d | 1 | 1.37mi |
| 1560 Delaware Ave Unit 1 Buffalo, NY | 3.0 | 1.0 | 1000 | $2,800 | $2.80 | 24d | 1 | 1.37mi |
| 40 Lisbon Ave Unit Upper Buffalo, NY | 2.0 | 1.0 | 1057 | $1,500 | $1.42 | 11d | 1 | 1.38mi |
| 2002 Delaware Ave Unit 4 Buffalo, NY | 2.0 | 1.0 | 725 | $1,250 | $1.72 | 44d | 1 | 1.40mi |
| 2022 Delaware Ave Unit 5 Buffalo, NY | 2.0 | 1.0 | 725 | $1,250 | $1.72 | 44d | 1 | 1.40mi |
| 26 Custer St Buffalo, NY | 2.0 | 1.0 | 1000 | $1,300 | $1.30 | 44d | 1 | 1.42mi |
| 76 Chester St Unit 1 Buffalo, NY | 3.0 | 1.0 | 1100 | $1,000 | $0.91 | 14d | 1 | 1.47mi |
Listing history 16 events
-
2026-06-18days on market $99,999 Active 41 DOM
-
2026-06-17days on market $99,999 Active 40 DOM
-
2026-06-16days on market $99,999 Active 39 DOM
-
2026-06-15days on market $99,999 Active 38 DOM
-
2026-06-13days on market $99,999 Active 36 DOM
-
2026-06-13days on market $99,999 Active 35 DOM
-
2026-06-10days on market $99,999 Active 33 DOM
-
2026-06-09days on market $99,999 Active 32 DOM
-
2026-06-08days on market $99,999 Active 31 DOM
-
2026-06-07days on market $99,999 Active 30 DOM
-
2026-06-03days on market $99,999 Active 26 DOM
-
2026-06-02days on market $99,999 Active 25 DOM
-
2026-06-01days on market $99,999 Active 24 DOM
-
2026-05-31days on market $99,999 Active 23 DOM
-
2026-05-08$124,999 Active 722-char remark
-
1995-10-25soldstatus $17,000
ⓘ Source: listings_history table (triggers on properties + properties_extension) + one-shot
backfill from property_details.listing_events for pre-trigger history.
Tax reassessment forecast NY · Partial reset (capped growth)
- Current annual tax
- $400 · $33/mo
- Projected year-2 tax
- $1,045 · $87/mo
- Expected delta
- +$645/yr (+$54/mo · 161.5%)
ⓘ Screening estimate from a state-policy table — verify with the county assessor before closing.
Climate risk First Street
- Flood 1/10 Low FEMA zone X (unshaded) · 0% chance over 30 yrs
- Wildfire 1/10 Low
- Heat 3/10 Moderate 7 d/yr ≥93°F today · 15 d/yr by 30 yrs out
- Wind 1/10 Low
- Air quality 3/10 Moderate 2 unhealthy d/yr today · 3 by 30 yrs out
Nearby sold comps map
Loading sold comps map…
Walkable amenities ~0.75 mi
Loading nearby amenities…
Taxation est. · year 1
- Rental income
- $19,469
- − Mortgage interest
- −$5,601
- − Property taxes
- −$400
- − Insurance
- −$500
- − Repairs & maintenance
- −$1,558
- − Management
- −$1,558
- − Depreciation
- −$2,909
- Taxable income
- $6,944
- Est. tax owed @ 24.0%
- −$1,667
- After-tax cash flow
- $6,522/yr
For passive investors: Depreciation is non-cash, so a rental often shows a tax loss while cash-flowing — sheltering income. Rental losses are passive: they offset passive income freely, and up to $25,000/yr can offset ordinary (W-2) income if you actively participate and your MAGI is under $100k (phasing out to $0 by $150k); unused losses carry forward. On sale, claimed depreciation is recaptured at up to 25%, and gains may owe capital-gains tax (a 1031 exchange can defer both). Figures are a year-1 estimate at your 24.0% rate — not tax advice; consult a CPA.
Schools (NCES district)
- District
- Buffalo City School District
- NCES district ID
- 3605850
- Math proficiency
- 41% ▲ 11.00%
- Reading proficiency
- 40% ▲ 7.00%
- Median HH income
- $31,665
- Composite
- 33.17/100
- National rank
- #5544
- State rank
- #535 of 590 in NY
Livability — Buffalo
- Score
- 77/100
- State rank
- #195
- US rank
- #3011
Category grades
Schools grade is shown separately in the Schools card above.
Census & demographics
- Census place
- Buffalo, NY
- County
- Erie County · 714,559 people
- City population
- 440,021
- Metro
- Buffalo-Cheektowaga, NY
- Population (ZIP)
- 21,314
- Household income
- $58,228
- Rent vs Own
- Severe rent burden
- 1820.0
Population outlook (Erie County) Hauer SSP2
- Today (2025)
- 933,037 people
- By 2030
- 935,181 · +0.2%
- By 2040
- 928,531 · -0.5%
- By 2050
- 905,725 · -2.9%
- By 2075
- 834,037 · -10.6%
- By 2100
- 708,033 · -24.1%
Race, ethnicity, and origin ACS 2023
- Neighborhood character
- Diverse neighborhood (Simpson 0.67)
- Race & ethnicity
- White 47% Black 31% Asian 11% Hispanic / Latino 7% Two or more races 6%
- Hispanic origin (detail)
- Puerto Rican 3%
- Common ancestry
- Romanian 5% Lithuanian 2% Scotch-Irish 1%
- Foreign-born
- 14% · Canada, China
- Languages at home
- 81% English-only · Other Indo-European 7% Spanish 4% Other Asian/Pacific 1%
Political lean MEDSL · Erie
- 2024 margin
- Lean D (+9.7) · D 54.8% · R 45.2%
- 2008→2024 swing
- -7.9pp toward R · 2008: 17.5pp · 2024: 9.7pp
- All cycles
- 2024: D+9.7 2020: D+14.7 2016: D+4.8 2012: D+15.6 2008: D+17.5
Not yet ingested
- Civics
- —
Market trends
- HPI YoY
- ▼ -282.52%
- Current HPI
- 373.377
- Rent YoY
- ▲ 5.81%
- Metro
- Buffalo-Cheektowaga, NY
- State GDP YoY
- ▲ 2.60%
- F500 in state
- 92
Industry mix (Fortune 500 HQ in NY)
| Industry | F500 HQs | Revenue |
|---|---|---|
| Financial Services | 10 | $950B |
|
||
| Consumer Goods | 9 | $162B |
|
||
| Insurance | 4 | $225B |
|
||
| Telecommunications | 2 | $144B |
|
||
| Pharmaceuticals | 2 | $112B |
|
||
| Media / Entertainment | 2 | $69B |
|
||
Price history
+488.2% since first listed3 events — show timeline
- 2026-05-27 Price Changed $99,999 WNYREIS
- 2026-05-08 Listed $124,999 WNYREIS
- 1995-10-25 Sold (Public Records) $17,000 Public Records
Property tax history
+5.6%/yrLatest (2025): $400 · +22.9% YoY. Source: county tax records.
Cash-flow waterfall
monthlySold comps — $/sqft
last 12 mo · ≤1 miLoading sold comps…