 Multi-family
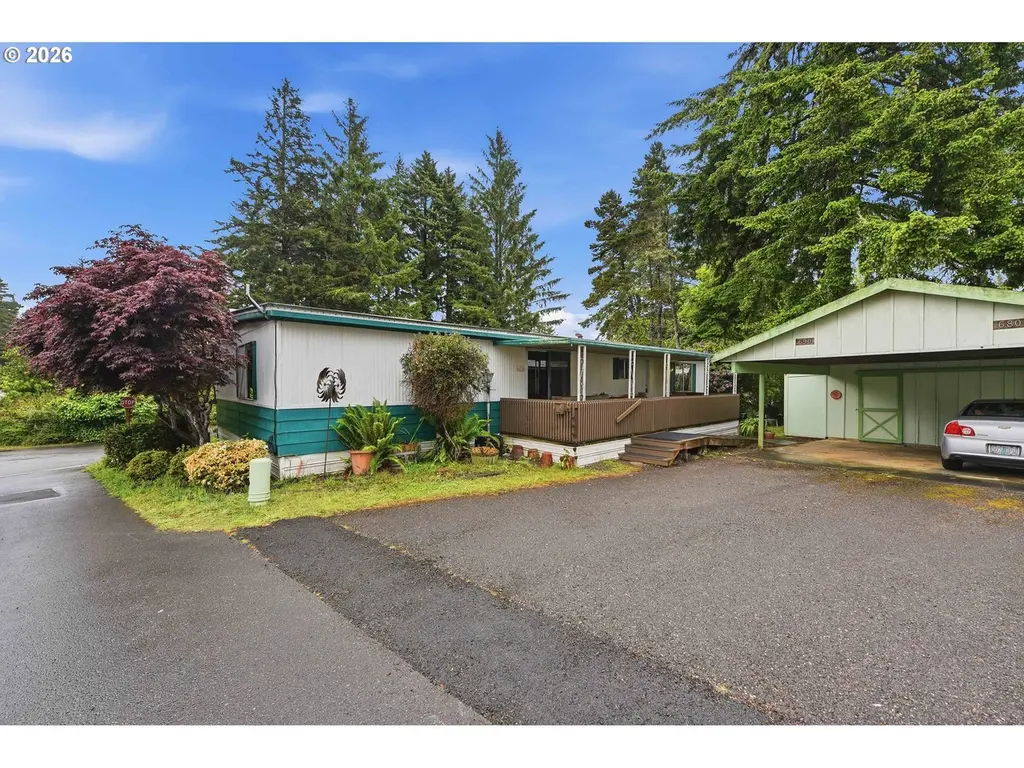
690 Village Pines Dr · Coos Bay, OR
Flood risk 1/10 · Minimal
- FEMA flood zone
- X (unshaded)
- Chance of flooding over 30 yrs
- 0.0%
- Est. flood insurance / yr
- $507 – $1,088
Fire risk 1/10 · Minimal
- Est. fire insurance / yr
- $498 – $926
Heat risk 1/10 · Minimal
- Hot days now (above 76°F)
- 7 days/yr
- Hot days in 30 yrs
- 20 days/yr
Wind risk 1/10 · Minimal
- Chance of severe wind over 30 yrs
- —
Air-quality risk 6/10 · Moderate
- Unhealthy air days now
- 9 days/yr
- Unhealthy air days in 30 yrs
- 9 days/yr
Risk factors via First Street. Map © Google.
Why this score? — see what drove the C+ grade
The composite is a weighted blend of 9 inputs, each scored 0–100. Each bar is that input's sub-score; the figure is the points it added to the 100-point composite (weight × sub-score).
- Cash flow +30.0/30.0
- 1% rule +10.0/10.0
- DSCR +10.0/10.0
- Rent growth +4.7/5.0
- Livability +3.1/5.0
- Schools +2.5/10.0
- Condition / age +2.5/5.0
- ARV discount +2.1/15.0
- Appreciation +0.0/10.0
$147,500
🖨 Deal sheet 📄 Offer letter ✓ Due diligence
Multi-family units
County records classify this as Multi-Family (2-4 Unit). Listing-text estimate: 1 unit. estimate disagrees with records
Listing remarks MLS
Great Shape for this years model in 55+ park. Next to pond with wildlife. Transaction Subject to Park Approval.
Key facts
- Covered deck
- Recent updates
- New carpet
Tags
Property features AI
Finance
- Other: Home ID / VIN information available; Land lease not reported
- Financial info: Tax year 2025
- HOA & community: Manufactured home park with monthly lot rent ($635); Not a senior community
Exterior
- Parking: Detached carport; Driveway parking; 1 parking space/carport
- Security: No security features listed
- Utilities: Electric water heater; Public water; Public sewer; Electric power
- Home design: Manufactured home in a park (residential); Not attached; Resale condition; Main living area approximately 1,344; Manufacturer: Sierra; Built in 1974; Skirting foundation; No land included (lot in park; monthly lot rent $635)
- Construction: Metal roof; Aluminum exterior; Skirting foundation; Year built 1974
- Exterior features: Metal roof; Covered deck; Porch; Tool shed; Aluminum exterior; Level site; Paved road access; Views of a pond, territorial views, and trees/woods
Interior
- Kitchen: Built-in oven; Cooktop; Free-standing refrigerator; Kitchen island; Pantry
- Bedrooms: Primary bedroom (Main level); Second bedroom (Main level)
- Flooring: Vinyl; Carpet
- Bathrooms: 2 full bathrooms (both on the main level)
- Heating & cooling: Heat pump for heating and cooling
- Interior features: Vinyl flooring; Wall-to-wall carpet; Pellet stove fireplace; Aluminum window frames with double-pane windows; Crawl space
- Laundry & utility: Main level laundry
Neighborhood map
What this means for you Summary
Snapshot
- This is a 2-bed/2.0-bath multifamily listed at $148k.
Deal economics
- At list price, monthly cash flow is $2k ($19k/yr) — positive.
- The deal already cash-flows at list — no discount required.
- Meets the 1% rule at list price ($3k rent vs $148k).
- Recommended offer: $145k (1.5% below list) — sets the bar for market timing.
- Cap rate 18.9% vs local median 4.2% in Coos Bay — top-decile yield for the area; either an underpriced asset or a hidden risk that comps aren't pricing in. Stress-test before assuming the spread holds.
Location & tenants
- Location reads 61/100 on livability (#257 in OR) — a middle-class / working-renter tenant base. Strengths: housing A+, health & safety A+, cost of living A; Watch: crime F, amenities F, commute F.
- Coos Bay SD 9 (town): math 22% / reading 39% proficiency, ranked #45 of 58 in OR (top 78%) — families likely to look elsewhere, expect single-tenant / working-renter base with shorter leases.
- Zoned schools: Madison Elementary School (295 students, 69% FRL); Marshfield Senior High School (math 17% / reading 54%, grade F, #89 of 143 statewide, top 62%, 835 students, 31% FRL) — zoned schools at 50% FRL track the district average.
- Market conditions: Rents rising fast (+8.7%/yr); 342 active listings in the ZIP; 6 comparable units currently listed for rent nearby; rentals lingering (median 44d on market — plan ~5-8 weeks vacancy on turnover, expect pricing pressure); 100% of comp listings sitting > 30 days — soft ceiling on asking rent; 122 units permitted in Coos County in 2024 (16 in 5+ unit buildings).
- At $3,076/mo this rent would consume 60% of the median local household income ($62k/yr) (locally 799% of renters already pay >50% of income on rent) — very limited rent-growth headroom before tenants either downsize or default.
Forward outlook
- Local home prices are declining (-3.0%/yr); year-one equity from $1k of loan paydown is wiped out by about $4k of value loss. Plan a longer hold.
- Coos County population projected to shrink 9% by 2050 — rents likely to lag national; underwrite the cash flow, not the appreciation.
- At projected returns (-3.0% appreciation + 8.0% rent growth), your $41k cash investment doubles in ~3 years — after that, you're playing with house money.
Negotiation context
- It's been on market 18 days — a 2% lower offer ($145k) is reasonable based on typical stale-listing flexibility.
- 2 sale attempts since 17y ago; this cycle's ask has dropped $11k (7%) from the opening price — seller is motivated, your offer sets the floor, not the list.
- Current owner paid $25k; list at $148k implies a 490% gain — meaningful room to come down on a strong offer.
Questions for the listing agent
- Built in 1974 — when were the roof, HVAC, electrical panel, plumbing, and water heater last replaced?
- Is there a deadline driving the sale (1031 exchange, divorce, estate, relocation)? That informs how much negotiation room exists.
- Schools are D-rated, which usually means shorter tenancies and higher turnover. Who's the typical renter profile here, and what's been the actual vacancy rate?
- Crime grade is F in this area — have there been break-ins, vandalism, or insurance claims at this property in the last 3 years? What carrier currently insures it and at what premium?
- What's the average days-on-market for RENTAL listings here right now (not sales)? A rising rental-DOM trend means longer vacancies and softer asking-rent achievability than the comps imply.
- What's the recent tenant-quality profile in this submarket — average credit score on applications, eviction rate, late-payment / NSF rate, and stable-employment percentage? A property-management company in the area should have these aggregated.
- How much new apartment / multifamily construction is in the pipeline within 1–3 miles? Heavy new supply (>2% of stock underway) typically softens rents 12–24 months out; light construction supports rent growth.
Investment metrics
- 1% rule
- 2.09% ✓
- Cap rate
- 18.90%
- Cash-on-cash
- 45.01%
- DSCR
- 3.00
- GRM
- 4.0
CMA / ARV
- ARV (on-the-fly)
- $131,712
- Comps found
- 1
Show comp detail 1 sale within ~0.75 mi
| Address | Dist | Beds/Ba | Sqft | Sold | Price | $/sf | Match |
|---|---|---|---|---|---|---|---|
| 1626 Lund Ave | 0.32mi | 3/2.0 (+1) | 1,176 (-12%) | 21mo | $115,000 | $98 | 41 |
Match score weights: distance 35% · size 25% · config 20% · recency 20%. Top-matched comps best support the ARV.
Projected returns pro-forma
-3.0% appreciation · 8.0% rent growth · sell at horizon
- IRR
- 47.4%
- Equity multiple
- 3.20×
- Total profit
- $90,988
- Equity at exit
- $21,993
- IRR
- 55.1%
- Equity multiple
- 7.78×
- Total profit
- $280,118
- Equity at exit
- $12,753
Cash invested: $41,300 (down + closing). Projections, not guarantees.
Landlord ↔ Tenant lean methodology
- Overall (STATE)
- 28 Tenant-Leaning
- State Oregon
- 28 Tenant-Leaning · D+6
- County
- — inherits STATE
- City
- — inherits STATE
ZIP-level market 97420
- Rents YoY
- 8.7%
- Active inventory
- 342
- Price-to-rent
- 8.0×
Monthly cashflow live
- Estimated rent
- $3,076 medium interval (Pro) →
- Mortgage (P&I)
- −$774
- Tax from tax record
- −$46 /mo · $550/yr
- Insurance
- −$61
- HOA
- −$0
- Vacancy / Maint / Mgmt
- −$646
- Net cashflow
- $1,549
Break-even live
2-unit breakdown (identical units grouped — click to expand)
| Units | Beds | Baths | Est. rent |
|---|---|---|---|
| 2× units | 2 | 2 | $3,076 |
| #1 | 2 | 2 | $1,538 |
| #2 | 2 | 2 | $1,538 |
| Total (2 units) | $3,076 | ||
UW: 25.0% down · 7.5% · 30yr · 1.5% tax · 5.0% vac · 8.0% maint · 8.0% mgmt
Financing live
Cash to close
- Down payment
- $36,875
- Closing costs
- $4,425
- Reserves months
- —
- Total cash needed
- —
Loan-product check · same deal, 3 products live
Conventional
25% down · 7.5% · 30yr
- Down + closing
- —
- Monthly P&I
- —
- Monthly cashflow
- —
- DSCR
- —
- Eligible?
- —
Personal DTI + credit; lowest rate.
DSCR
20% down · 8.5% · 30yr
- Down + closing
- —
- Monthly P&I
- —
- Monthly cashflow
- —
- DSCR
- —
- Eligible?
- —
No personal income docs; deal must DSCR.
Hard money
10% down · 12.0% · 12mo
- Down + closing
- —
- Monthly P&I
- —
- Monthly cashflow
- —
- DSCR
- —
- Eligible?
- —
Short-term bridge; refi at stabilization.
Rent comps 6 comps
| Address | Beds | Baths | Sqft | Rent | $/sqft | DOM | Units | Dist |
|---|---|---|---|---|---|---|---|---|
| 151 Norman Ave Unit 02 Coos Bay, OR | 2.0 | 1.0 | 1000 | $1,300 | $1.30 | 43d | 1 | 0.40mi |
| 971 Inlet Loop Coos Bay, OR | 3.0 | 3.0 | 1792 | $3,150 | $1.76 | 43d | 1 | 0.46mi |
| 949 Blanco Ave Coos Bay, OR | 3.0 | 2.0 | 1100 | $2,500 | $2.27 | 43d | 1 | 0.52mi |
| 267 Ackerman Ave Unit 277 Coos Bay, OR | 2.0 | 1.0 | 904 | $1,550 | $1.71 | 43d | 1 | 0.60mi |
| 239 N Wasson St Unit 7 Coos Bay, OR | 2.0 | 1.0 | 900 | $1,400 | $1.56 | 43d | 1 | 0.84mi |
| 455 N Cammann St Coos Bay, OR | 3.0 | 1.0 | 1060 | $2,000 | $1.89 | 43d | 1 | 0.89mi |
Listing history 16 events
-
2026-06-19days on market $147,500 Active 18 DOM
-
2026-06-18days on market $147,500 Active 17 DOM
-
2026-06-17days on market $147,500 Active 16 DOM
-
2026-06-16days on market $147,500 Active 15 DOM
-
2026-06-15days on market $147,500 Active 14 DOM
-
2026-06-14days on market $147,500 Active 12 DOM
-
2026-06-12days on market $147,500 Active 11 DOM
-
2026-06-09days on market $147,500 Active 8 DOM
-
2026-06-09price $147,500 Active 7 DOM
-
2026-06-08days on market $158,500 Active 7 DOM
-
2026-06-07days on market $158,500 Active 6 DOM
-
2026-06-07remarks 577-char remark
-
2026-06-07days on market $158,500 Active 5 DOM
-
2026-06-03days on market $158,500 Active 2 DOM
-
2026-06-02remarks 556-char remark
-
2026-06-02$158,500 Active 1 DOM
ⓘ Source: listings_history table (triggers on properties + properties_extension) + one-shot
backfill from property_details.listing_events for pre-trigger history.
Tax reassessment forecast OR · Resets to sale price
- Current annual tax
- $550 · $46/mo
- Projected year-2 tax
- $1,431 · $119/mo
- Expected delta
- +$881/yr (+$73/mo · 160.2%)
ⓘ Screening estimate from a state-policy table — verify with the county assessor before closing.
Climate risk First Street
- Flood 1/10 Low FEMA zone X (unshaded) · 0% chance over 30 yrs
- Wildfire 1/10 Low
- Heat 1/10 Low 7 d/yr ≥76°F today · 20 d/yr by 30 yrs out
- Wind 1/10 Low
- Air quality 6/10 Major 9 unhealthy d/yr today · 9 by 30 yrs out
Nearby sold comps map
Loading sold comps map…
Walkable amenities ~0.75 mi
Loading nearby amenities…
Taxation est. · year 1
- Rental income
- $36,912
- − Mortgage interest
- −$8,262
- − Property taxes
- −$550
- − Insurance
- −$738
- − Repairs & maintenance
- −$2,953
- − Management
- −$2,953
- − Depreciation
- −$4,291
- Taxable income
- $17,165
- Est. tax owed @ 24.0%
- −$4,120
- After-tax cash flow
- $14,471/yr
For passive investors: Depreciation is non-cash, so a rental often shows a tax loss while cash-flowing — sheltering income. Rental losses are passive: they offset passive income freely, and up to $25,000/yr can offset ordinary (W-2) income if you actively participate and your MAGI is under $100k (phasing out to $0 by $150k); unused losses carry forward. On sale, claimed depreciation is recaptured at up to 25%, and gains may owe capital-gains tax (a 1031 exchange can defer both). Figures are a year-1 estimate at your 24.0% rate — not tax advice; consult a CPA.
Schools (NCES district)
- District
- Coos Bay SD 9
- NCES district ID
- 4103660
- Math proficiency
- 22% ▼ -6.00%
- Reading proficiency
- 39% ▼ -4.00%
- Median HH income
- $38,630
- Composite
- 25.46/100
- National rank
- #7450
- State rank
- #45 of 58 in OR
Livability — Coos Bay
- Score
- 61/100
- State rank
- #257
- US rank
- #17474
Category grades
Schools grade is shown separately in the Schools card above.
Census & demographics
- Census place
- Coos Bay, OR
- County
- Coos County · 27,621 people
- City population
- 27,621
- Metro
- Coos Bay, OR
- Population (ZIP)
- 27,621
- Household income
- $61,574
- Rent vs Own
- Severe rent burden
- 799.0
Population outlook (Coos County) Hauer SSP2
- Today (2025)
- 62,222 people
- By 2030
- 61,120 · -1.8%
- By 2040
- 58,478 · -6.0%
- By 2050
- 56,819 · -8.7%
- By 2075
- 54,915 · -11.7%
- By 2100
- 51,403 · -17.4%
Race, ethnicity, and origin ACS 2023
- Neighborhood character
- Predominantly White (81%)
- Race & ethnicity
- White 81% Hispanic / Latino 10% Two or more races 8% Native American 2% Asian 1%
- Hispanic origin (detail)
- Mexican 7%
- Common ancestry
- Italian 5% Slovak 3% Lithuanian 3%
- Foreign-born
- 5% · Canada, Vietnam
- Languages at home
- 92% English-only · Spanish 6%
Political lean MEDSL · Coos
- 2024 margin
- R (+19.9) · D 38.7% · R 58.5% · Other 2.8%
- 2008→2024 swing
- -16.8pp toward R · 2008: -3.1pp · 2024: -19.9pp
- All cycles
- 2024: R+19.9 2020: R+20.5 2016: R+24.3 2012: R+6.3 2008: R+3.1
Not yet ingested
- Civics
- —
Market trends
- HPI YoY
- ▼ -315.58%
- Current HPI
- 198.3249
- Rent YoY
- ▲ 8.65%
- Metro
- Coos Bay, OR
- State GDP YoY
- ▲ 2.05%
- F500 in state
- 2
Industry mix (Fortune 500 HQ in OR)
| Industry | F500 HQs | Revenue |
|---|---|---|
| Consumer Goods | 1 | $51B |
|
||
Price history
+399.3% since first listed15 events — show timeline
- 2026-06-01 Listed $158,500 RMLS
- 2009-09-16 Sold (MLS) $25,000 RMLS
- 2009-09-09 Delisted — RMLS
- 2009-07-14 Listed $25,000 RMLS
- 2000-01-17 Sold (Public Records) $9,733 Public Records
- 1999-08-21 Sold (Public Records) $39,000 Public Records
- 1999-06-04 Sold (Public Records) $16,000 Public Records
- 1999-06-01 Sold (Public Records) $28,000 Public Records
- 1998-10-15 Sold (Public Records) $17,500 Public Records
- 1998-09-22 Sold (Public Records) $39,000 Public Records
- 1998-06-17 Sold (Public Records) $33,000 Public Records
- 1998-04-27 Sold (Public Records) $40,000 Public Records
- 1998-03-12 Sold (Public Records) $8,000 Public Records
- 1998-03-01 Sold (Public Records) $36,900 Public Records
- 1997-12-03 Sold (Public Records) $31,742 Public Records
Property tax history
+3.9%/yrLatest (2025): $550 · +1.5% YoY. Source: county tax records.
Cash-flow waterfall
monthlySold comps — $/sqft
last 12 mo · ≤1 miLoading sold comps…