 🏷️ Likely Rental
7031 NE 175th St #5 · Kenmore, WA
Flood risk 10/10 · Severe
- FEMA flood zone
- X (unshaded)
- Chance of flooding over 30 yrs
- 0.99%
- Est. flood insurance / yr
- $507 – $1,088
Fire risk 1/10 · Minimal
- Est. fire insurance / yr
- $604 – $1,122
Heat risk 3/10 · Minor
- Hot days now (above 86°F)
- 7 days/yr
- Hot days in 30 yrs
- 16 days/yr
Wind risk 1/10 · Minimal
- Chance of severe wind over 30 yrs
- —
Air-quality risk 6/10 · Moderate
- Unhealthy air days now
- 9 days/yr
- Unhealthy air days in 30 yrs
- 9 days/yr
Risk factors via First Street. Map © Google.
Why this score? — see what drove the C grade
The composite is a weighted blend of 9 inputs, each scored 0–100. Each bar is that input's sub-score; the figure is the points it added to the 100-point composite (weight × sub-score).
- Cash flow +15.0/30.0
- ARV discount +15.0/15.0
- Schools +6.7/10.0
- 1% rule +5.0/10.0
- DSCR +5.0/10.0
- Livability +4.3/5.0
- Rent growth +3.0/5.0
- Condition / age +2.5/5.0
- Appreciation +0.0/10.0
$44,950
🖨 Deal sheet (PDF) 📄 Offer letter ✓ Due diligence
Listing remarks
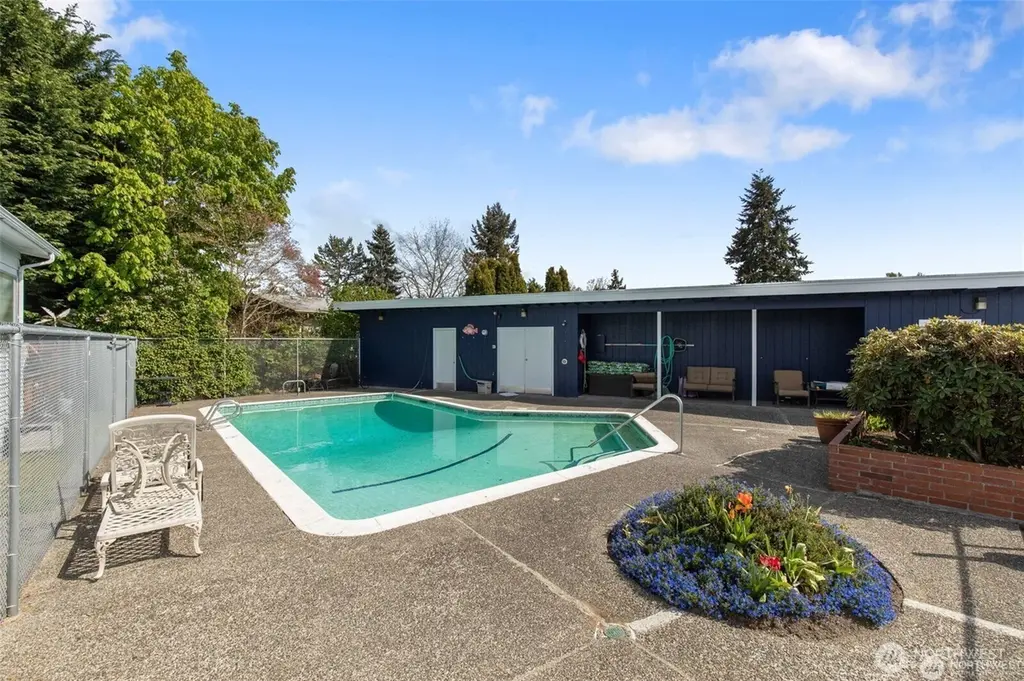
Knock! Knock! Affordable Kenmore living offering a functional floor plan, a 2-bedroom 1.5 baths home in Lakewood Villa MH 55+ Park, a quiet and convenient community. Ideal for buyers seeking an affordable homeownership alternative in the Northshore area. Walk-in shower, stacked washer and dryer, forced air heating and a wood stove, A/C, generator at the flip of a switch, and a large shed for your hobbies, storage, or side hustle. Covered front porch, extra parking, and patio. Lots of extra storage. Bring your vision and a little tlc to make it your own. Low space rent at $1013/month. A compelling opportunity for downsizers and investors alike. Updated Community Clubhouse and pool. Pets are
Key facts
- Covered front porch
- A/c
- Large shed
Tags
Property features AI
Finance
- Other: Manufactured home approved for sale in the park; Senior exemption applies
- Financial info: Accepted listing terms: Cash, Conventional; Land lease amount: $1,013 (monthly)
- HOA & community: Located in a senior community (Lakewood Villa); Park amenities include BBQs, clubhouse, common area, community waterfront, laundry, and pool; Approximately 50 homes in the park; Land lease in park (monthly)
Exterior
- Parking: Uncovered parking; 3 open parking spaces
- Utilities: Public water; Public sewer; Electric service (Puget Sound Energy); Energy sources: Electric and wood
- Home design: Manufactured single-wide home; One level; Faces east; Fixer condition; Model: Homet 66/14; Mobile home remains in place
- Construction: Metal roof; Metal/vinyl construction materials; Tie-down foundation
- Exterior features: Metal/vinyl exterior; Patio/porch/deck
Interior
- Kitchen: Dishwasher; Refrigerator; Stove/Range
- Bedrooms: 2 bedrooms
- Flooring: Laminate; Vinyl; Carpet
- Bathrooms: One three-quarter bathroom; One half bathroom; One shower
- Heating & cooling: Forced air heating; Window air conditioning unit(s)
- Interior features: Wood-burning fireplace; Water heater (electric)
- Laundry & utility: Washer; Dryer; Water heater located in closet
Neighborhood map
What this means for you Summary
Snapshot
- This is a 2-bed/1.5-bath manufactured listed at $45k. Condition is rated fair.
Deal economics
- At list price, monthly cash flow is $1k ($16k/yr) — positive.
- The deal already cash-flows at list — no discount required.
- Meets the 1% rule at list price ($2k rent vs $45k).
- Cap rate 44.1% vs local median 1.6% in Kenmore — top-decile yield for the area; either an underpriced asset or a hidden risk that comps aren't pricing in. Stress-test before assuming the spread holds.
Location & tenants
- Location reads 86/100 on livability (#21 in WA, #427 nationally) — a professional / high-income tenant draw. Strengths: crime A+, amenities A+, commute A+; Watch: cost of living F.
- Northshore School District (suburban): math 69% / reading 78% proficiency, ranked #9 of 291 in WA (top 3%) — strong family-tenant draw, lease renewals of 3-5y typical; only 12% free/reduced lunch — higher-income household profile.
- Zoned schools: Kenmore Elementary (424 students, 44% FRL); Inglemoor Hs (1,542 students, 20% FRL) — zoned schools average 32% FRL vs 12% district-wide (20 pts higher); higher-poverty schools than district average — tighter screening recommended.
- Market conditions: Rents rising (+2.1%/yr); 193 active listings in the ZIP; 15 comparable units currently listed for rent nearby; rentals leasing fast (median 4d on market — plan ~1-2 weeks tenant-placement turnaround); high-income renter base; 10,555 units permitted in King County in 2024 (7,119 in 5+ unit buildings).
Forward outlook
- Local home prices are declining (-3.0%/yr); year-one equity from $310 of loan paydown is wiped out by about $1k of value loss. Plan a longer hold.
- King County population projected at +44% by 2050 — long-run rental-demand tailwind backs the buy-and-hold thesis.
- At projected returns (-3.0% appreciation + 2.1% rent growth), your $13k cash investment doubles in ~1 year — after that, you're playing with house money.
Negotiation context
- Only 12 days on market — expect competitive offers; lowballing is unlikely to land.
- 3 sale attempts since 4y ago with the ask held roughly flat each time — persistent listings suggest the price (not the market) is what's stuck; bring a comps-based counter.
Risks & watch-outs
- Watch-outs: flood insurance adds $66/mo.
- Climate carrying-cost: severe flood risk — expect insurance premiums to compound above CPI over the hold.
Questions for the listing agent
- Have any recent inspections been done? Can we get a copy of the seller's disclosures and any deferred-maintenance estimates?
- What's the actual annual flood-insurance premium (NFIP or private), and is the property in a SFHA with mandatory coverage?
- Is there a deadline driving the sale (1031 exchange, divorce, estate, relocation)? That informs how much negotiation room exists.
- Schools are A-rated — typically a magnet for longer-tenancy family renters. What's the average tenant stay here, and is there a school-zone premium baked into asking?
- What's the average days-on-market for RENTAL listings here right now (not sales)? A rising rental-DOM trend means longer vacancies and softer asking-rent achievability than the comps imply.
- What's the recent tenant-quality profile in this submarket — average credit score on applications, eviction rate, late-payment / NSF rate, and stable-employment percentage? A property-management company in the area should have these aggregated.
- How much new for-sale + rental construction is in the pipeline within 1–3 miles? Heavy new supply typically softens prices + rents 12–24 months out; constrained supply supports both.
Investment metrics
- 1% rule
- 4.87% ✓
- Cap rate
- 44.14%
- Cash-on-cash
- 135.17%
- DSCR
- 7.01
- GRM
- 1.7
CMA / ARV
- ARV (median comp)
- $81,873
- List price
- $44,950
- Delta
- -40.15%
- Verdict
- UNDERPRICED
- Comps
- 20 within 1.0 mi
Show comp detail 2 sales within ~0.75 mi
| Address | Dist | Beds/Ba | Sqft | Sold | Price | $/sf | Match |
|---|---|---|---|---|---|---|---|
| 7031 NE 175th St #33 | 0.00mi | 2/1.0 | 860 (-7%) | 7mo | $78,000 | $91 | 81 |
| 7614 NE Bothell Way #14 | 0.35mi | 2/1.5 | 980 (+6%) | 17mo | $140,000 | $143 | 60 |
Match score weights: distance 35% · size 25% · config 20% · recency 20%. Top-matched comps best support the ARV.
Projected returns pro-forma
-3.0% appreciation · 2.09% rent growth · sell at horizon
- IRR
- —
- Equity multiple
- 7.11×
- Total profit
- $76,864
- Equity at exit
- $6,702
- IRR
- —
- Equity multiple
- 14.51×
- Total profit
- $170,048
- Equity at exit
- $3,886
Cash invested: $12,586 (down + closing). Projections, not guarantees.
Landlord ↔ Tenant lean methodology
- Overall (STATE)
- 28 Tenant-Leaning
- State Washington
- 28 Tenant-Leaning · D+8
- County
- — inherits STATE
- City
- — inherits STATE
ZIP-level market 98028
- Rents YoY
- 2.1%
- Active inventory
- 193
- Price-to-rent
- 1.7×
Monthly cashflow live
- Estimated rent
- $2,188 high interval (Pro) →
- Mortgage (P&I)
- −$236
- Tax est. 1.5%
- −$56 /mo · $674/yr
- Insurance
- −$19
- Flood insurance flood zone
- −$66 /mo · $798/yr
- HOA
- −$0
- Vacancy / Maint / Mgmt
- −$459
- Net cashflow
- $1,351
Break-even live
Sensitivity live
| Price | -10% $1,382 | -5% $1,367 | +0% $1,351 | +5% $1,336 | +10% $1,320 |
|---|---|---|---|---|---|
| Rent | -10% $1,178 | -5% $1,265 | +0% $1,351 | +5% $1,438 | +10% $1,524 |
| Rate | -1.0pp $1,374 | -0.5pp $1,363 | base $1,351 | +0.5pp $1,340 | +1.0pp $1,328 |
UW: 25.0% down · 7.5% · 30yr · 1.5% tax · 5.0% vac · 8.0% maint · 8.0% mgmt
Financing live
Cash to close
- Down payment
- $11,238
- Closing costs
- $1,348
- Reserves months
- —
- Total cash needed
- —
Loan-product check · same deal, 3 products live
Conventional
25% down · 7.5% · 30yr
- Down + closing
- —
- Monthly P&I
- —
- Monthly cashflow
- —
- DSCR
- —
- Eligible?
- —
Personal DTI + credit; lowest rate.
DSCR
20% down · 8.5% · 30yr
- Down + closing
- —
- Monthly P&I
- —
- Monthly cashflow
- —
- DSCR
- —
- Eligible?
- —
No personal income docs; deal must DSCR.
Hard money
10% down · 12.0% · 12mo
- Down + closing
- —
- Monthly P&I
- —
- Monthly cashflow
- —
- DSCR
- —
- Eligible?
- —
Short-term bridge; refi at stabilization.
Rent comps 15 comps
| Address | Beds | Baths | Sqft | Rent | $/sqft | DOM | Units | Dist |
|---|---|---|---|---|---|---|---|---|
| 7345 NE 175th St Kenmore, WA | 1.0 | 1.0 | 760 | $1,850 | $2.43 | 25d | 1 | 0.22mi |
| 7208 NE 182nd St Unit 7206 Kenmore, WA | 1.0 | 1.0 | 888 | $2,000 | $2.25 | 3d | 1 | 0.29mi |
| 18235 73rd Ave NE Kenmore, WA | 1.0–2.0 | 1.0 | 787 | $1,850 | $2.35 | 6d | 4 | 0.31mi |
| 18151 68th Ave NE Kenmore, WA | 1.0 | 1.0 | 720 | $2,194 | $3.05 | 0d | 4 | 0.32mi |
| 18249 73rd Ave NE Kenmore, WA | 1.0–2.0 | 1.0–2.0 | 827 | $2,400 | $2.90 | 0d | 6 | 0.35mi |
| 6711 NE 182nd St Kenmore, WA | 1.0–2.0 | 1.0–2.0 | 899 | $2,587 | $2.88 | 0d | 9 | 0.36mi |
| 7711 NE 175th St Kenmore, WA | 1.0 | 1.0 | 709 | $1,874 | $2.64 | 3d | 1 | 0.37mi |
| 6410 NE 181st St Kenmore, WA | 2.0 | 1.0 | 910 | $2,500 | $2.75 | 44d | 1 | 0.51mi |
| 17525 80th Ave NE Kenmore, WA | 1.0–2.0 | 1.0–2.0 | 900 | $1,999 | $2.22 | 6d | 4 | 0.55mi |
| 18930 68th Ave NE Kenmore, WA | 1.0–2.0 | 1.0–2.0 | 799 | $2,497 | $3.13 | 0d | 7 | 0.62mi |
| 17527 83rd Pl NE Kenmore, WA | 2.0 | 2.0 | 900 | $1,990 | $2.21 | 6d | 1 | 0.75mi |
| 17512 83rd Pl NE Kenmore, WA | 1.0–2.0 | 1.0–2.0 | 850 | $2,250 | $2.65 | 3d | 4 | 0.82mi |
| 8700 NE Bothell Way Bothell, WA | 1.0–3.0 | 1.0–2.0 | 1038 | $2,090 | $2.01 | 0d | 8 | 1.02mi |
| 15914 84th Ave NE Unit C Kenmore, WA | 2.0 | 1.0 | 850 | $1,975 | $2.32 | 44d | 1 | 1.22mi |
| 17725 Hall Rd Bothell, WA | 1.0–2.0 | 1.0 | 772 | $1,950 | $2.52 | 0d | 2 | 1.48mi |
Listing history 18 events
-
2026-06-21days on market $44,950 Active 12 DOM
-
2026-06-18days on market $44,950 Active 9 DOM
-
2026-06-17days on market $44,950 Active 8 DOM
-
2026-06-16days on market $44,950 Active 7 DOM
-
2026-06-15days on market $44,950 Active 6 DOM
-
2026-06-13days on market $44,950 Active 4 DOM
-
2026-06-13days on market $44,950 Active 3 DOM
-
2026-06-10remarks 699-char remark
-
2026-06-10pricedays on market $44,950 Active 1 DOM
-
2026-05-05price $49,000
-
2026-04-18price $54,900
-
2026-03-02price $59,000
-
2026-01-05$65,000 Active
-
2022-07-21soldstatus $86,000 Closed
-
2022-06-21status Pending
-
2022-05-12status Active
-
2022-05-04status Pending
-
2022-05-02$90,000 Active
ⓘ Source: listings_history table (triggers on properties + properties_extension) + one-shot
backfill from property_details.listing_events for pre-trigger history.
Climate risk First Street
- Flood 10/10 Extreme FEMA zone X (unshaded) · 99% chance over 30 yrs
- Wildfire 1/10 Low
- Heat 3/10 Moderate 7 d/yr ≥86°F today · 16 d/yr by 30 yrs out
- Wind 1/10 Low
- Air quality 6/10 Major 9 unhealthy d/yr today · 9 by 30 yrs out
Nearby sold comps map
Loading sold comps map…
Walkable amenities ~0.75 mi
Loading nearby amenities…
Taxation est. · year 1
- Rental income
- $26,253
- − Mortgage interest
- −$2,518
- − Property taxes
- −$674
- − Insurance
- −$1,022
- − Repairs & maintenance
- −$2,100
- − Management
- −$2,100
- − Depreciation
- −$1,308
- Taxable income
- $16,530
- Est. tax owed @ 24.0%
- −$3,967
- After-tax cash flow
- $12,247/yr
For passive investors: Depreciation is non-cash, so a rental often shows a tax loss while cash-flowing — sheltering income. Rental losses are passive: they offset passive income freely, and up to $25,000/yr can offset ordinary (W-2) income if you actively participate and your MAGI is under $100k (phasing out to $0 by $150k); unused losses carry forward. On sale, claimed depreciation is recaptured at up to 25%, and gains may owe capital-gains tax (a 1031 exchange can defer both). Figures are a year-1 estimate at your 24.0% rate — not tax advice; consult a CPA.
Condition & rehab AI · 13 photos
This mobile home is in fair condition with cosmetic updates needed. Fresh paint and landscaping can significantly improve its curb appeal and value.
Repairs flagged
- Minor paint — paint appears faded
- Minor landscaping — small garden area
Value-add opportunities
- Both paint — Fresh paint can improve the home's curb appeal and interior aesthetics
- Both landscaping — A well-maintained garden can enhance the home's curb appeal and add value
Renovation cost estimate screening
| Repair item | Severity | Est. cost |
|---|---|---|
| paint · paint appears faded | Minor | $500–3,000 |
| landscaping · small garden area | Minor | $500–3,000 |
| Total estimated repair cost · 2 items | $1,000–6,000 |
Value-add ROI direction
- Both paint — Fresh paint can improve the home's curb appeal and interior aesthetics ↑
- Both landscaping — A well-maintained garden can enhance the home's curb appeal and add value ↑
ⓘ Cost ranges are severity-bucket heuristics (US national rule-of-thumb). Get contractor quotes + a written scope before underwriting a rehab budget.
Schools (NCES district)
- District
- Northshore School District
- NCES district ID
- 5305910
- Math proficiency
- 69% ▼ -3.00%
- Reading proficiency
- 78% ▼ -1.00%
- Median HH income
- $92,951
- Composite
- 67.41/100
- National rank
- #826
- State rank
- #9 of 291 in WA
Livability — Kenmore
- Score
- 86/100
- State rank
- #21
- US rank
- #427
Category grades
Schools grade is shown separately in the Schools card above.
Census & demographics
- Census place
- Kenmore, WA
- County
- King County · 2,251,916 people
- City population
- 23,741
- Metro
- Seattle-Tacoma-Bellevue, WA
- Population (ZIP)
- 23,741
- Household income
- $139,764
- Rent vs Own
- Severe rent burden
- 557.0
Population outlook (King County) Hauer SSP2
- Today (2025)
- 2,576,485 people
- By 2030
- 2,803,316 · +8.8%
- By 2040
- 3,255,921 · +26.4%
- By 2050
- 3,706,444 · +43.9%
- By 2075
- 4,746,063 · +84.2%
- By 2100
- 5,407,730 · +109.9%
Race, ethnicity, and origin ACS 2023
- Neighborhood character
- Diverse neighborhood (Simpson 0.55)
- Race & ethnicity
- White 64% Asian 15% Hispanic / Latino 11% Two or more races 10% Black 3%
- Hispanic origin (detail)
- Mexican 8%
- Common ancestry
- Portuguese 5% Italian 4% Slovak 2%
- Foreign-born
- 22% · Canada, China, South Korea
- Languages at home
- 73% English-only · Spanish 7% Chinese 5% Other Indo-European 3%
Political lean MEDSL · King
- 2024 margin
- Solid D (+51.7) · D 74.2% · R 22.5% · Other 3.4%
- 2008→2024 swing
- +9.6pp toward D · 2008: 42.1pp · 2024: 51.7pp
- All cycles
- 2024: D+51.7 2020: D+52.7 2016: D+50.4 2012: D+39.9 2008: D+42.1
Not yet ingested
- Civics
- —
Market trends
- HPI YoY
- ▼ -907.61%
- Current HPI
- 392.3867
- Rent YoY
- ▲ 2.09%
- Metro
- Seattle-Tacoma-Bellevue, WA
- State GDP YoY
- ▲ 4.65%
- F500 in state
- 22
Industry mix (Fortune 500 HQ in WA)
| Industry | F500 HQs | Revenue |
|---|---|---|
| Retail | 2 | $269B |
|
||
| Technology / Retail | 1 | $638B |
|
||
| Technology | 1 | $245B |
|
||
| Telecommunications | 1 | $38B |
|
||
| Food / Beverage | 1 | $36B |
|
||
| Automotive / Trucks | 1 | $34B |
|
||
Price history
-50.1% since first listed6 events — show timeline
- 2026-06-09 Listed $44,950 NWMLS as Distributed by MLS Grid
- 2022-07-21 Sold (MLS) $86,000 NWMLS as Distributed by MLS Grid
- 2022-06-21 Pending — NWMLS as Distributed by MLS Grid
- 2022-05-12 Relisted — NWMLS as Distributed by MLS Grid
- 2022-05-04 Pending — NWMLS as Distributed by MLS Grid
- 2022-05-02 Listed $90,000 NWMLS as Distributed by MLS Grid
Cash-flow waterfall
monthlySold comps — $/sqft
last 12 mo · ≤1 miLoading sold comps…