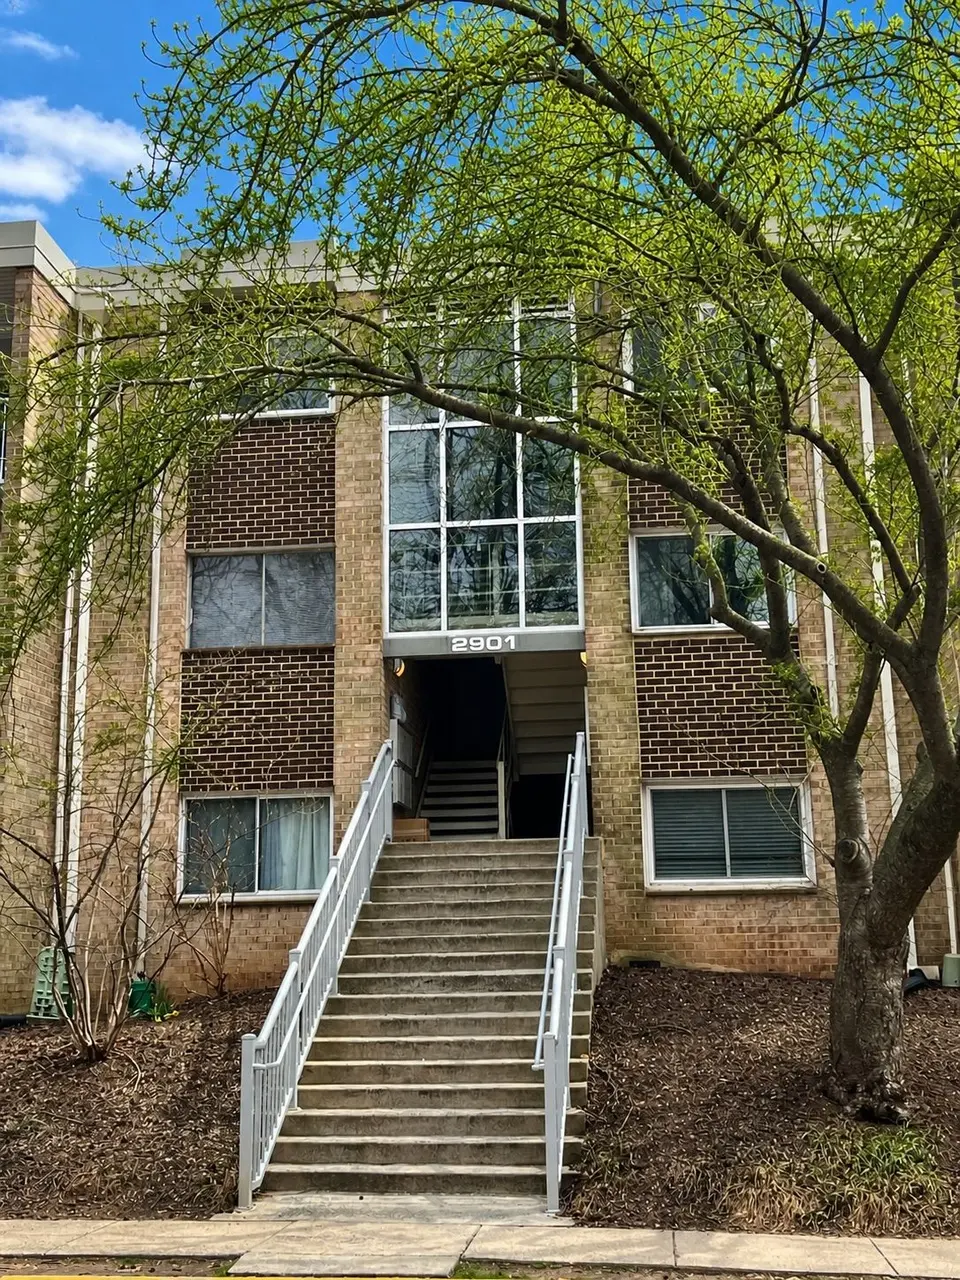
2901 Charing Cross Rd #11 · Merrifield, VA
Flood risk No data
- FEMA flood zone
- —
- Chance of flooding over 30 yrs
- —
- Est. flood insurance / yr
- —
Fire risk No data
- Est. fire insurance / yr
- —
Heat risk No data
- Hot days now (above threshold)
- —
- Hot days in 30 yrs
- —
Wind risk No data
- Chance of severe wind over 30 yrs
- —
Air-quality risk No data
- Unhealthy air days now
- —
- Unhealthy air days in 30 yrs
- —
Risk factors via First Street. Map © Google.
Why this score? — see what drove the D- grade
The composite is a weighted blend of 9 inputs, each scored 0–100. Each bar is that input's sub-score; the figure is the points it added to the 100-point composite (weight × sub-score).
- ARV discount +11.9/15.0
- Schools +6.3/10.0
- 1% rule +6.2/10.0
- Cash flow +4.6/30.0
- Livability +4.5/5.0
- Rent growth +2.8/5.0
- Condition / age +2.5/5.0
- DSCR +0.0/10.0
- Appreciation +0.0/10.0
$255,000
🖨 Deal sheet (PDF) 📄 Offer letter ✓ Due diligence
Listing remarks
Live where convenience meets lifestyle! This move-in-ready, courtyard-facing 3-bedroom condo in Yorktowne Square puts you right in the center of it all. This light-filled home features luxury vinyl plank flooring throughout and recessed lighting that enhances its bright, inviting feel. The updated kitchen has granite countertops and newer appliances, while the living space flows effortlessly to a private balcony overlooking the courtyard and pool—perfect for morning coffee or evening unwinding. All utilities are included in the condo fee, and the community offers a full suite of amenities: pool, basketball courts, playgrounds, and walking paths. Bring Fido! Yorktowne Square is pet-fri
Key facts
- Pool
- Built 1966
Property features AI
Exterior
- Home design: Condominium; 2-story building
- Exterior features: Private balcony; Community or building pool
Interior
- Bedrooms: 3 bedrooms
- Bathrooms: 1 bathroom
- Interior features: Air conditioning
Neighborhood map
What this means for you Summary
Snapshot
- This is a 3-bed/1.0-bath condo listed at $255k.
Deal economics
- At list price, monthly cash flow is $-643 ($-8k/yr) — negative.
- The deal already cash-flows at list — no discount required.
- Meets the 1% rule at list price ($3k rent vs $255k).
- Cap rate 3.3% vs local median 2.4% in Merrifield — top-decile yield for the area; either an underpriced asset or a hidden risk that comps aren't pricing in. Stress-test before assuming the spread holds.
Location & tenants
- Location reads 90/100 on livability (#4 in VA, #90 nationally) — a professional / high-income tenant draw. Strengths: crime A+, amenities A+, commute A+; Watch: cost of living F.
- Fairfax County Public School District (suburban): math 61% / reading 73% proficiency, ranked #13 of 131 in VA (top 10%) — acceptable for families but not a draw, mixed tenant base, ~2y average lease.
- Market conditions: Rents rising (+1.1%/yr); 112 active listings in the ZIP; 40 comparable units currently listed for rent nearby; rentals at typical pace (median 21d on market — plan ~3-4 weeks tenant-placement turnaround); high-income renter base; 2,861 units permitted in Fairfax County in 2024 (1,829 in 5+ unit buildings).
Forward outlook
- Local home prices are declining (-3.0%/yr); year-one equity from $2k of loan paydown is wiped out by about $8k of value loss. Plan a longer hold.
- Fairfax County population projected at +13% by 2050 — modest demand growth; plan on rents tracking national, not racing it.
Negotiation context
- Only 7 days on market — expect competitive offers; lowballing is unlikely to land.
Risks & watch-outs
- Watch-outs: HOA is 40% of rent.
Questions for the listing agent
- What do current leases actually rent for vs. the listed asking? Can we see a recent rent roll and the last 12 months of T-12 income?
- Built in 1966 — when were the roof, HVAC, electrical panel, plumbing, and water heater last replaced?
- What does the HOA fee cover, when was the last increase, and are there any pending special assessments or reserve-fund shortfalls?
- Any open or pending special assessments — roof, HVAC, plumbing, elevator, façade? What's the per-unit balance and payoff schedule, and is the seller paying it off at close or rolling it to the buyer?
- Is there a deadline driving the sale (1031 exchange, divorce, estate, relocation)? That informs how much negotiation room exists.
- Schools are A-rated — typically a magnet for longer-tenancy family renters. What's the average tenant stay here, and is there a school-zone premium baked into asking?
- The area grade is low — what's the realistic commute time and amenity access for the typical tenant pool here? Any planned neighborhood developments (good or bad) we should know about?
- What's the average days-on-market for RENTAL listings here right now (not sales)? A rising rental-DOM trend means longer vacancies and softer asking-rent achievability than the comps imply.
- What's the recent tenant-quality profile in this submarket — average credit score on applications, eviction rate, late-payment / NSF rate, and stable-employment percentage? A property-management company in the area should have these aggregated.
- How much new apartment / multifamily construction is in the pipeline within 1–3 miles? Heavy new supply (>2% of stock underway) typically softens rents 12–24 months out; light construction supports rent growth.
Investment metrics
- 1% rule
- 1.12% ✓
- Cap rate
- 3.27%
- Cash-on-cash
- -10.81%
- DSCR
- 0.52
- GRM
- 7.4
CMA / ARV
- ARV (median comp)
- $282,483
- List price
- $255,000
- Delta
- -9.73%
- Verdict
- FAIR
- Comps
- 20 within 1.0 mi
Projected returns pro-forma
-3.0% appreciation · 1.12% rent growth · sell at horizon
- IRR
- -39.6%
- Equity multiple
- -0.22×
- Total profit
- $-86,850
- Equity at exit
- $38,021
- IRR
- -88.2%
- Equity multiple
- -1.05×
- Total profit
- $-146,329
- Equity at exit
- $22,048
Cash invested: $71,400 (down + closing). Projections, not guarantees.
Landlord ↔ Tenant lean methodology
- Overall (STATE)
- 55 Moderately Landlord-Leaning
- State Virginia
- 55 Moderately Landlord-Leaning · D+2
- County
- — inherits STATE
- City
- — inherits STATE
ZIP-level market 22042
- Rents YoY
- 1.1%
- Active inventory
- 112
- Price-to-rent
- 7.4×
Monthly cashflow live
- Estimated rent
- $2,858 high interval (Pro) →
- Mortgage (P&I)
- −$1,337
- Tax est. 1.5%
- −$319 /mo · $3,825/yr
- Insurance
- −$106
- HOA est. from 2 same-building comps
- −$1,139
- Vacancy / Maint / Mgmt
- −$600
- Net cashflow
- $-643
Break-even live
Sensitivity live
| Price | -10% $-467 | -5% $-555 | +0% $-643 | +5% $-731 | +10% $-819 |
|---|---|---|---|---|---|
| Rent | -10% $-869 | -5% $-756 | +0% $-643 | +5% $-530 | +10% $-417 |
| Rate | -1.0pp $-515 | -0.5pp $-578 | base $-643 | +0.5pp $-709 | +1.0pp $-776 |
UW: 25.0% down · 7.5% · 30yr · 1.5% tax · 5.0% vac · 8.0% maint · 8.0% mgmt
Financing live
Cash to close
- Down payment
- $63,750
- Closing costs
- $7,650
- Reserves months
- —
- Total cash needed
- —
Loan-product check · same deal, 3 products live
Conventional
25% down · 7.5% · 30yr
- Down + closing
- —
- Monthly P&I
- —
- Monthly cashflow
- —
- DSCR
- —
- Eligible?
- —
Personal DTI + credit; lowest rate.
DSCR
20% down · 8.5% · 30yr
- Down + closing
- —
- Monthly P&I
- —
- Monthly cashflow
- —
- DSCR
- —
- Eligible?
- —
No personal income docs; deal must DSCR.
Hard money
10% down · 12.0% · 12mo
- Down + closing
- —
- Monthly P&I
- —
- Monthly cashflow
- —
- DSCR
- —
- Eligible?
- —
Short-term bridge; refi at stabilization.
Rent comps 40 comps
| Address | Beds | Baths | Sqft | Rent | $/sqft | DOM | Units | Dist |
|---|---|---|---|---|---|---|---|---|
| 3021 Nicosh Cir #1309 Falls Church, VA | 2.0 | 2.0 | 1148 | $2,700 | $2.35 | 8d | 1 | 0.12mi |
| 3003 Nicosh Cir #3108 Falls Church, VA | 2.0 | 2.0 | 1108 | $2,800 | $2.53 | 15d | 1 | 0.14mi |
| 8190 Strawberry Ln Falls Church, VA | 1.0–3.0 | 1.0–2.5 | 1369 | $3,864 | $2.82 | 2d | 20 | 0.36mi |
| 2940 Yarling Ct Falls Church, VA | 2.0 | 2.0 | 1025 | $2,800 | $2.73 | 44d | 1 | 0.36mi |
| 2910 Yarling Ct Unit 1 Falls Church, VA | 2.0 | 2.0 | 996 | $1,430 | $1.44 | 25d | 1 | 0.37mi |
| 2839 Yarling Ct Falls Church, VA | 2.0 | 1.0 | 1033 | $2,800 | $2.71 | 21d | 1 | 0.40mi |
| 2810 Yarling Ct Falls Church, VA | 2.0 | 2.0 | 1379 | $3,000 | $2.18 | 44d | 1 | 0.42mi |
| 2844 Yarling Ct Falls Church, VA | 2.0 | 2.0 | 1113 | $2,700 | $2.43 | 44d | 1 | 0.45mi |
| 2987 District Ave Fairfax, VA | 2.0 | 1.0–2.0 | 875 | $3,305 | $3.77 | 3d | 1 | 0.54mi |
| 7758 New Providence Dr #9 Falls Church, VA | 2.0 | 2.0 | 940 | $2,600 | $2.77 | 21d | 1 | 0.56mi |
| 7753 New Providence Dr #79 Falls Church, VA | 2.0 | 2.0 | 945 | $2,500 | $2.65 | 44d | 1 | 0.59mi |
| 8130 Prescott Dr Vienna, VA | 1.0–3.0 | 1.0–2.0 | 1037 | $3,699 | $3.57 | 2d | 26 | 0.61mi |
| 2750 Gallows Rd Vienna, VA | 2.0 | 1.0–2.0 | 863 | $3,150 | $3.65 | 2d | 1 | 0.64mi |
| 2729 Merrilee Dr Fairfax, VA | 2.0 | 1.0–2.0 | 803 | $3,439 | $4.28 | 2d | 25 | 0.70mi |
| 8183 Carnegie Hall Ct Vienna, VA | 2.0 | 2.0 | 1148 | $2,800 | $2.44 | 21d | 1 | 0.70mi |
| 8183 Carnegie Hall Ct Vienna, VA | 2.0 | 2.0 | 1166 | $2,750 | $2.36 | 11d | 3 | 0.70mi |
| 8183 Carnegie Hall Ct Vienna, VA | 2.0 | 2.0 | 1166 | $2,795 | $2.40 | 25d | 2 | 0.70mi |
| 8183 Carnegie Hall Ct Vienna, VA | 2.0 | 2.0 | 1166 | $2,795 | $2.40 | 19d | 2 | 0.70mi |
| 8183 Carnegie Hall Ct Unit 20 Vienna, VA | 2.0 | 2.0 | 1185 | $2,790 | $2.35 | 19d | 1 | 0.70mi |
| 2726 Gallows Rd Vienna, VA | 1.0–2.0 | 1.0–2.0 | 958 | $2,650 | $2.76 | 25d | 2 | 0.71mi |
| 2726 Gallows Rd Vienna, VA | 1.0–2.0 | 1.0–2.0 | 979 | $2,400 | $2.45 | 21d | 2 | 0.71mi |
| 2841 Windsor Dr #202 Falls Church, VA | 2.0 | 1.0 | 1002 | $2,500 | $2.50 | 44d | 1 | 0.72mi |
| 2852 Dover Ln Falls Church, VA | 2.0 | 1.0 | 950 | $2,100 | $2.21 | 44d | 1 | 0.74mi |
| 2665 Prosperity Ave Fairfax, VA | 2.0 | 1.0–2.0 | 989 | $2,950 | $2.98 | 15d | 2 | 0.82mi |
| 2665 Prosperity Ave Fairfax, VA | 2.0 | 1.0 | 898 | $3,200 | $3.56 | 25d | 1 | 0.82mi |
| 2677 Avenir Pl Vienna, VA | 2.0 | 1.0–2.0 | 838 | $3,077 | $3.67 | 2d | 24 | 0.82mi |
| 8301 Anderson Dr Fairfax, VA | 1.0–3.0 | 1.0–2.5 | 1192 | $3,052 | $2.56 | 2d | 41 | 0.83mi |
| 2767 January Ct Falls Church, VA | 3.0 | 3.5 | 1386 | $3,150 | $2.27 | 44d | 1 | 0.84mi |
| 7618 Savannah St #104 Falls Church, VA | 2.0 | 1.0 | 819 | $2,300 | $2.81 | 44d | 1 | 0.87mi |
| 2700 Dorr Ave Fairfax, VA | 1.0–2.0 | 1.0–2.0 | 931 | $3,090 | $3.32 | 2d | 29 | 0.90mi |
| 7481 Lee Hwy Falls Church, VA | 1.0–2.0 | 1.0 | 775 | $1,895 | $2.45 | 25d | 1 | 1.07mi |
| 7723 Marthas Ln Falls Church, VA | 4.0 | 2.0 | 1326 | $3,450 | $2.60 | 12d | 1 | 1.10mi |
| 7435 Arlington Blvd Falls Church, VA | 2.0 | 1.0 | 625 | $2,214 | $3.54 | 8d | 16 | 1.10mi |
| 3302 Woodburn Village Dr Annandale, VA | 2.0 | 1.0 | 898 | $1,990 | $2.22 | 44d | 1 | 1.12mi |
| 3354 Woodburn Rd #21 Annandale, VA | 2.0 | 1.5 | 982 | $2,200 | $2.24 | 11d | 1 | 1.19mi |
| 3354 Woodburn Rd Annandale, VA | 2.0 | 1.5 | 982 | $2,200 | $2.24 | 21d | 1 | 1.19mi |
| 7400 Parkwood Ct Falls Church, VA | 3.0 | 1.0–2.0 | 718 | $2,900 | $4.04 | 4d | 20 | 1.21mi |
| 8312 Tobin Rd #31 Annandale, VA | 2.0 | 1.0 | 869 | $2,050 | $2.36 | 22d | 1 | 1.24mi |
| 3323 Breckenridge Ct Annandale, VA | 3.0 | 2.5 | 1218 | $3,100 | $2.55 | 8d | 1 | 1.27mi |
| 7308 Poplar Ct Falls Church, VA | 3.0 | 1.5 | 1326 | $3,500 | $2.64 | 16d | 1 | 1.32mi |
HOA detail condo
- Monthly dues
- $0 · $0/yr
- Likely covers
- landscapingpool
- Assessments
- None detected in remarks — confirm with the listing agent.
Listing history 26 events
-
2026-06-18days on market $255,000 Coming Soon 7 DOM
-
2026-06-17days on market $255,000 Coming Soon 6 DOM
-
2026-06-16days on market $255,000 Coming Soon 5 DOM
-
2026-06-15days on market $255,000 Coming Soon 4 DOM
-
2026-06-13days on market $255,000 Coming Soon 2 DOM
-
2026-06-13days on market $255,000 Coming Soon 1 DOM
-
2026-06-09days on market $255,000 Coming Soon 35 DOM
-
2026-06-08days on market $255,000 Coming Soon 34 DOM
-
2026-06-07days on market $255,000 Coming Soon 33 DOM
-
2026-06-04days on market $255,000 Coming Soon 30 DOM
-
2026-06-03days on market $255,000 Coming Soon 29 DOM
-
2026-06-02days on market $255,000 Coming Soon 28 DOM
-
2026-06-01days on market $255,000 Coming Soon 27 DOM
-
2026-05-31days on market $255,000 Coming Soon 26 DOM
-
2020-08-12soldstatus $261,900 Closed 684-char remark
-
2020-07-05status Pending 684-char remark
-
2020-07-02$259,900 Active 684-char remark
-
2014-08-26soldstatus $205,000 Sold 322-char remark
-
2014-08-26soldstatus $205,000
-
2014-07-18status Contract 322-char remark
-
2014-07-18historical
-
2014-06-28price $205,000 322-char remark
-
2014-05-16status Active 322-char remark
-
2014-05-16historical Temporarily Off-Market 322-char remark
-
2014-05-16$209,900 Active 322-char remark
-
2014-05-16$205,000
ⓘ Source: listings_history table (triggers on properties + properties_extension) + one-shot
backfill from property_details.listing_events for pre-trigger history.
Nearby sold comps map
Loading sold comps map…
Walkable amenities ~0.75 mi
Loading nearby amenities…
Taxation est. · year 1
- Rental income
- $34,300
- − Mortgage interest
- −$14,284
- − Property taxes
- −$3,825
- − Insurance
- −$1,275
- − Repairs & maintenance
- −$2,744
- − Management
- −$2,744
- − HOA
- −$13,668
- − Depreciation
- −$7,418
- Taxable loss
- −$11,658
- Est. tax savings @ 24.0%
- +$2,798
- After-tax cash flow
- $-4,920/yr
For passive investors: Depreciation is non-cash, so a rental often shows a tax loss while cash-flowing — sheltering income. Rental losses are passive: they offset passive income freely, and up to $25,000/yr can offset ordinary (W-2) income if you actively participate and your MAGI is under $100k (phasing out to $0 by $150k); unused losses carry forward. On sale, claimed depreciation is recaptured at up to 25%, and gains may owe capital-gains tax (a 1031 exchange can defer both). Figures are a year-1 estimate at your 24.0% rate — not tax advice; consult a CPA.
Schools (NCES district)
- District
- Fairfax County Public School District
- NCES district ID
- 5101260
- Math proficiency
- 61% ▼ -24.00%
- Reading proficiency
- 73% ▼ -8.00%
- Median HH income
- $110,238
- Composite
- 62.59/100
- National rank
- #679
- State rank
- #13 of 131 in VA
Livability — Merrifield
- Score
- 90/100
- State rank
- #4
- US rank
- #90
Category grades
Schools grade is shown separately in the Schools card above.
Census & demographics
- Census place
- Merrifield, VA
- County
- Fairfax County · 1,104,456 people
- Metro
- Washington-Arlington-Alexandria, DC-VA-MD-WV
- Population (ZIP)
- 35,483
- Household income
- $138,255
- Rent vs Own
- Severe rent burden
- 857.0
Population outlook (Fairfax County) Hauer SSP2
- Today (2025)
- 1,237,259 people
- By 2030
- 1,277,758 · +3.3%
- By 2040
- 1,346,508 · +8.8%
- By 2050
- 1,397,919 · +13.0%
- By 2075
- 1,493,100 · +20.7%
- By 2100
- 1,465,712 · +18.5%
Race, ethnicity, and origin ACS 2023
- Neighborhood character
- Diverse neighborhood (Simpson 0.69)
- Race & ethnicity
- White 40% Hispanic / Latino 33% Asian 18% Two or more races 12% Black 5%
- Hispanic origin (detail)
- Mexican 2%
- Common ancestry
- Romanian 2% Slovak 2% Italian 2%
- Foreign-born
- 37% · Canada, Vietnam, China
- Languages at home
- 50% English-only · Spanish 30% Vietnamese 8% Other Indo-European 4%
Political lean MEDSL · Fairfax
- 2024 margin
- Solid D (+35.0) · D 66.1% · R 31.1% · Other 2.8%
- 2008→2024 swing
- +13.8pp toward D · 2008: 21.2pp · 2024: 35.0pp
- All cycles
- 2024: D+35.0 2020: D+41.9 2016: D+36.2 2012: D+19.8 2008: D+21.2
Not yet ingested
- Civics
- —
Market trends
- HPI YoY
- ▼ -488.58%
- Current HPI
- 349.9051
- Rent YoY
- ▲ 1.12%
- Metro
- Washington-Arlington-Alexandria, DC-VA-MD-WV
- State GDP YoY
- ▲ 2.40%
- F500 in state
- 50
Industry mix (Fortune 500 HQ in VA)
| Industry | F500 HQs | Revenue |
|---|---|---|
| Aerospace / Defense | 4 | $236B |
|
||
| Technology / Defense | 3 | $32B |
|
||
| Financial Services | 2 | $176B |
|
||
| Utilities | 2 | $27B |
|
||
| Insurance | 2 | $25B |
|
||
| Technology | 2 | $15B |
|
||
Cash-flow waterfall
monthlySold comps — $/sqft
last 12 mo · ≤1 miLoading sold comps…