223 Stoney Rdg · Hudson, TX
Flood risk No data
- FEMA flood zone
- —
- Chance of flooding over 30 yrs
- —
- Est. flood insurance / yr
- —
Fire risk No data
- Est. fire insurance / yr
- —
Heat risk No data
- Hot days now (above threshold)
- —
- Hot days in 30 yrs
- —
Wind risk No data
- Chance of severe wind over 30 yrs
- —
Air-quality risk No data
- Unhealthy air days now
- —
- Unhealthy air days in 30 yrs
- —
Risk factors via First Street. Map © Google.
Why this score? — see what drove the B grade
The composite is a weighted blend of 9 inputs, each scored 0–100. Each bar is that input's sub-score; the figure is the points it added to the 100-point composite (weight × sub-score).
- Cash flow +30.0/30.0
- 1% rule +10.0/10.0
- DSCR +10.0/10.0
- ARV discount +7.5/15.0
- Schools +4.9/10.0
- Livability +3.2/5.0
- Rent growth +2.5/5.0
- Condition / age +2.5/5.0
- Appreciation +0.0/10.0
$60,000
🖨 Deal sheet (PDF) 📄 Offer letter ✓ Due diligence
Listing remarks MLS
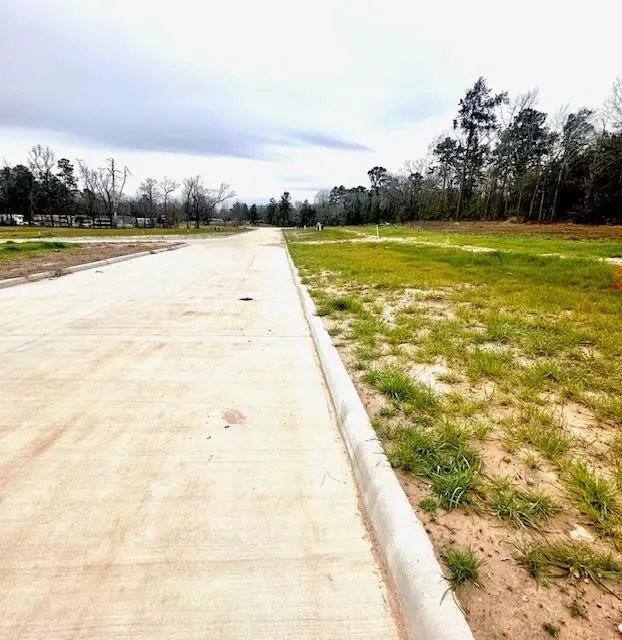
New up and coming Stoney Ridge subdivision offers the perfect place to build your dream home. This 0.51 acre lot is located in the Hudson School District with Curb and Gutters, city water and sewer, fiber optics, natural gas, underground utilities, and storm drains. Conveniently located near
Key facts
- City water and sewer
- Natural gas
- Curb and gutters
Tags
Neighborhood map
What this means for you Summary
Snapshot
- This is a land listed at $60k.
Deal economics
- At list price, monthly cash flow is $527 ($6k/yr) — positive.
- The deal already cash-flows at list — no discount required.
- Meets the 1% rule at list price ($1k rent vs $60k).
- Recommended offer: $55k (9.0% below list) — sets the bar for market timing.
- Cap rate 16.8% vs local median 3.0% in Hudson — top-decile yield for the area; either an underpriced asset or a hidden risk that comps aren't pricing in. Stress-test before assuming the spread holds.
Location & tenants
- Location reads 64/100 on livability (#791 in TX) — a middle-class / working-renter tenant base. Strengths: crime A+, cost of living A+, housing A+; Watch: amenities F, commute F, employment D-.
- Hudson ISD (rural): math 63% / reading 54% proficiency, ranked #85 of 826 in TX (top 10%) — acceptable for families but not a draw, mixed tenant base, ~2y average lease.
- Zoned schools: W F Peavy Pri (696 students, 59% FRL); Hudson Middle (math 71% / reading 55%, grade B+, #123 of 1,662 statewide, top 8%, 646 students, 55% FRL); Hudson H S (math 66% / reading 68%, grade B, #163 of 1,632 statewide, top 11%, 797 students, 48% FRL) — zoned schools at 54% FRL track the district average.
- Market conditions: 296 active listings in the ZIP; 3 comparable units currently listed for rent nearby; rentals lingering (median 46d on market — plan ~5-8 weeks vacancy on turnover, expect pricing pressure); 100% of comp listings sitting > 30 days — soft ceiling on asking rent; 120 units permitted in Angelina County in 2024 (0 in 5+ unit buildings).
Forward outlook
- Local home prices are declining (-3.0%/yr); year-one equity from $415 of loan paydown is wiped out by about $2k of value loss. Plan a longer hold.
- At projected returns (-3.0% appreciation + 3.0% rent growth), your $17k cash investment doubles in ~4 years — after that, you're playing with house money.
Negotiation context
- It's been on market 115 days — a 9% lower offer ($55k) is reasonable based on typical stale-listing flexibility.
- 2 sale attempts; this cycle's ask has dropped $188k (76%) from the opening price — seller is motivated, your offer sets the floor, not the list.
Questions for the listing agent
- It's been on market 115 days. Have you received any prior offers? Is the seller open to a 9% concession, seller financing, or rate buy-down credit?
- What does the HOA fee cover, when was the last increase, and are there any pending special assessments or reserve-fund shortfalls?
- Why hasn't it sold? Are there any deal-killer items the seller is aware of (foundation, flood, title, zoning, code violations)?
- Is there a deadline driving the sale (1031 exchange, divorce, estate, relocation)? That informs how much negotiation room exists.
- Schools are F-rated, which usually means shorter tenancies and higher turnover. Who's the typical renter profile here, and what's been the actual vacancy rate?
- What's the average days-on-market for RENTAL listings here right now (not sales)? A rising rental-DOM trend means longer vacancies and softer asking-rent achievability than the comps imply.
- What's the recent tenant-quality profile in this submarket — average credit score on applications, eviction rate, late-payment / NSF rate, and stable-employment percentage? A property-management company in the area should have these aggregated.
- How much new for-sale + rental construction is in the pipeline within 1–3 miles? Heavy new supply typically softens prices + rents 12–24 months out; constrained supply supports both.
Investment metrics
- 1% rule
- 2.00% ✓
- Cap rate
- 16.83%
- Cash-on-cash
- 37.65%
- DSCR
- 2.68
- GRM
- 4.2
CMA / ARV
No comps found within radius.
Projected returns pro-forma
-3.0% appreciation · 3.0% rent growth · sell at horizon
- IRR
- 33.7%
- Equity multiple
- 2.42×
- Total profit
- $23,867
- Equity at exit
- $8,946
- IRR
- 40.6%
- Equity multiple
- 4.82×
- Total profit
- $64,095
- Equity at exit
- $5,188
Cash invested: $16,800 (down + closing). Projections, not guarantees.
Landlord ↔ Tenant lean methodology
- Overall (STATE)
- 87 Strongly Landlord-Friendly
- State Texas
- 87 Strongly Landlord-Friendly · R+5
- County
- — inherits STATE
- City
- — inherits STATE
ZIP-level market 75904
- Home prices YoY
- -25.1%
- Active inventory
- 296
- Price-to-rent
- 4.2×
Monthly cashflow live
- Estimated rent
- $1,200 medium interval (Pro) →
- Mortgage (P&I)
- −$315
- Tax est. 1.5%
- −$75 /mo · $900/yr
- Insurance
- −$25
- HOA
- −$6
- Vacancy / Maint / Mgmt
- −$252
- Net cashflow
- $527
Break-even live
Sensitivity live
| Price | -10% $569 | -5% $548 | +0% $527 | +5% $506 | +10% $486 |
|---|---|---|---|---|---|
| Rent | -10% $432 | -5% $480 | +0% $527 | +5% $574 | +10% $622 |
| Rate | -1.0pp $557 | -0.5pp $542 | base $527 | +0.5pp $511 | +1.0pp $496 |
UW: 25.0% down · 7.5% · 30yr · 1.5% tax · 5.0% vac · 8.0% maint · 8.0% mgmt
Financing live
Cash to close
- Down payment
- $15,000
- Closing costs
- $1,800
- Reserves months
- —
- Total cash needed
- —
Loan-product check · same deal, 3 products live
Conventional
25% down · 7.5% · 30yr
- Down + closing
- —
- Monthly P&I
- —
- Monthly cashflow
- —
- DSCR
- —
- Eligible?
- —
Personal DTI + credit; lowest rate.
DSCR
20% down · 8.5% · 30yr
- Down + closing
- —
- Monthly P&I
- —
- Monthly cashflow
- —
- DSCR
- —
- Eligible?
- —
No personal income docs; deal must DSCR.
Hard money
10% down · 12.0% · 12mo
- Down + closing
- —
- Monthly P&I
- —
- Monthly cashflow
- —
- DSCR
- —
- Eligible?
- —
Short-term bridge; refi at stabilization.
Rent comps 3 comps
| Address | Beds | Baths | Sqft | Rent | $/sqft | DOM | Units | Dist |
|---|---|---|---|---|---|---|---|---|
| 3011 Ted Trout Dr Lot 11 Lufkin, TX | 3.0 | 2.0 | 1216 | $1,095 | $0.90 | 45d | 1 | 0.62mi |
| 861 Mount Carmel Rd Lufkin, TX | 3.0 | 2.0 | 1216 | $1,045 | $0.86 | 45d | 4 | 1.04mi |
| 300 S John Redditt Dr Lufkin, TX | 2.0 | 1.0 | 642 | $1,150 | $1.79 | 45d | 4 | 1.29mi |
HOA detail
- Monthly dues
- $6 · $72/yr
- Likely covers
- watersewergas
Listing history 20 events
-
2026-06-22days on market $60,000 Active 115 DOM
-
2026-06-21days on market $60,000 Active 114 DOM
-
2026-06-19days on market $60,000 Active 112 DOM
-
2026-06-18days on market $60,000 Active 111 DOM
-
2026-06-17days on market $60,000 Active 110 DOM
-
2026-06-16days on market $60,000 Active 109 DOM
-
2026-06-15days on market $60,000 Active 108 DOM
-
2026-06-14days on market $60,000 Active 106 DOM
-
2026-06-13days on market $60,000 Active 105 DOM
-
2026-06-10days on market $60,000 Active 103 DOM
-
2026-06-09days on market $60,000 Active 102 DOM
-
2026-06-08days on market $60,000 Active 101 DOM
-
2026-06-07days on market $60,000 Active 100 DOM
-
2026-06-05days on market $60,000 Active 97 DOM
-
2026-06-02days on market $60,000 Active 95 DOM
-
2026-06-01days on market $60,000 Active 94 DOM
-
2026-05-31days on market $60,000 Active 93 DOM
-
2026-05-30days on market $60,000 Active 92 DOM
-
2026-05-07$247,990 Active
-
2026-02-25$60,000 Active 292-char remark
Show marketing remark (292 chars)
New up and coming Stoney Ridge subdivision offers the perfect place to build your dream home. This 0.51 acre lot is located in the Hudson School District with Curb and Gutters, city water and sewer, fiber optics, natural gas, underground utilities, and storm drains. Conveniently located near
ⓘ Source: listings_history table (triggers on properties + properties_extension) + one-shot
backfill from property_details.listing_events for pre-trigger history.
Nearby sold comps map
Loading sold comps map…
Walkable amenities ~0.75 mi
Loading nearby amenities…
Taxation est. · year 1
- Rental income
- $14,395
- − Mortgage interest
- −$3,361
- − Property taxes
- −$900
- − Insurance
- −$300
- − Repairs & maintenance
- −$1,152
- − Management
- −$1,152
- − HOA
- −$72
- − Depreciation
- −$1,745
- Taxable income
- $5,714
- Est. tax owed @ 24.0%
- −$1,371
- After-tax cash flow
- $4,953/yr
For passive investors: Depreciation is non-cash, so a rental often shows a tax loss while cash-flowing — sheltering income. Rental losses are passive: they offset passive income freely, and up to $25,000/yr can offset ordinary (W-2) income if you actively participate and your MAGI is under $100k (phasing out to $0 by $150k); unused losses carry forward. On sale, claimed depreciation is recaptured at up to 25%, and gains may owe capital-gains tax (a 1031 exchange can defer both). Figures are a year-1 estimate at your 24.0% rate — not tax advice; consult a CPA.
Schools (NCES district)
- District
- Hudson ISD
- NCES district ID
- 4823790
- Math proficiency
- 63% ▼ -3.00%
- Reading proficiency
- 54% ▲ 1.00%
- Median HH income
- $45,047
- Composite
- 49.4/100
- National rank
- #2012
- State rank
- #85 of 826 in TX
Livability — Hudson
- Score
- 64/100
- State rank
- #791
- US rank
- #14441
Category grades
Schools grade is shown separately in the Schools card above.
Census & demographics
- Census place
- Hudson, TX
- County
- Angelina County · 62,696 people
- Metro
- Lufkin, TX
- Population (ZIP)
- 34,462
- Household income
- $60,205
- Rent vs Own
- Severe rent burden
- 1159.0
Population outlook (Angelina County) Hauer SSP2
- Today (2025)
- 90,174 people
- By 2030
- 90,697 · +0.6%
- By 2040
- 91,291 · +1.2%
- By 2050
- 91,168 · +1.1%
- By 2075
- 88,961 · -1.3%
- By 2100
- 80,590 · -10.6%
Race, ethnicity, and origin ACS 2023
- Neighborhood character
- Diverse neighborhood (Simpson 0.58)
- Race & ethnicity
- White 60% Hispanic / Latino 19% Black 16% Two or more races 12% Native American 2%
- Hispanic origin (detail)
- Mexican 17%
- Common ancestry
- Romanian 2% Slovak 1% Lithuanian 1%
- Foreign-born
- 6% · Canada
- Languages at home
- 86% English-only · Spanish 14%
Political lean MEDSL · Angelina
- 2024 margin
- Solid R (+52.0) · D 23.7% · R 75.7%
- 2008→2024 swing
- -17.0pp toward R · 2008: -35.0pp · 2024: -52.0pp
- All cycles
- 2024: R+52.0 2020: R+46.1 2016: R+47.3 2012: R+43.9 2008: R+35.0
Not yet ingested
- Civics
- —
Market trends
- HPI YoY
- ▼ -71.71%
- Current HPI
- 213.4236
- Rent YoY
- —
- Metro
- Lufkin, TX
- State GDP YoY
- ▲ 3.95%
- F500 in state
- 110
Industry mix (Fortune 500 HQ in TX)
| Industry | F500 HQs | Revenue |
|---|---|---|
| Energy | 16 | $1,198B |
|
||
| Technology | 5 | $198B |
|
||
| Engineering / Construction | 4 | $72B |
|
||
| Energy Services | 3 | $60B |
|
||
| Utilities | 3 | $41B |
|
||
| Healthcare | 2 | $330B |
|
||
Price history
+313.3% since first listed2 events — show timeline
- 2026-05-07 Listed $247,990 Deep East Texas MLS
- 2026-02-25 Listed $60,000 Deep East Texas MLS
Cash-flow waterfall
monthlySold comps — $/sqft
last 12 mo · ≤1 miLoading sold comps…