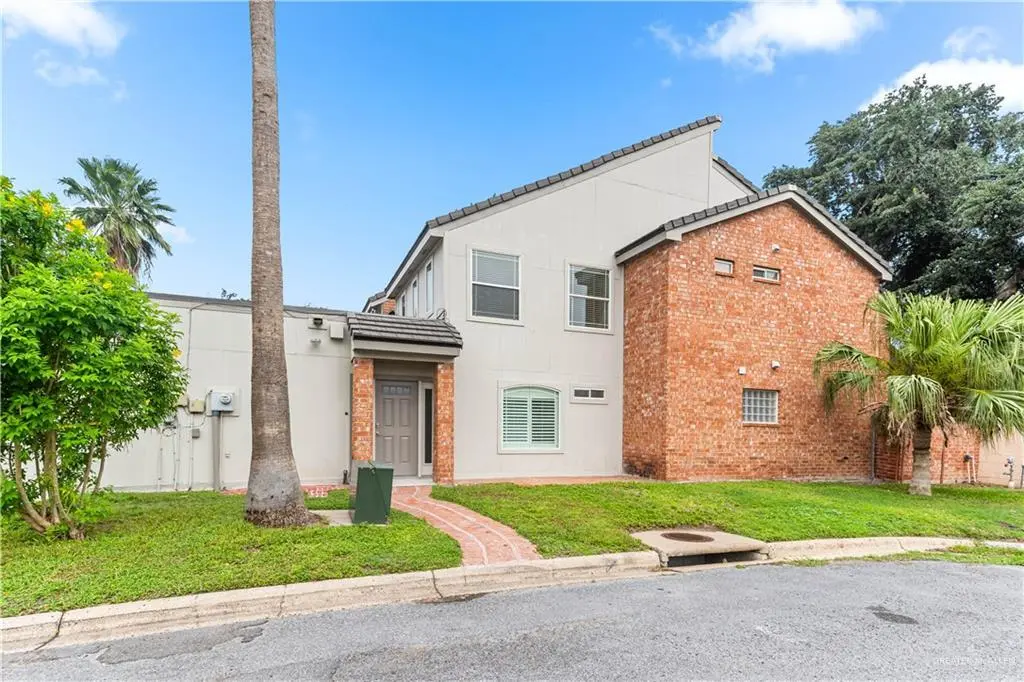
100 Xanthisma Ave #125 · McAllen, TX
Flood risk 1/10 · Minimal
- FEMA flood zone
- X (shaded)
- Chance of flooding over 30 yrs
- 0.0%
- Est. flood insurance / yr
- $507 – $1,088
Fire risk 1/10 · Minimal
- Est. fire insurance / yr
- $1,222 – $2,270
Heat risk 8/10 · Major
- Hot days now (above 111°F)
- 7 days/yr
- Hot days in 30 yrs
- 21 days/yr
Wind risk 8/10 · Major
- Chance of severe wind over 30 yrs
- 99.0%
Air-quality risk 3/10 · Minor
- Unhealthy air days now
- 1 days/yr
- Unhealthy air days in 30 yrs
- 4 days/yr
Risk factors via First Street. Map © Google.
Why this score? — see what drove the D grade
The composite is a weighted blend of 9 inputs, each scored 0–100. Each bar is that input's sub-score; the figure is the points it added to the 100-point composite (weight × sub-score).
- ARV discount +15.0/15.0
- Cash flow +8.1/30.0
- 1% rule +4.5/10.0
- Livability +3.8/5.0
- Schools +3.3/10.0
- Rent growth +3.1/5.0
- Condition / age +2.5/5.0
- DSCR +2.2/10.0
- Appreciation +0.0/10.0
$220,000
🖨 Deal sheet (PDF) 📄 Offer letter ✓ Due diligence
Listing remarks
Charming 2-bed, 2.5-bath townhome in North McAllen's established Meadowood community (78504). New AC installed in March of 2026. The master bath has jetted bathtub. Enjoy the private community pool just steps from your door and direct access to McAllen's popular 2nd Street Hike & Bike Trail. Minutes from La Plaza Mall, Palms Crossing, DHR Health, and top-rated McAllen ISD schools (Gonzalez Elementary, Cathey Middle, Memorial High). Easy access to Expressway 83. Low-maintenance living in one of McAllen's most desirable zip codes — ideal for first-time buyers, downsizers, or investors.
Key facts
- $182 HOA
- 2 garage spots
- Pool
Tags
Property features AI
Finance
- Other: Property listed with Keller Williams Realty Rgv
- Financial info: Escrow amount listed as 2000
- HOA & community: Mandatory association (Meadowwood Townhomes); Association fee $545 quarterly; POA transfer fee applies; Community features include pool, curbs, and sidewalks
Exterior
- Parking: 2 total parking spaces; 2-car garage; Garage faces side; 2 covered parking spaces; Driveway parking available (per directions)
- Security: Smoke detectors
- Utilities: Public water; City sewer; Cable available; Electric service (for heating/cooling and water heater)
- Home design: Townhome (Meadowwood Townhomes); Living area source: HidalgoCAD; Entry/approach details not specified; Facing direction not specified
- Construction: Concrete tile roof; Slab foundation; Construction materials not specified; Year built not provided
- Exterior features: BBQ pit/grill; Mature trees; Sprinkler system; Alley access; Corner lot; Curbs and gutters; Sidewalks; Paved road
Interior
- Kitchen: Dishwasher; Disposal; Stove/Range
- Bedrooms: Bedrooms information not provided
- Flooring: Carpet; Tile
- Bathrooms: 2 full bathrooms; 1 half bathroom
- Heating & cooling: Central heating (electric); Central air conditioning (electric)
- Interior features: Entrance foyer; Granite countertops; Decorative/high ceilings; Walk-in closets; Double-pane windows; Window coverings (other); Plantation shutters
- Laundry & utility: Laundry closet; Washer/dryer connection; Electric water heater
Neighborhood map
What this means for you Summary
Snapshot
- This is a 3-bed/2.0-bath single-family listed at $220k.
Deal economics
- At list price, monthly cash flow is $-211 ($-3k/yr) — negative.
- To cash-flow at today's rent, offer at most $183k (17.0% below list).
- To meet the 1% rule (rent ≥ 1% of price), the offer needs to be $209k (5.1% below list).
- Recommended offer: $183k (17.0% below list) — sets the bar for cash-flow.
- Cap rate 5.1% vs local median 3.7% in McAllen — top-decile yield for the area; either an underpriced asset or a hidden risk that comps aren't pricing in. Stress-test before assuming the spread holds.
Location & tenants
- Location reads 76/100 on livability (#119 in TX, #3,771 nationally) — a middle-class / working-renter tenant base. Strengths: cost of living A+, housing A+, health & safety A+; Watch: employment D, amenities F, commute F.
- Mcallen ISD (urban): math 34% / reading 45% proficiency, ranked #440 of 826 in TX (top 53%) — families likely to look elsewhere, expect single-tenant / working-renter base with shorter leases.
- Zoned schools: Gonzalez El (math 72% / reading 67%, grade A-, #146 of 4,322 statewide, top 4%, 797 students, 36% FRL); Morris Middle (math 59% / reading 61%, grade B, #158 of 1,662 statewide, top 10%, 1,016 students, 52% FRL); Memorial H S (math 34% / reading 54%, grade F, #697 of 1,632 statewide, top 43%, 2,080 students, 67% FRL) — zoned schools at 52% FRL track the district average.
- Zoned-school proficiency averages 58% at this address vs 40% district-wide (+18 pts) — the actual schools serving this property are materially stronger than the Mcallen ISD average implies; a family-tenant draw the district grade alone would hide.
- Market conditions: Rents rising (+2.6%/yr); 894 active listings in the ZIP; 38 comparable units currently listed for rent nearby; rentals at typical pace (median 25d on market — plan ~3-4 weeks tenant-placement turnaround); 45% of comp listings sitting > 30 days — soft ceiling on asking rent; solid renter incomes; 7,378 units permitted in Hidalgo County in 2024 (641 in 5+ unit buildings).
- This rent runs 31% of the median local income ($82k/yr) — at the standard rent-burdened threshold; future hikes will face affordability resistance.
Forward outlook
- Local home prices are declining (-3.0%/yr); year-one equity from $2k of loan paydown is wiped out by about $7k of value loss. Plan a longer hold.
- Hidalgo County population projected at +28% by 2050 — long-run rental-demand tailwind backs the buy-and-hold thesis.
Negotiation context
- It's been on market 44 days — a 3% lower offer ($213k) is reasonable based on typical stale-listing flexibility.
- 2 sale attempts with the ask held roughly flat each time — persistent listings suggest the price (not the market) is what's stuck; bring a comps-based counter.
Risks & watch-outs
- Climate carrying-cost: severe wind risk, 99% chance of damaging wind over 30y; extreme-heat days projected 7→21/yr by 2055 (HVAC capex compounding) — expect insurance premiums to compound above CPI over the hold.
Questions for the listing agent
- What do current leases actually rent for vs. the listed asking? Can we see a recent rent roll and the last 12 months of T-12 income?
- It's been on market 44 days. Have you received any prior offers? Is the seller open to a 17% concession, seller financing, or rate buy-down credit?
- What does the HOA fee cover, when was the last increase, and are there any pending special assessments or reserve-fund shortfalls?
- Is there a deadline driving the sale (1031 exchange, divorce, estate, relocation)? That informs how much negotiation room exists.
- Schools are B-rated — typically a magnet for longer-tenancy family renters. What's the average tenant stay here, and is there a school-zone premium baked into asking?
- The area grade is low — what's the realistic commute time and amenity access for the typical tenant pool here? Any planned neighborhood developments (good or bad) we should know about?
- What's the average days-on-market for RENTAL listings here right now (not sales)? A rising rental-DOM trend means longer vacancies and softer asking-rent achievability than the comps imply.
- What's the recent tenant-quality profile in this submarket — average credit score on applications, eviction rate, late-payment / NSF rate, and stable-employment percentage? A property-management company in the area should have these aggregated.
- How much new for-sale + rental construction is in the pipeline within 1–3 miles? Heavy new supply typically softens prices + rents 12–24 months out; constrained supply supports both.
Investment metrics
- 1% rule
- 0.95% ✗
- Cap rate
- 5.14%
- Cash-on-cash
- -4.11%
- DSCR
- 0.82
- GRM
- 8.8
CMA / ARV
- ARV (median comp)
- $274,587
- List price
- $220,000
- Delta
- -19.88%
- Verdict
- UNDERPRICED
- Comps
- 20 within 1.0 mi
Show comp detail 12 sales within ~0.75 mi
| Address | Dist | Beds/Ba | Sqft | Sold | Price | $/sf | Match |
|---|---|---|---|---|---|---|---|
| 201 E Yarrow Ave | 0.11mi | 3/2.0 | 2,070 (+1%) | 17mo | $334,000 | $161 | 80 |
| 125 E Yucca Ave | 0.16mi | 3/2.0 | 1,916 (-6%) | 4mo | $299,000 | $156 | 79 |
| 5116 N Cynthia St | 0.16mi | 2/2.5 (-1) | 2,059 (+0%) | 12mo | $339,000 | $165 | 75 |
| 401 E Water Lilly Ave | 0.16mi | 4/2.5 (+1) | 2,067 (+1%) | 12mo | $275,000 | $133 | 74 |
| 412 C-d Ave | 0.43mi | 3/2.5 | 2,052 (+0%) | 12mo | $175,000 | $85 | 68 |
| 413 Xanthisma Ave | 0.20mi | 3/3.0 | 1,870 (-9%) | 9mo | $310,000 | $166 | 64 |
| 4712 N 6th St | 0.43mi | 3/2.0 | 1,891 (-8%) | 12mo | $244,000 | $129 | 57 |
| 4924 N E St | 0.30mi | 3/2.0 | 1,774 (-14%) | 18mo | $275,000 | $155 | 48 |
| 4608 N 9th St | 0.61mi | 3/2.5 | 2,143 (+4%) | 20mo | $299,000 | $140 | 45 |
| 4713 N 8th St | 0.56mi | 4/3.0 (+1) | 2,217 (+8%) | 10mo | $389,000 | $175 | 42 |
| 309 Marigold Ave | 0.75mi | 3/2.0 | 2,337 (+14%) | 1mo | $307,000 | $131 | 41 |
| 3805 N 1st St | 0.70mi | 4/3.0 (+1) | 2,326 (+14%) | 12mo | $379,000 | $163 | 26 |
Match score weights: distance 35% · size 25% · config 20% · recency 20%. Top-matched comps best support the ARV.
Projected returns pro-forma
-3.0% appreciation · 2.57% rent growth · sell at horizon
- IRR
- -23.7%
- Equity multiple
- 0.19×
- Total profit
- $-49,758
- Equity at exit
- $32,803
- IRR
- -19.7%
- Equity multiple
- -0.03×
- Total profit
- $-63,330
- Equity at exit
- $19,022
Cash invested: $61,600 (down + closing). Projections, not guarantees.
Landlord ↔ Tenant lean methodology
- Overall (STATE)
- 87 Strongly Landlord-Friendly
- State Texas
- 87 Strongly Landlord-Friendly · R+5
- County
- — inherits STATE
- City
- — inherits STATE
ZIP-level market 78504
- Home prices YoY
- -29.4%
- Rents YoY
- 2.6%
- Active inventory
- 894
- Price-to-rent
- 8.8×
Monthly cashflow live
- Estimated rent
- $2,088 high interval (Pro) →
- Mortgage (P&I)
- −$1,154
- Tax from tax record
- −$433 /mo · $5,201/yr
- Insurance
- −$92
- HOA
- −$182
- Vacancy / Maint / Mgmt
- −$439
- Net cashflow
- $-211
Break-even live
Sensitivity live
| Price | -10% $-87 | -5% $-149 | +0% $-211 | +5% $-273 | +10% $-336 |
|---|---|---|---|---|---|
| Rent | -10% $-376 | -5% $-294 | +0% $-211 | +5% $-129 | +10% $-46 |
| Rate | -1.0pp $-100 | -0.5pp $-155 | base $-211 | +0.5pp $-268 | +1.0pp $-326 |
UW: 25.0% down · 7.5% · 30yr · 1.5% tax · 5.0% vac · 8.0% maint · 8.0% mgmt
Financing live
Cash to close
- Down payment
- $55,000
- Closing costs
- $6,600
- Reserves months
- —
- Total cash needed
- —
Loan-product check · same deal, 3 products live
Conventional
25% down · 7.5% · 30yr
- Down + closing
- —
- Monthly P&I
- —
- Monthly cashflow
- —
- DSCR
- —
- Eligible?
- —
Personal DTI + credit; lowest rate.
DSCR
20% down · 8.5% · 30yr
- Down + closing
- —
- Monthly P&I
- —
- Monthly cashflow
- —
- DSCR
- —
- Eligible?
- —
No personal income docs; deal must DSCR.
Hard money
10% down · 12.0% · 12mo
- Down + closing
- —
- Monthly P&I
- —
- Monthly cashflow
- —
- DSCR
- —
- Eligible?
- —
Short-term bridge; refi at stabilization.
Rent comps 38 comps
| Address | Beds | Baths | Sqft | Rent | $/sqft | DOM | Units | Dist |
|---|---|---|---|---|---|---|---|---|
| 413 E Wisteria Ave McAllen, TX | 3.0 | 2.0 | 1900 | $2,200 | $1.16 | 15d | 1 | 0.18mi |
| 113 E Yucca Ave McAllen, TX | 2.0 | 2.0 | 1782 | $1,850 | $1.04 | 22d | 1 | 0.19mi |
| 512 E Yarrow Ave McAllen, TX | 3.0 | 2.0 | 1764 | $1,800 | $1.02 | 45d | 1 | 0.25mi |
| 304 Bluebird Ave McAllen, TX | 4.0 | 3.0 | 2536 | $3,800 | $1.50 | 24d | 1 | 0.36mi |
| 513 E Bluebird Ave McAllen, TX | 4.0 | 3.0 | 2210 | $2,800 | $1.27 | 45d | 1 | 0.40mi |
| 204 Canary Ave McAllen, TX | 3.0 | 2.5 | 1705 | $2,800 | $1.64 | 45d | 1 | 0.42mi |
| 4712 N 6th St McAllen, TX | 3.0 | 2.0 | 1891 | $2,200 | $1.16 | 24d | 1 | 0.44mi |
| 1008 E Dove Ave McAllen, TX | 3.0 | 2.0 | 2049 | $1,800 | $0.88 | 45d | 1 | 0.59mi |
| 121 E Jonquil Ave McAllen, TX | 4.0 | 3.5 | 2792 | $1,985 | $0.71 | 24d | 1 | 0.79mi |
| 125 E Kiwi St McAllen, TX | 4.0 | 3.0 | 2529 | $1,800 | $0.71 | 15d | 1 | 0.84mi |
| 118 E Iris Ave McAllen, TX | 4.0 | 2.5 | 2070 | $1,800 | $0.87 | 24d | 1 | 0.88mi |
| 3400 N Cynthia St McAllen, TX | 3.0 | 2.0 | 1708 | $1,600 | $0.94 | 24d | 1 | 0.90mi |
| 705 Kerry Ln McAllen, TX | 3.0 | 2.0 | 2326 | $1,650 | $0.71 | 24d | 1 | 0.90mi |
| 1206 Bluebird Ave McAllen, TX | 2.0 | 2.0 | 1544 | $1,600 | $1.04 | 45d | 1 | 0.95mi |
| 4120 N 12th St Apt 14 McAllen, TX | 2.0 | 1.5 | 1514 | $1,250 | $0.83 | 20d | 1 | 0.95mi |
| 1313 Yz Ave McAllen, TX | 3.0 | 3.0 | 2062 | $2,600 | $1.26 | 24d | 1 | 0.98mi |
| 512 E Gardenia Ave McAllen, TX | 3.0 | 2.0 | 1717 | $1,900 | $1.11 | 45d | 1 | 1.07mi |
| 1101 Kerria Ave McAllen, TX | 3.0 | 2.0 | 1920 | $2,350 | $1.22 | 22d | 1 | 1.12mi |
| 6617 N 5th St McAllen, TX | 3.0 | 2.0 | 1478 | $1,650 | $1.12 | 45d | 1 | 1.13mi |
| 701 Hibiscus Ave #12 McAllen, TX | 3.0 | 2.0 | 1685 | $1,800 | $1.07 | 45d | 1 | 1.13mi |
| 6220 N 11th St McAllen, TX | 1.0–2.0 | 1.0 | 20493 | $875 | $0.04 | 22d | 3 | 1.17mi |
| 700 W Fern Ave #5 McAllen, TX | 2.0 | 2.0 | 1517 | $1,350 | $0.89 | 45d | 1 | 1.17mi |
| 3112 N 6th St McAllen, TX | 2.0 | 2.0 | 1610 | $1,750 | $1.09 | 45d | 1 | 1.17mi |
| 449 Quail Ave Unit NA McAllen, TX | 4.0 | 3.0 | 2150 | $1,850 | $0.86 | 45d | 1 | 1.20mi |
| 6836 N 5th St McAllen, TX | 2.0 | 2.5 | 1557 | $2,200 | $1.41 | 24d | 1 | 1.20mi |
| 6821 N 5th St McAllen, TX | 3.0 | 3.0 | 1572 | $2,000 | $1.27 | 45d | 1 | 1.20mi |
| 1612 Cardinal Ave McAllen, TX | 3.0 | 2.0 | 1793 | $1,750 | $0.98 | 45d | 1 | 1.21mi |
| 1524 Primrose Ave McAllen, TX | 3.0 | 2.0 | 2002 | $1,750 | $0.87 | 24d | 1 | 1.22mi |
| 428 Quail Ave McAllen, TX | 4.0 | 2.5 | 2350 | $1,900 | $0.81 | 45d | 1 | 1.22mi |
| 505 W Esperanza Ave McAllen, TX | 3.0 | 3.0 | 2660 | $4,250 | $1.60 | 24d | 1 | 1.22mi |
| 1210 W Jonquil Ave McAllen, TX | 4.0 | 3.0 | 1628 | $1,525 | $0.94 | 45d | 1 | 1.23mi |
| 1508 W Nolana Ave McAllen, TX | 2.0 | 2.0 | 2296 | $750 | $0.33 | 45d | 1 | 1.23mi |
| 1931 W Owassa Rd Edinburg, TX | 3.0 | 3.0 | 2032 | $1,700 | $0.84 | 24d | 1 | 1.23mi |
| 7105 N 4th St McAllen, TX | 4.0 | 3.0 | 2594 | $2,800 | $1.08 | 15d | 1 | 1.32mi |
| 1207 W Fig Ave #1 Pharr, TX | 2.0 | 2.5 | 1550 | $1,200 | $0.77 | 24d | 1 | 1.41mi |
| 5018 S Hummer Ln Edinburg, TX | 3.0 | 2.0 | 1926 | $1,800 | $0.93 | 24d | 1 | 1.42mi |
| 1205 W Kiwi Ave Unit 3 Pharr, TX | 2.0 | 2.5 | 1450 | $1,400 | $0.97 | 24d | 1 | 1.43mi |
| 1216 Quail Ave McAllen, TX | 3.0 | 2.0 | 1842 | $1,700 | $0.92 | 45d | 1 | 1.48mi |
HOA detail
- Monthly dues
- $182 · $2,184/yr
- Likely covers
- pool
Listing history 17 events
-
2026-06-21days on market $220,000 Active 44 DOM
-
2026-06-18days on market $220,000 Active 41 DOM
-
2026-06-17days on market $220,000 Active 40 DOM
-
2026-06-16days on market $220,000 Active 39 DOM
-
2026-06-15days on market $220,000 Active 38 DOM
-
2026-06-14statusdays on market $220,000 Active 36 DOM
-
2026-06-10days on market $220,000 Option 33 DOM
-
2026-06-09days on market $220,000 Option 32 DOM
-
2026-06-08days on market $220,000 Option 31 DOM
-
2026-06-07statusdays on market $220,000 Option 30 DOM
-
2026-06-05days on market $220,000 Active 27 DOM
-
2026-06-03days on market $220,000 Active 26 DOM
-
2026-06-02days on market $220,000 Active 25 DOM
-
2026-06-01days on market $220,000 Active 24 DOM
-
2026-05-31days on market $220,000 Active 23 DOM
-
2026-05-31days on market $220,000 Active 22 DOM
-
2026-05-08$220,000 Active 600-char remark
ⓘ Source: listings_history table (triggers on properties + properties_extension) + one-shot
backfill from property_details.listing_events for pre-trigger history.
Tax reassessment forecast TX · Resets to sale price
- Current annual tax
- $5,201 · $433/mo
- Projected year-2 tax
- $5,201 · $433/mo
- Expected delta
- $0/yr ($0/mo · 0.0%)
ⓘ Screening estimate from a state-policy table — verify with the county assessor before closing.
Climate risk First Street
- Flood 1/10 Low FEMA zone X (shaded) · 0% chance over 30 yrs
- Wildfire 1/10 Low
- Heat 8/10 Severe 7 d/yr ≥111°F today · 21 d/yr by 30 yrs out
- Wind 8/10 Severe 99% chance of damaging wind over 30 yrs
- Air quality 3/10 Moderate 1 unhealthy d/yr today · 4 by 30 yrs out
Nearby sold comps map
Loading sold comps map…
Walkable amenities ~0.75 mi
Loading nearby amenities…
Taxation est. · year 1
- Rental income
- $25,058
- − Mortgage interest
- −$12,323
- − Property taxes
- −$5,201
- − Insurance
- −$1,100
- − Repairs & maintenance
- −$2,005
- − Management
- −$2,005
- − HOA
- −$2,184
- − Depreciation
- −$6,400
- Taxable loss
- −$6,160
- Est. tax savings @ 24.0%
- +$1,478
- After-tax cash flow
- $-1,056/yr
For passive investors: Depreciation is non-cash, so a rental often shows a tax loss while cash-flowing — sheltering income. Rental losses are passive: they offset passive income freely, and up to $25,000/yr can offset ordinary (W-2) income if you actively participate and your MAGI is under $100k (phasing out to $0 by $150k); unused losses carry forward. On sale, claimed depreciation is recaptured at up to 25%, and gains may owe capital-gains tax (a 1031 exchange can defer both). Figures are a year-1 estimate at your 24.0% rate — not tax advice; consult a CPA.
Schools (NCES district)
- District
- Mcallen ISD
- NCES district ID
- 4829670
- Math proficiency
- 34% ▼ -22.00%
- Reading proficiency
- 45% ▼ -5.00%
- Median HH income
- $40,805
- Composite
- 33.16/100
- National rank
- #5551
- State rank
- #440 of 826 in TX
Livability — McAllen
- Score
- 76/100
- State rank
- #119
- US rank
- #3771
Category grades
Schools grade is shown separately in the Schools card above.
Census & demographics
- Census place
- McAllen, TX
- County
- Hidalgo County · 623,128 people
- City population
- 144,650
- Metro
- McAllen-Edinburg-Mission, TX
- Population (ZIP)
- 63,094
- Household income
- $81,905
- Rent vs Own
- Severe rent burden
- 1468.0
Population outlook (Hidalgo County) Hauer SSP2
- Today (2025)
- 955,232 people
- By 2030
- 1,009,774 · +5.7%
- By 2040
- 1,120,332 · +17.3%
- By 2050
- 1,225,036 · +28.2%
- By 2075
- 1,439,189 · +50.7%
- By 2100
- 1,533,429 · +60.5%
Race, ethnicity, and origin ACS 2023
- Neighborhood character
- Predominantly Hispanic (82%)
- Race & ethnicity
- Hispanic / Latino 82% Two or more races 39% White 11% Asian 5%
- Hispanic origin (detail)
- Mexican 75%
- Common ancestry
- Lithuanian 1% Italian 1%
- Foreign-born
- 24% · Canada, South Korea, Vietnam
- Languages at home
- 34% English-only · Spanish 62% Other Asian/Pacific 1% Tagalog/Filipino 1%
Political lean MEDSL · Hidalgo
- 2024 margin
- Toss-up / Even · D 48.1% · R 51.0%
- 2008→2024 swing
- -41.6pp toward R · 2008: 38.7pp · 2024: -2.9pp
- All cycles
- 2024: R+2.9 2020: D+17.1 2016: D+40.5 2012: D+41.8 2008: D+38.7
Not yet ingested
- Civics
- —
Market trends
- HPI YoY
- ▼ -80.87%
- Current HPI
- 194.1764
- Rent YoY
- ▲ 2.57%
- Metro
- McAllen-Edinburg-Mission, TX
- State GDP YoY
- ▲ 3.95%
- F500 in state
- 110
Industry mix (Fortune 500 HQ in TX)
| Industry | F500 HQs | Revenue |
|---|---|---|
| Energy | 16 | $1,198B |
|
||
| Technology | 5 | $198B |
|
||
| Engineering / Construction | 4 | $72B |
|
||
| Energy Services | 3 | $60B |
|
||
| Utilities | 3 | $41B |
|
||
| Healthcare | 2 | $330B |
|
||
Price history
3 events — show timeline
- 2026-06-11 Relisted — MCALLENMLS
- 2026-06-05 Contingent — MCALLENMLS
- 2026-05-08 Listed $220,000 MCALLENMLS
Property tax history
+3.6%/yrLatest (2025): $5,201 · +7.0% YoY. Source: county tax records.
Cash-flow waterfall
monthlySold comps — $/sqft
last 12 mo · ≤1 miLoading sold comps…