 🏷️ Likely Rental
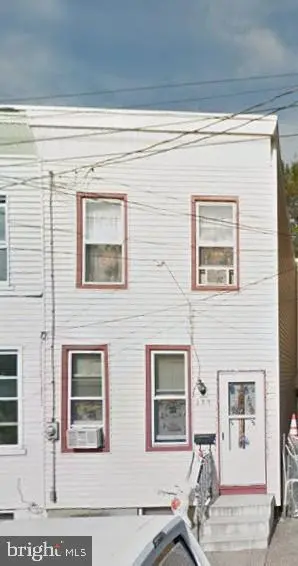
233 N Third St · Gloucester City, NJ
Flood risk 5/10 · Moderate
- FEMA flood zone
- AE
- Chance of flooding over 30 yrs
- 0.45%
- Est. flood insurance / yr
- $1,737 – $8,500
Fire risk 1/10 · Minimal
- Est. fire insurance / yr
- $526 – $976
Heat risk 7/10 · Major
- Hot days now (above 103°F)
- 7 days/yr
- Hot days in 30 yrs
- 15 days/yr
Wind risk 6/10 · Moderate
- Chance of severe wind over 30 yrs
- 27.0%
Air-quality risk 4/10 · Minor
- Unhealthy air days now
- 5 days/yr
- Unhealthy air days in 30 yrs
- 6 days/yr
Risk factors via First Street. Map © Google.
Why this score? — see what drove the B+ grade
The composite is a weighted blend of 9 inputs, each scored 0–100. Each bar is that input's sub-score; the figure is the points it added to the 100-point composite (weight × sub-score).
- Cash flow +30.0/30.0
- ARV discount +15.0/15.0
- 1% rule +10.0/10.0
- DSCR +10.0/10.0
- Livability +3.6/5.0
- Rent growth +2.5/5.0
- Condition / age +2.5/5.0
- Schools +2.0/10.0
- Appreciation +0.0/10.0
$130,000
🖨 Deal sheet (PDF) 📄 Offer letter ✓ Due diligence
Listing remarks
This well-maintained 3-bedroom, 1-bath home offers an excellent opportunity for investors seeking immediate income. The property is currently tenant-occupied and generating strong, consistent cash flow, making it a true turnkey investment. The home is in good condition, minimizing the need for immediate repairs or upgrades. With a functional layout and desirable three-bedroom setup, it appeals to a wide range of tenants, supporting long-term rental stability. Whether you’re looking to expand your portfolio or secure your first income-producing property, this is a solid, low-maintenance investment with reliable returns. - Buyer is responsible for the CO. - Seller is selling the propert
Key facts
- 1,037 sq ft lot
- Built 1900
- Listed 50 days
Property features AI
Finance
- Other: Improvement and land assessed values available
- Financial info: Fee simple ownership
Exterior
- Parking: On-street parking
- Utilities: Public water; Public septic; Power available
- Home design: Detached structure; Frame construction
- Construction: Frame construction materials; Foundation: Other; Other structures above and below grade; Above-grade finished area reported by assessor (1,162)
- Exterior features: Lot dimensions approximately 14 x 74
Interior
- Bedrooms: 3 bedrooms on main level
- Bathrooms: 1 full bathroom on main level; 1 full bathroom total
- Heating & cooling: Heating: Other; Cooling: Other; Heating fuel: Other; Cooling fuel: Natural gas; Hot water: Other
- Interior features: No basement; Living area reported by assessor
Neighborhood map
What this means for you Summary
Snapshot
- This is a 3-bed/1.0-bath single-family listed at $130k.
Deal economics
- At list price, monthly cash flow is $185 ($2k/yr) — positive.
- The deal already cash-flows at list — no discount required.
- Meets the 1% rule at list price ($2k rent vs $130k).
- Recommended offer: $126k (3.0% below list) — sets the bar for market timing.
- Cap rate 11.9% vs local median 5.5% in Gloucester City — top-decile yield for the area; either an underpriced asset or a hidden risk that comps aren't pricing in. Stress-test before assuming the spread holds.
Location & tenants
- Location reads 72/100 on livability (#215 in NJ) — a middle-class / working-renter tenant base. Strengths: housing A+, health & safety B+; Watch: amenities F, commute F.
- Gloucester City Public School District (suburban): math 11% / reading 34% proficiency, ranked #413 of 472 in NJ (top 88%) — low school quality limits family demand, transient renter base, plan for 1-2y turnover.
- Market conditions: 92 active listings in the ZIP; 15 comparable units currently listed for rent nearby; rentals at typical pace (median 25d on market — plan ~3-4 weeks tenant-placement turnaround); 1,018 units permitted in Camden County in 2024 (509 in 5+ unit buildings).
- This rent runs 39% of the median local income ($63k/yr) — at the standard rent-burdened threshold; future hikes will face affordability resistance.
Forward outlook
- Local home prices are declining (-3.0%/yr); year-one equity from $899 of loan paydown is wiped out by about $4k of value loss. Plan a longer hold.
- Camden County population projected to shrink 8% by 2050 — rents likely to lag national; underwrite the cash flow, not the appreciation.
Negotiation context
- It's been on market 51 days — a 3% lower offer ($126k) is reasonable based on typical stale-listing flexibility.
Risks & watch-outs
- Watch-outs: property tax is 2.6% of price; flood insurance adds $427/mo; built in 1900 — expect roof / HVAC / electrical / plumbing capex.
- Climate carrying-cost: in FEMA flood zone AE (mandatory federal flood insurance); major wind risk, 27% chance of damaging wind over 30y; extreme-heat days projected 7→15/yr by 2055 (HVAC capex compounding) — expect insurance premiums to compound above CPI over the hold.
Questions for the listing agent
- It's been on market 51 days. Have you received any prior offers? Is the seller open to a 3% concession, seller financing, or rate buy-down credit?
- Built in 1900 — when were the roof, HVAC, electrical panel, plumbing, and water heater last replaced?
- Property tax is high relative to price — has the assessment been appealed recently, and will the sale trigger a re-assessment?
- What's the actual annual flood-insurance premium (NFIP or private), and is the property in a SFHA with mandatory coverage?
- Is there a deadline driving the sale (1031 exchange, divorce, estate, relocation)? That informs how much negotiation room exists.
- What's the average days-on-market for RENTAL listings here right now (not sales)? A rising rental-DOM trend means longer vacancies and softer asking-rent achievability than the comps imply.
- What's the recent tenant-quality profile in this submarket — average credit score on applications, eviction rate, late-payment / NSF rate, and stable-employment percentage? A property-management company in the area should have these aggregated.
- How much new for-sale + rental construction is in the pipeline within 1–3 miles? Heavy new supply typically softens prices + rents 12–24 months out; constrained supply supports both.
Investment metrics
- 1% rule
- 1.58% ✓
- Cap rate
- 11.93%
- Cash-on-cash
- 20.15%
- DSCR
- 1.90
- GRM
- 5.3
CMA / ARV
- ARV (on-the-fly)
- $237,048
- Comps found
- 8
Show comp detail 8 sales within ~0.75 mi
| Address | Dist | Beds/Ba | Sqft | Sold | Price | $/sf | Match |
|---|---|---|---|---|---|---|---|
| 328 Jersey Ave | 0.09mi | 2/1.0 (-1) | 1,038 (-11%) | 4mo | $170,000 | $164 | 69 |
| 111 N Sussex St | 0.39mi | 2/1.5 (-1) | 1,088 (-6%) | 6mo | $222,000 | $204 | 59 |
| 606 N Brown St | 0.67mi | 3/1.0 | 1,254 (+8%) | 2mo | $235,000 | $187 | 54 |
| 607 N Johnson Blvd | 0.73mi | 3/1.0 | 1,098 (-6%) | 7mo | $250,000 | $228 | 51 |
| 736 Hunter St | 0.40mi | 3/1.5 | 1,264 (+9%) | 17mo | $199,000 | $157 | 50 |
| 913 Mercer St | 0.65mi | 3/1.0 | 1,100 (-5%) | 22mo | $275,000 | $250 | 43 |
| 915 Paul St | 0.59mi | 3/1.5 | 1,056 (-9%) | 24mo | $250,000 | $237 | 35 |
| 805 Mercer St | 0.56mi | 4/1.0 (+1) | 1,002 (-14%) | 17mo | $195,000 | $195 | 32 |
Match score weights: distance 35% · size 25% · config 20% · recency 20%. Top-matched comps best support the ARV.
Projected returns pro-forma
-3.0% appreciation · 3.0% rent growth · sell at horizon
- IRR
- -6.6%
- Equity multiple
- 0.75×
- Total profit
- $-8,948
- Equity at exit
- $19,383
- IRR
- 3.3%
- Equity multiple
- 1.24×
- Total profit
- $8,820
- Equity at exit
- $11,240
Cash invested: $36,400 (down + closing). Projections, not guarantees.
Landlord ↔ Tenant lean methodology
- Overall (STATE)
- 21 Tenant-Leaning
- State New Jersey
- 21 Tenant-Leaning · D+6
- County
- — inherits STATE
- City
- — inherits STATE
ZIP-level market 08030
- Home prices YoY
- -27.9%
- Active inventory
- 92
- Price-to-rent
- 5.3×
Monthly cashflow live
- Estimated rent
- $2,056 high interval (Pro) →
- Mortgage (P&I)
- −$682
- Tax from tax record
- −$277 /mo · $3,324/yr
- Insurance
- −$54
- Flood insurance flood zone
- −$427 /mo · $5,118/yr
- HOA
- −$0
- Vacancy / Maint / Mgmt
- −$432
- Net cashflow
- $185
Break-even live
Sensitivity live
| Price | -10% $258 | -5% $221 | +0% $185 | +5% $148 | +10% $111 |
|---|---|---|---|---|---|
| Rent | -10% $22 | -5% $103 | +0% $185 | +5% $266 | +10% $347 |
| Rate | -1.0pp $250 | -0.5pp $218 | base $185 | +0.5pp $151 | +1.0pp $117 |
UW: 25.0% down · 7.5% · 30yr · 1.5% tax · 5.0% vac · 8.0% maint · 8.0% mgmt
Financing live
Cash to close
- Down payment
- $32,500
- Closing costs
- $3,900
- Reserves months
- —
- Total cash needed
- —
Loan-product check · same deal, 3 products live
Conventional
25% down · 7.5% · 30yr
- Down + closing
- —
- Monthly P&I
- —
- Monthly cashflow
- —
- DSCR
- —
- Eligible?
- —
Personal DTI + credit; lowest rate.
DSCR
20% down · 8.5% · 30yr
- Down + closing
- —
- Monthly P&I
- —
- Monthly cashflow
- —
- DSCR
- —
- Eligible?
- —
No personal income docs; deal must DSCR.
Hard money
10% down · 12.0% · 12mo
- Down + closing
- —
- Monthly P&I
- —
- Monthly cashflow
- —
- DSCR
- —
- Eligible?
- —
Short-term bridge; refi at stabilization.
Rent comps 15 comps
| Address | Beds | Baths | Sqft | Rent | $/sqft | DOM | Units | Dist |
|---|---|---|---|---|---|---|---|---|
| 231 3rd St Gloucester City, NJ | 3.0 | 2.0 | 1376 | $2,150 | $1.56 | 25d | 1 | 0.01mi |
| 604 Hunter St Gloucester City, NJ | 3.0 | 1.0 | 1066 | $1,900 | $1.78 | 5d | 1 | 0.25mi |
| 602 Powell St Gloucester City, NJ | 3.0 | 1.0 | 1170 | $1,850 | $1.58 | 25d | 1 | 0.26mi |
| 227 S Broadway Gloucester City, NJ | 3.0 | 1.0 | 1123 | $1,775 | $1.58 | 25d | 1 | 0.40mi |
| 334 Middlesex St Gloucester City, NJ | 3.0 | 1.0 | 896 | $1,800 | $2.01 | 25d | 1 | 0.40mi |
| 534 Bergen St Gloucester City, NJ | 3.0 | 1.0 | 1246 | $2,000 | $1.61 | 19d | 1 | 0.43mi |
| 917 Koehler St Gloucester City, NJ | 3.0 | 1.0 | 916 | $1,800 | $1.97 | 19d | 1 | 0.63mi |
| 1063 S Merrimac Rd Camden, NJ | 4.0 | 1.0 | 1024 | $1,900 | $1.86 | 25d | 1 | 1.12mi |
| 108 New Broadway Unit 120 Brooklawn, NJ | 2.0 | 1.0 | 800 | $1,800 | $2.25 | 25d | 1 | 1.12mi |
| 3136 Tuckahoe Rd Camden, NJ | 2.0 | 1.0 | 800 | $1,350 | $1.69 | 25d | 1 | 1.13mi |
| 1021 Monitor Rd Camden, NJ | 3.0 | 1.0 | 1012 | $1,710 | $1.69 | 25d | 1 | 1.16mi |
| 5 Meadow Ln Gloucester City, NJ | 1.0–2.0 | 1.0–2.0 | 833 | $2,385 | $2.86 | 25d | 8 | 1.34mi |
| 2829 Idaho Rd Camden, NJ | 3.0 | 1.5 | 1048 | $1,700 | $1.62 | 25d | 1 | 1.34mi |
| 3079 Alabama Rd Camden, NJ | 2.0 | 1.0 | 832 | $1,700 | $2.04 | 25d | 1 | 1.46mi |
| 2892 N Constitution Rd Camden, NJ | 3.0 | 1.0 | 1040 | $2,000 | $1.92 | 25d | 1 | 1.50mi |
Listing history 15 events
-
2026-06-21days on market $130,000 Active 51 DOM
-
2026-06-18days on market $130,000 Active 48 DOM
-
2026-06-17days on market $130,000 Active 47 DOM
-
2026-06-16days on market $130,000 Active 46 DOM
-
2026-06-15days on market $130,000 Active 45 DOM
-
2026-06-13days on market $130,000 Active 43 DOM
-
2026-06-09days on market $130,000 Active 39 DOM
-
2026-06-08days on market $130,000 Active 38 DOM
-
2026-06-07days on market $130,000 Active 37 DOM
-
2026-06-04days on market $130,000 Active 34 DOM
-
2026-06-03days on market $130,000 Active 33 DOM
-
2026-06-02days on market $130,000 Active 32 DOM
-
2026-06-01days on market $130,000 Active 31 DOM
-
2026-05-31days on market $130,000 Active 30 DOM
-
2026-05-01$130,000 Active
ⓘ Source: listings_history table (triggers on properties + properties_extension) + one-shot
backfill from property_details.listing_events for pre-trigger history.
Tax reassessment forecast NJ · Partial reset (capped growth)
- Current annual tax
- $3,324 · $277/mo
- Projected year-2 tax
- $3,324 · $277/mo
- Expected delta
- $0/yr ($0/mo · 0.0%)
ⓘ Screening estimate from a state-policy table — verify with the county assessor before closing.
Climate risk First Street
- Flood 5/10 Major FEMA zone AE · 45% chance over 30 yrs
- Wildfire 1/10 Low
- Heat 7/10 Severe 7 d/yr ≥103°F today · 15 d/yr by 30 yrs out
- Wind 6/10 Major 27% chance of damaging wind over 30 yrs
- Air quality 4/10 Moderate 5 unhealthy d/yr today · 6 by 30 yrs out
Nearby sold comps map
Loading sold comps map…
Walkable amenities ~0.75 mi
Loading nearby amenities…
Taxation est. · year 1
- Rental income
- $24,668
- − Mortgage interest
- −$7,282
- − Property taxes
- −$3,324
- − Insurance
- −$5,768
- − Repairs & maintenance
- −$1,973
- − Management
- −$1,973
- − Depreciation
- −$3,782
- Taxable income
- $565
- Est. tax owed @ 24.0%
- −$136
- After-tax cash flow
- $2,079/yr
For passive investors: Depreciation is non-cash, so a rental often shows a tax loss while cash-flowing — sheltering income. Rental losses are passive: they offset passive income freely, and up to $25,000/yr can offset ordinary (W-2) income if you actively participate and your MAGI is under $100k (phasing out to $0 by $150k); unused losses carry forward. On sale, claimed depreciation is recaptured at up to 25%, and gains may owe capital-gains tax (a 1031 exchange can defer both). Figures are a year-1 estimate at your 24.0% rate — not tax advice; consult a CPA.
Schools (NCES district)
- District
- Gloucester City Public School District
- NCES district ID
- 3406000
- Math proficiency
- 11% ▼ -21.00%
- Reading proficiency
- 34% ▼ -15.00%
- Median HH income
- $51,231
- Composite
- 20.01/100
- National rank
- #8664
- State rank
- #413 of 472 in NJ
Livability — Gloucester City
- Score
- 72/100
- State rank
- #215
- US rank
- #5984
Category grades
Schools grade is shown separately in the Schools card above.
Census & demographics
- Census place
- Gloucester City, NJ
- County
- Camden County · 407,624 people
- City population
- 13,217
- Metro
- Philadelphia-Camden-Wilmington, PA-NJ-DE-MD
- Population (ZIP)
- 13,217
- Household income
- $63,384
- Rent vs Own
- Severe rent burden
- 431.0
Population outlook (Camden County) Hauer SSP2
- Today (2025)
- 507,964 people
- By 2030
- 502,182 · -1.1%
- By 2040
- 485,602 · -4.4%
- By 2050
- 465,630 · -8.3%
- By 2075
- 419,986 · -17.3%
- By 2100
- 369,492 · -27.3%
Race, ethnicity, and origin ACS 2023
- Neighborhood character
- Predominantly White (68%)
- Race & ethnicity
- White 68% Hispanic / Latino 18% Black 7% Asian 5% Two or more races 5%
- Hispanic origin (detail)
- Mexican 4% Puerto Rican 10%
- Common ancestry
- Romanian 4% Lithuanian 3% Hispanic 2%
- Foreign-born
- 8% · Canada, Jamaica, China
- Languages at home
- 81% English-only · Spanish 13% Other Indo-European 4% Arabic 1%
Political lean MEDSL · Camden
- 2024 margin
- Strong D (+27.4) · D 63.0% · R 35.5% · Other 1.5%
- 2008→2024 swing
- -8.8pp toward R · 2008: 36.2pp · 2024: 27.4pp
- All cycles
- 2024: D+27.4 2020: D+33.5 2016: D+32.4 2012: D+36.6 2008: D+36.2
Not yet ingested
- Civics
- —
Market trends
- HPI YoY
- ▼ -115.59%
- Current HPI
- 298.9139
- Rent YoY
- —
- Metro
- Philadelphia-Camden-Wilmington, PA-NJ-DE-MD
- State GDP YoY
- ▲ 2.05%
- F500 in state
- 34
Industry mix (Fortune 500 HQ in NJ)
| Industry | F500 HQs | Revenue |
|---|---|---|
| Consumer Goods | 3 | $31B |
|
||
| Pharmaceuticals | 2 | $153B |
|
||
| Technology | 2 | $21B |
|
||
| Insurance | 2 | $20B |
|
||
| Healthcare | 2 | $19B |
|
||
| Financial Services | 1 | $70B |
|
||
Price history
1 event — show timeline
- 2026-05-01 Listed $130,000 BRIGHT MLS
Property tax history
+3.6%/yrLatest (2025): $3,324 · +5.6% YoY. Source: county tax records.
Cash-flow waterfall
monthlySold comps — $/sqft
last 12 mo · ≤1 miLoading sold comps…