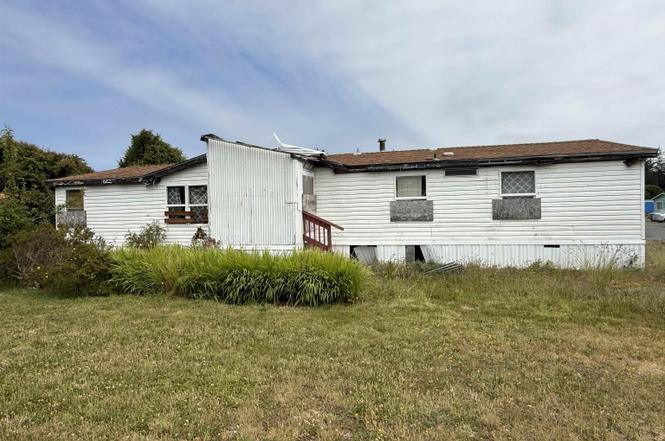
200 Kerby St · Bertsch-Oceanview, CA
Flood risk 1/10 · Minimal
- FEMA flood zone
- X (unshaded)
- Chance of flooding over 30 yrs
- 0.0%
- Est. flood insurance / yr
- $507 – $1,088
Fire risk 1/10 · Minimal
- Est. fire insurance / yr
- $659 – $1,223
Heat risk 2/10 · Minimal
- Hot days now (above 77°F)
- 9 days/yr
- Hot days in 30 yrs
- 29 days/yr
Wind risk 1/10 · Minimal
- Chance of severe wind over 30 yrs
- —
Air-quality risk 6/10 · Moderate
- Unhealthy air days now
- 8 days/yr
- Unhealthy air days in 30 yrs
- 9 days/yr
Risk factors via First Street. Map © Google.
Why this score? — see what drove the B- grade
The composite is a weighted blend of 9 inputs, each scored 0–100. Each bar is that input's sub-score; the figure is the points it added to the 100-point composite (weight × sub-score).
- Cash flow +30.0/30.0
- 1% rule +10.0/10.0
- DSCR +10.0/10.0
- ARV discount +7.5/15.0
- Schools +2.8/10.0
- Rent growth +2.5/5.0
- Livability +2.5/5.0
- Condition / age +2.5/5.0
- Appreciation +0.0/10.0
$58,999
🖨 Deal sheet (PDF) 📄 Offer letter ✓ Due diligence
Listing remarks MLS
This modular home needs a little tlc but it is located on a nice corner lot. Lots of windows so there is plenty of natural light and the seller just had all new carpet installed throughout the home.
Key facts
- Built 1987
- Listed 5 days
Property features AI
Finance
- Other: Listing agent: Erik Tedsen, Main contact: 707-464-8757; Listing broker: INVESTMENT REALTY HOMES INC.
- Financial info: Financial details not provided
- HOA & community: HOA and community details not provided
Exterior
- Parking: Parking details not provided
- Security: Security details not provided
- Utilities: Public water
- Home design: Mobile home
- Construction: Construction details not provided
- Exterior features: Zoned for residential use
Interior
- Kitchen: Kitchen details not provided
- Bedrooms: Mobile home bedrooms (details not provided)
- Flooring: Flooring details not provided
- Bathrooms: Bathroom details not provided
- Heating & cooling: Heating and cooling details not provided
- Interior features: Residential interior (mobile home)
- Laundry & utility: Laundry/utility details not provided
Neighborhood map
What this means for you Summary
Snapshot
- This is a 3-bed/2.0-bath manufactured listed at $59k.
Deal economics
- At list price, monthly cash flow is $1k ($13k/yr) — positive.
- The deal already cash-flows at list — no discount required.
- Meets the 1% rule at list price ($2k rent vs $59k).
- Cap rate 29.1% vs local median 2.9% in Bertsch-Oceanview — top-decile yield for the area; either an underpriced asset or a hidden risk that comps aren't pricing in. Stress-test before assuming the spread holds.
Location & tenants
- Location reads: area grade B — affects rentability + tenant quality, not the cash-flow math above.
- Del Norte County Unified (town): math 25% / reading 36% proficiency, ranked #1,047 of 1,400 in CA (top 75%) — families likely to look elsewhere, expect single-tenant / working-renter base with shorter leases.
- Market conditions: 230 active listings in the ZIP; 55 units permitted in Del Norte County in 2024 (22 in 5+ unit buildings).
Forward outlook
- Local home prices are declining (-3.0%/yr); year-one equity from $408 of loan paydown is wiped out by about $2k of value loss. Plan a longer hold.
- Del Norte County population projected at -14% by 2050 — secular population decline; favor cash flow + early exit over multi-decade hold.
- At projected returns (-3.0% appreciation + 3.0% rent growth), your $17k cash investment doubles in ~2 years — after that, you're playing with house money.
Negotiation context
- Only 6 days on market — expect competitive offers; lowballing is unlikely to land.
- Current owner paid $22k; list at $59k implies a 168% gain — meaningful room to come down on a strong offer.
Questions for the listing agent
- Is there a deadline driving the sale (1031 exchange, divorce, estate, relocation)? That informs how much negotiation room exists.
- What's the average days-on-market for RENTAL listings here right now (not sales)? A rising rental-DOM trend means longer vacancies and softer asking-rent achievability than the comps imply.
- What's the recent tenant-quality profile in this submarket — average credit score on applications, eviction rate, late-payment / NSF rate, and stable-employment percentage? A property-management company in the area should have these aggregated.
- How much new for-sale + rental construction is in the pipeline within 1–3 miles? Heavy new supply typically softens prices + rents 12–24 months out; constrained supply supports both.
Investment metrics
- 1% rule
- 3.28% ✓
- Cap rate
- 29.11%
- Cash-on-cash
- 81.51%
- DSCR
- 4.63
- GRM
- 2.5
CMA / ARV
- ARV (on-the-fly)
- $312,000
- Comps found
- 6
Show comp detail 6 sales within ~0.75 mi
| Address | Dist | Beds/Ba | Sqft | Sold | Price | $/sf | Match |
|---|---|---|---|---|---|---|---|
| 228 Hill St | 0.20mi | 3/2.0 | 1,600 (0%) | 7mo | $255,000 | $159 | 84 |
| 2451 Cushing Ave | 0.53mi | 3/2.0 | 1,680 (+5%) | 12mo | $335,000 | $199 | 57 |
| 515 Humboldt Road Rd | 0.58mi | 4/2.0 (+1) | 1,705 (+7%) | 0mo | $315,000 | $185 | 56 |
| 303 Hill St | 0.27mi | 4/2.0 (+1) | 1,512 (-6%) | 23mo | $295,000 | $195 | 55 |
| 149 Olive St | 0.19mi | 2/1.0 (-1) | 1,382 (-14%) | 10mo | $154,000 | $111 | 52 |
| 2450 Cushing Ave | 0.52mi | 3/2.0 | 1,404 (-12%) | 22mo | $284,000 | $202 | 37 |
Match score weights: distance 35% · size 25% · config 20% · recency 20%. Top-matched comps best support the ARV.
Projected returns pro-forma
-3.0% appreciation · 3.0% rent growth · sell at horizon
- IRR
- 81.8%
- Equity multiple
- 4.75×
- Total profit
- $61,932
- Equity at exit
- $8,797
- IRR
- 85.1%
- Equity multiple
- 9.84×
- Total profit
- $146,068
- Equity at exit
- $5,101
Cash invested: $16,520 (down + closing). Projections, not guarantees.
Landlord ↔ Tenant lean methodology
- Overall (STATE)
- 18 Strongly Tenant-Friendly
- State California
- 18 Strongly Tenant-Friendly · D+13
- County
- — inherits STATE
- City
- — inherits STATE
ZIP-level market 95531
- Active inventory
- 230
- Price-to-rent
- 2.5×
Monthly cashflow live
- Estimated rent
- $1,936 medium interval (Pro) →
- Mortgage (P&I)
- −$309
- Tax est. 1.5%
- −$74 /mo · $885/yr
- Insurance
- −$25
- HOA
- −$0
- Vacancy / Maint / Mgmt
- −$407
- Net cashflow
- $1,122
Break-even live
Sensitivity live
| Price | -10% $1,163 | -5% $1,142 | +0% $1,122 | +5% $1,102 | +10% $1,081 |
|---|---|---|---|---|---|
| Rent | -10% $969 | -5% $1,046 | +0% $1,122 | +5% $1,199 | +10% $1,275 |
| Rate | -1.0pp $1,152 | -0.5pp $1,137 | base $1,122 | +0.5pp $1,107 | +1.0pp $1,091 |
UW: 25.0% down · 7.5% · 30yr · 1.5% tax · 5.0% vac · 8.0% maint · 8.0% mgmt
Financing live
Cash to close
- Down payment
- $14,750
- Closing costs
- $1,770
- Reserves months
- —
- Total cash needed
- —
Loan-product check · same deal, 3 products live
Conventional
25% down · 7.5% · 30yr
- Down + closing
- —
- Monthly P&I
- —
- Monthly cashflow
- —
- DSCR
- —
- Eligible?
- —
Personal DTI + credit; lowest rate.
DSCR
20% down · 8.5% · 30yr
- Down + closing
- —
- Monthly P&I
- —
- Monthly cashflow
- —
- DSCR
- —
- Eligible?
- —
No personal income docs; deal must DSCR.
Hard money
10% down · 12.0% · 12mo
- Down + closing
- —
- Monthly P&I
- —
- Monthly cashflow
- —
- DSCR
- —
- Eligible?
- —
Short-term bridge; refi at stabilization.
Listing history 6 events
-
2026-06-21days on market $58,999 Active 6 DOM
-
2026-06-19days on market $58,999 Active 4 DOM
-
2026-06-18days on market $58,999 Active 3 DOM
-
2026-06-17days on market $58,999 Active 2 DOM
-
2026-06-16remarks 121-char remark
-
2026-06-16$58,999 Active 1 DOM
ⓘ Source: listings_history table (triggers on properties + properties_extension) + one-shot
backfill from property_details.listing_events for pre-trigger history.
Climate risk First Street
- Flood 1/10 Low FEMA zone X (unshaded) · 0% chance over 30 yrs
- Wildfire 1/10 Low
- Heat 2/10 Low 9 d/yr ≥77°F today · 29 d/yr by 30 yrs out
- Wind 1/10 Low
- Air quality 6/10 Major 8 unhealthy d/yr today · 9 by 30 yrs out
Nearby sold comps map
Loading sold comps map…
Walkable amenities ~0.75 mi
Loading nearby amenities…
Taxation est. · year 1
- Rental income
- $23,237
- − Mortgage interest
- −$3,305
- − Property taxes
- −$885
- − Insurance
- −$295
- − Repairs & maintenance
- −$1,859
- − Management
- −$1,859
- − Depreciation
- −$1,716
- Taxable income
- $13,318
- Est. tax owed @ 24.0%
- −$3,196
- After-tax cash flow
- $10,268/yr
For passive investors: Depreciation is non-cash, so a rental often shows a tax loss while cash-flowing — sheltering income. Rental losses are passive: they offset passive income freely, and up to $25,000/yr can offset ordinary (W-2) income if you actively participate and your MAGI is under $100k (phasing out to $0 by $150k); unused losses carry forward. On sale, claimed depreciation is recaptured at up to 25%, and gains may owe capital-gains tax (a 1031 exchange can defer both). Figures are a year-1 estimate at your 24.0% rate — not tax advice; consult a CPA.
Schools (NCES district)
- District
- Del Norte County Unified
- NCES district ID
- 0610770
- Math proficiency
- 25% ▲ 1.00%
- Reading proficiency
- 36% ▲ 1.00%
- Median HH income
- $39,747
- Composite
- 28.43/100
- National rank
- #12110
- State rank
- #1047 of 1400 in CA
Livability — Bertsch-Oceanview
No livability data for this city. (Only ~50 U.S. cities are tracked.)
Census & demographics
- Census place
- Bertsch-Oceanview, CA
- Population (ZIP)
- 22,491
Population outlook (Del Norte County) Hauer SSP2
- Today (2025)
- 25,011 people
- By 2030
- 24,204 · -3.2%
- By 2040
- 22,826 · -8.7%
- By 2050
- 21,495 · -14.1%
- By 2075
- 18,487 · -26.1%
- By 2100
- 16,113 · -35.6%
Race, ethnicity, and origin ACS 2023
- Neighborhood character
- Diverse neighborhood (Simpson 0.58)
- Race & ethnicity
- White 61% Hispanic / Latino 20% Two or more races 12% Native American 5% Asian 4% Black 3%
- Hispanic origin (detail)
- Mexican 15%
- Common ancestry
- Slovak 4% Russian 2% Lithuanian 2%
- Foreign-born
- 8% · Canada, Vietnam, South Korea
- Languages at home
- 88% English-only · Spanish 8% Other Asian/Pacific 2% Vietnamese 1%
Political lean MEDSL · Del Norte
- 2024 margin
- R (+16.4) · D 40.4% · R 56.8% · Other 2.8%
- 2008→2024 swing
- -9.7pp toward R · 2008: -6.8pp · 2024: -16.4pp
- All cycles
- 2024: R+16.4 2020: R+15.6 2016: R+17.6 2012: R+10.8 2008: R+6.8
Not yet ingested
- Civics
- —
Market trends
- HPI YoY
- ▼ -300.53%
- Current HPI
- 148.4819
- Rent YoY
- —
- Metro
- —
- State GDP YoY
- ▲ 3.21%
- F500 in state
- 116
Industry mix (Fortune 500 HQ in CA)
| Industry | F500 HQs | Revenue |
|---|---|---|
| Technology | 27 | $1,492B |
|
||
| Financial Services | 3 | $174B |
|
||
| Retail | 3 | $44B |
|
||
| Insurance | 3 | $26B |
|
||
| Media / Entertainment | 2 | $115B |
|
||
| Pharmaceuticals / Biotech | 2 | $62B |
|
||
Price history
+168.2% since first listed2 events — show timeline
- 2026-06-16 Listed $58,999 DNAORMLS
- 2019-01-10 Sold (MLS) $22,000 DNAORMLS
Cash-flow waterfall
monthlySold comps — $/sqft
last 12 mo · ≤1 miLoading sold comps…