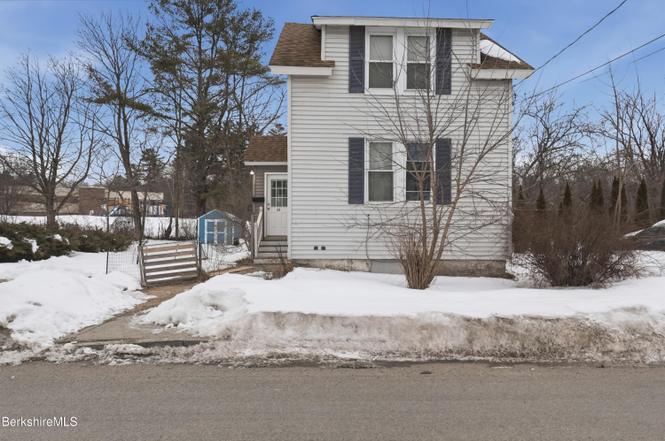
22 S Atlantic Ave · Pittsfield, MA
Flood risk 4/10 · Minor
- FEMA flood zone
- X
- Chance of flooding over 30 yrs
- 0.23%
- Est. flood insurance / yr
- $473 – $860
Fire risk 3/10 · Minor
- Est. fire insurance / yr
- $915 – $1,699
Heat risk 2/10 · Minimal
- Hot days now (above 91°F)
- 7 days/yr
- Hot days in 30 yrs
- 16 days/yr
Wind risk 4/10 · Minor
- Chance of severe wind over 30 yrs
- 9.0%
Air-quality risk 2/10 · Minimal
- Unhealthy air days now
- 1 days/yr
- Unhealthy air days in 30 yrs
- 1 days/yr
Risk factors via First Street. Map © Google.
Why this score? — see what drove the C grade
The composite is a weighted blend of 9 inputs, each scored 0–100. Each bar is that input's sub-score; the figure is the points it added to the 100-point composite (weight × sub-score).
- Cash flow +20.1/30.0
- ARV discount +15.0/15.0
- DSCR +6.4/10.0
- 1% rule +4.6/10.0
- Rent growth +4.4/5.0
- Livability +3.8/5.0
- Condition / age +2.5/5.0
- Schools +2.3/10.0
- Appreciation +0.0/10.0
$179,900
🖨 Deal sheet (PDF) 📄 Offer letter ✓ Due diligence
Listing remarks MLS
Quaint three bedroom cape on one-way street near downtown Pittsfield. This affordable home offers 3 bedrooms, 1 bath, living room, eat-in kitchen, pantry, large enclosed porch, shed, and small backyard. Close to elementary school. New sewer pipes 2018. New hot water tank 2020. New sump pump 2021. Solar panels are rented through Sunrun and will be transferred to buyer.
Key facts
- Renovated bathroom
- Off street parking
- First floor laundry
Tags
Property features AI
Exterior
- Parking: Off-street parking
- Utilities: 100 Amp electric service; Public sewer
- Home design: Updated/remodeled condition
- Construction: Fiberglass roof; Total building area approximately 890
- Exterior features: Front porch; Public bus access nearby; Outbuilding
Interior
- Kitchen: Refrigerator
- Bedrooms: Total of 5 rooms (includes bedrooms and living spaces)
- Flooring: Carpet; Laminate
- Bathrooms: 1 full bathroom
- Heating & cooling: Natural gas heating
- Interior features: Bright, updated kitchen; Accessible bedroom; Accessible full bath
- Laundry & utility: Washer; Dryer
Neighborhood map
What this means for you Summary
Snapshot
- This is a 3-bed/1.0-bath single-family listed at $180k.
Deal economics
- At list price, monthly cash flow is $223 ($3k/yr) — positive.
- The deal already cash-flows at list — no discount required.
- To meet the 1% rule (rent ≥ 1% of price), the offer needs to be $172k (4.2% below list).
- Recommended offer: $172k (4.2% below list) — sets the bar for 1% rule.
- Cap rate 7.8% vs local median 3.7% in Pittsfield — top-decile yield for the area; either an underpriced asset or a hidden risk that comps aren't pricing in. Stress-test before assuming the spread holds.
Location & tenants
- Location reads 75/100 on livability (#70 in MA, #3,820 nationally) — a middle-class / working-renter tenant base. Strengths: commute A+, housing A+, health & safety A+; Watch: employment C-, amenities D+, crime D.
- Pittsfield (urban): math 19% / reading 34% proficiency, ranked #272 of 302 in MA (top 90%) — low school quality limits family demand, transient renter base, plan for 1-2y turnover.
- Zoned schools: Silvio O Conte Community (math 8% / reading 27%, grade F, #819 of 938 statewide, top 88%, 357 students, 0% FRL); John T Reid Middle (math 7% / reading 17%, grade F, #283 of 305 statewide, top 93%, 450 students, 0% FRL); Pittsfield High (math 32% / reading 57%, grade F, #203 of 343 statewide, top 60%, 651 students, 0% FRL) — zoned schools average 0% FRL vs 50% district-wide (50 pts lower); this property's tenant base skews higher-income than the district average.
- Market conditions: Rents rising fast (+7.7%/yr); 278 active listings in the ZIP; 4 comparable units currently listed for rent nearby; rentals lingering (median 46d on market — plan ~5-8 weeks vacancy on turnover, expect pricing pressure); 50% of comp listings sitting > 30 days — soft ceiling on asking rent; 130 units permitted in Berkshire County in 2024 (10 in 5+ unit buildings).
Forward outlook
- Local home prices are declining (-3.0%/yr); year-one equity from $1k of loan paydown is wiped out by about $5k of value loss. Plan a longer hold.
- Berkshire County population projected at -24% by 2050 — secular population decline; favor cash flow + early exit over multi-decade hold.
- At projected returns (-3.0% appreciation + 7.7% rent growth), your $50k cash investment doubles in ~10 years — after that, you're playing with house money.
Negotiation context
- It's been on market 52 days — a 3% lower offer ($175k) is reasonable based on typical stale-listing flexibility.
- 12 sale attempts since 26y ago with the ask held roughly flat each time — persistent listings suggest the price (not the market) is what's stuck; bring a comps-based counter.
- Current owner paid $75k; list at $180k implies a 140% gain — meaningful room to come down on a strong offer.
Risks & watch-outs
- Watch-outs: built in 1929 — expect roof / HVAC / electrical / plumbing capex.
Questions for the listing agent
- It's been on market 52 days. Have you received any prior offers? Is the seller open to a 4% concession, seller financing, or rate buy-down credit?
- Built in 1929 — when were the roof, HVAC, electrical panel, plumbing, and water heater last replaced?
- Is there a deadline driving the sale (1031 exchange, divorce, estate, relocation)? That informs how much negotiation room exists.
- Schools are D-rated, which usually means shorter tenancies and higher turnover. Who's the typical renter profile here, and what's been the actual vacancy rate?
- Crime grade is D in this area — have there been break-ins, vandalism, or insurance claims at this property in the last 3 years? What carrier currently insures it and at what premium?
- What's the average days-on-market for RENTAL listings here right now (not sales)? A rising rental-DOM trend means longer vacancies and softer asking-rent achievability than the comps imply.
- What's the recent tenant-quality profile in this submarket — average credit score on applications, eviction rate, late-payment / NSF rate, and stable-employment percentage? A property-management company in the area should have these aggregated.
- How much new for-sale + rental construction is in the pipeline within 1–3 miles? Heavy new supply typically softens prices + rents 12–24 months out; constrained supply supports both.
Investment metrics
- 1% rule
- 0.96% ✗
- Cap rate
- 7.78%
- Cash-on-cash
- 5.32%
- DSCR
- 1.24
- GRM
- 8.7
CMA / ARV
- ARV (on-the-fly)
- $235,850
- Comps found
- 3
Show comp detail 3 sales within ~0.75 mi
| Address | Dist | Beds/Ba | Sqft | Sold | Price | $/sf | Match |
|---|---|---|---|---|---|---|---|
| 29 Crystal St | 0.52mi | 3/1.0 | 875 (-2%) | 6mo | $232,000 | $265 | 68 |
| 39 Catherine St | 0.63mi | 2/1.0 (-1) | 800 (-10%) | 18mo | $240,000 | $300 | 34 |
| 175 Lakeway Dr | 0.48mi | 2/1.0 (-1) | 1,008 (+13%) | 22mo | $202,400 | $201 | 32 |
Match score weights: distance 35% · size 25% · config 20% · recency 20%. Top-matched comps best support the ARV.
Projected returns pro-forma
-3.0% appreciation · 7.72% rent growth · sell at horizon
- IRR
- -3.2%
- Equity multiple
- 0.87×
- Total profit
- $-6,383
- Equity at exit
- $26,824
- IRR
- 10.9%
- Equity multiple
- 2.02×
- Total profit
- $51,418
- Equity at exit
- $15,554
Cash invested: $50,372 (down + closing). Projections, not guarantees.
Landlord ↔ Tenant lean methodology
- Overall (STATE)
- 20 Strongly Tenant-Friendly
- State Massachusetts
- 20 Strongly Tenant-Friendly · D+15
- County
- — inherits STATE
- City
- — inherits STATE
ZIP-level market 01201
- Rents YoY
- 7.7%
- Active inventory
- 278
- Price-to-rent
- 8.7×
Monthly cashflow live
- Estimated rent
- $1,724 medium interval (Pro) →
- Mortgage (P&I)
- −$943
- Tax from tax record
- −$120 /mo · $1,442/yr
- Insurance
- −$75
- HOA
- −$0
- Vacancy / Maint / Mgmt
- −$362
- Net cashflow
- $223
Break-even live
Sensitivity live
| Price | -10% $325 | -5% $274 | +0% $223 | +5% $173 | +10% $122 |
|---|---|---|---|---|---|
| Rent | -10% $87 | -5% $155 | +0% $223 | +5% $292 | +10% $360 |
| Rate | -1.0pp $314 | -0.5pp $269 | base $223 | +0.5pp $177 | +1.0pp $129 |
UW: 25.0% down · 7.5% · 30yr · 1.5% tax · 5.0% vac · 8.0% maint · 8.0% mgmt
Financing live
Cash to close
- Down payment
- $44,975
- Closing costs
- $5,397
- Reserves months
- —
- Total cash needed
- —
Loan-product check · same deal, 3 products live
Conventional
25% down · 7.5% · 30yr
- Down + closing
- —
- Monthly P&I
- —
- Monthly cashflow
- —
- DSCR
- —
- Eligible?
- —
Personal DTI + credit; lowest rate.
DSCR
20% down · 8.5% · 30yr
- Down + closing
- —
- Monthly P&I
- —
- Monthly cashflow
- —
- DSCR
- —
- Eligible?
- —
No personal income docs; deal must DSCR.
Hard money
10% down · 12.0% · 12mo
- Down + closing
- —
- Monthly P&I
- —
- Monthly cashflow
- —
- DSCR
- —
- Eligible?
- —
Short-term bridge; refi at stabilization.
Rent comps 4 comps
| Address | Beds | Baths | Sqft | Rent | $/sqft | DOM | Units | Dist |
|---|---|---|---|---|---|---|---|---|
| 266 Linden St Unit 2R Pittsfield, MA | 3.0 | 1.0 | 1000 | $1,750 | $1.75 | 25d | 1 | 0.18mi |
| 37 Monroe St Pittsfield, MA | 2.0 | 1.0 | 800 | $1,550 | $1.94 | 25d | 1 | 0.21mi |
| 456 Fenn St Unit 4 Pittsfield, MA | 2.0 | 1.0 | 1000 | $1,450 | $1.45 | 45d | 1 | 1.25mi |
| 124 Appleton Ave Unit 124 First Floor Pittsfield, MA | 2.0 | 1.0 | 800 | $1,575 | $1.97 | 45d | 1 | 1.31mi |
Listing history 39 events
-
2026-06-18statusdays on market $179,900 Pending 52 DOM
-
2026-06-17days on market $179,900 Active 51 DOM
-
2026-06-16days on market $179,900 Active 50 DOM
-
2026-06-15days on market $179,900 Active 49 DOM
-
2026-06-14days on market $179,900 Active 47 DOM
-
2026-06-12days on market $179,900 Active 46 DOM
-
2026-06-09days on market $179,900 Active 43 DOM
-
2026-06-08days on market $179,900 Active 42 DOM
-
2026-06-07days on market $179,900 Active 41 DOM
-
2026-06-05days on market $179,900 Active 38 DOM
-
2026-06-02days on market $179,900 Active 36 DOM
-
2026-06-01days on market $179,900 Active 35 DOM
-
2026-05-31days on market $179,900 Active 34 DOM
-
2026-05-30days on market $179,900 Active 33 DOM
-
2026-05-19status Active
-
2026-03-27status Pending
-
2026-03-05$179,900 Active
-
2021-06-25soldstatus $75,000 370-char remark
Show marketing remark (370 chars)
Quaint three bedroom cape on one-way street near downtown Pittsfield. This affordable home offers 3 bedrooms, 1 bath, living room, eat-in kitchen, pantry, large enclosed porch, shed, and small backyard. Close to elementary school. New sewer pipes 2018. New hot water tank 2020. New sump pump 2021. Solar panels are rented through Sunrun and will be transferred to buyer.
-
2021-04-30$72,900 370-char remark
Show marketing remark (370 chars)
Quaint three bedroom cape on one-way street near downtown Pittsfield. This affordable home offers 3 bedrooms, 1 bath, living room, eat-in kitchen, pantry, large enclosed porch, shed, and small backyard. Close to elementary school. New sewer pipes 2018. New hot water tank 2020. New sump pump 2021. Solar panels are rented through Sunrun and will be transferred to buyer.
-
2017-11-16soldstatus $59,000 433-char remark
Show marketing remark (433 chars)
This quaint modified cape is currently being used as an investment property. Offering 2/3 bedrooms, 1 bath, eat in kitchen, living room, large porch, small backyard. Very affordable property and currently collects $900 monthly with nothing included. Roof, windows and electrical upgrades in 2010. Plumbing redone in 2004. Vinyl sided and vinyl windows make this property low maintenance. Being sold as is, no negotiations or repairs.
-
2017-09-01$59,000 433-char remark
Show marketing remark (433 chars)
This quaint modified cape is currently being used as an investment property. Offering 2/3 bedrooms, 1 bath, eat in kitchen, living room, large porch, small backyard. Very affordable property and currently collects $900 monthly with nothing included. Roof, windows and electrical upgrades in 2010. Plumbing redone in 2004. Vinyl sided and vinyl windows make this property low maintenance. Being sold as is, no negotiations or repairs.
-
2017-08-29historical
-
2017-05-29$72,000
-
2016-12-30historical
-
2016-11-30$82,400
-
2016-04-23historical
-
2015-07-29$69,900
-
2011-11-23soldstatus $40,000
-
2011-04-06$50,000
-
2002-06-06soldstatus $236,000
-
2002-05-23soldstatus $64,500
-
2002-04-23$69,000
-
2002-03-26historical
-
2002-03-14soldstatus $21,000
-
2002-02-11$35,000
-
2002-02-11$35,000
-
2001-05-09historical
-
2000-04-12$129,000
-
1987-05-22soldstatus $110,000
ⓘ Source: listings_history table (triggers on properties + properties_extension) + one-shot
backfill from property_details.listing_events for pre-trigger history.
Tax reassessment forecast MA · Partial reset (capped growth)
- Current annual tax
- $1,442 · $120/mo
- Projected year-2 tax
- $1,827 · $152/mo
- Expected delta
- +$385/yr (+$32/mo · 26.7%)
ⓘ Screening estimate from a state-policy table — verify with the county assessor before closing.
Climate risk First Street
- Flood 4/10 Moderate FEMA zone X · 23% chance over 30 yrs
- Wildfire 3/10 Moderate
- Heat 2/10 Low 7 d/yr ≥91°F today · 16 d/yr by 30 yrs out
- Wind 4/10 Moderate 9% chance of damaging wind over 30 yrs
- Air quality 2/10 Low 1 unhealthy d/yr today · 1 by 30 yrs out
Nearby sold comps map
Loading sold comps map…
Walkable amenities ~0.75 mi
Loading nearby amenities…
Taxation est. · year 1
- Rental income
- $20,688
- − Mortgage interest
- −$10,077
- − Property taxes
- −$1,442
- − Insurance
- −$900
- − Repairs & maintenance
- −$1,655
- − Management
- −$1,655
- − Depreciation
- −$5,233
- Taxable loss
- −$274
- Est. tax savings @ 24.0%
- +$66
- After-tax cash flow
- $2,747/yr
For passive investors: Depreciation is non-cash, so a rental often shows a tax loss while cash-flowing — sheltering income. Rental losses are passive: they offset passive income freely, and up to $25,000/yr can offset ordinary (W-2) income if you actively participate and your MAGI is under $100k (phasing out to $0 by $150k); unused losses carry forward. On sale, claimed depreciation is recaptured at up to 25%, and gains may owe capital-gains tax (a 1031 exchange can defer both). Figures are a year-1 estimate at your 24.0% rate — not tax advice; consult a CPA.
Schools (NCES district)
- District
- Pittsfield
- NCES district ID
- 2509630
- Math proficiency
- 19% ▼ -10.00%
- Reading proficiency
- 34% ▼ -2.00%
- Median HH income
- $44,032
- Composite
- 22.67/100
- National rank
- #8046
- State rank
- #272 of 302 in MA
Livability — Pittsfield
- Score
- 75/100
- State rank
- #70
- US rank
- #3820
Category grades
Schools grade is shown separately in the Schools card above.
Census & demographics
- Census place
- Pittsfield, MA
- County
- Berkshire County · 44,848 people
- City population
- 44,848
- Metro
- Pittsfield, MA
- Population (ZIP)
- 44,848
- Household income
- $71,093
- Rent vs Own
- Severe rent burden
- 1580.0
Population outlook (Berkshire County) Hauer SSP2
- Today (2025)
- 119,723 people
- By 2030
- 114,608 · -4.3%
- By 2040
- 102,806 · -14.1%
- By 2050
- 91,305 · -23.7%
- By 2075
- 71,517 · -40.3%
- By 2100
- 57,988 · -51.6%
Race, ethnicity, and origin ACS 2023
- Neighborhood character
- Predominantly White (78%)
- Race & ethnicity
- White 78% Two or more races 10% Hispanic / Latino 9% Black 5% Asian 1%
- Hispanic origin (detail)
- Puerto Rican 3%
- Common ancestry
- Lithuanian 8% Romanian 6% Slovak 2%
- Foreign-born
- 7% · Canada, Jamaica
- Languages at home
- 90% English-only · Spanish 6% Other Indo-European 1% Russian/Polish/Slavic 1%
Political lean MEDSL · Berkshire
- 2024 margin
- Solid D (+39.9) · D 68.9% · R 29.0% · Other 2.1%
- 2008→2024 swing
- -12.5pp toward R · 2008: 52.4pp · 2024: 39.9pp
- All cycles
- 2024: D+39.9 2020: D+47.1 2016: D+41.5 2012: D+53.7 2008: D+52.4
Not yet ingested
- Civics
- —
Market trends
- HPI YoY
- ▼ -199.88%
- Current HPI
- 283.3421
- Rent YoY
- ▲ 7.72%
- Metro
- Pittsfield, MA
- State GDP YoY
- ▲ 2.28%
- F500 in state
- 38
Industry mix (Fortune 500 HQ in MA)
| Industry | F500 HQs | Revenue |
|---|---|---|
| Technology | 3 | $17B |
|
||
| Insurance | 2 | $84B |
|
||
| Retail | 2 | $76B |
|
||
| Life Sciences | 1 | $43B |
|
||
| Energy Technology | 1 | $31B |
|
||
| Aerospace / Defense | 1 | $18B |
|
||
Price history
+63.5% since first listed25 events — show timeline
- 2026-05-19 Relisted — BCMLS
- 2026-03-27 Pending — BCMLS
- 2026-03-05 Listed $179,900 BCMLS
- 2021-06-25 Sold (MLS) $75,000 BCMLS
- 2021-04-30 Listed $72,900 BCMLS
- 2017-11-16 Sold (MLS) $59,000 BCMLS
- 2017-09-01 Listed $59,000 BCMLS
- 2017-08-29 Listing Removed — BCMLS
- 2017-05-29 Listed $72,000 BCMLS
- 2016-12-30 Listing Removed — BCMLS
- 2016-11-30 Listed $82,400 BCMLS
- 2016-04-23 Listing Removed — BCMLS
- 2015-07-29 Listed $69,900 BCMLS
- 2011-11-23 Sold (MLS) $40,000 BCMLS
- 2011-04-06 Listed $50,000 BCMLS
- 2002-06-06 Sold (Public Records) $236,000 Public Records
- 2002-05-23 Sold (MLS) $64,500 BCMLS
- 2002-04-23 Listed $69,000 BCMLS
- 2002-03-26 Listing Removed — BCMLS
- 2002-03-14 Sold (MLS) $21,000 BCMLS
- 2002-02-11 Listed $35,000 BCMLS
- 2002-02-11 Listed $35,000 BCMLS
- 2001-05-09 Listing Removed — BCMLS
- 2000-04-12 Listed $129,000 BCMLS
- 1987-05-22 Sold (Public Records) $110,000 Public Records
Property tax history
+4.7%/yrLatest (2023): $1,442 · +5.0% YoY. Source: county tax records.
Cash-flow waterfall
monthlySold comps — $/sqft
last 12 mo · ≤1 miLoading sold comps…