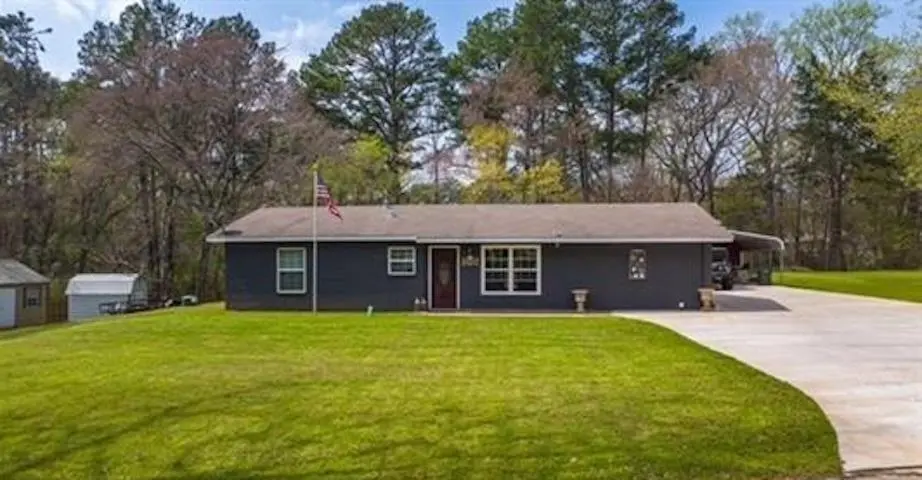
11300 County Road 2326 · New Chapel Hill, TX
Flood risk 1/10 · Minimal
- FEMA flood zone
- X (unshaded)
- Chance of flooding over 30 yrs
- 0.0%
- Est. flood insurance / yr
- $507 – $1,088
Fire risk 3/10 · Minor
- Est. fire insurance / yr
- $1,222 – $2,270
Heat risk 6/10 · Moderate
- Hot days now (above 109°F)
- 7 days/yr
- Hot days in 30 yrs
- 25 days/yr
Wind risk 6/10 · Moderate
- Chance of severe wind over 30 yrs
- 65.0%
Air-quality risk 2/10 · Minimal
- Unhealthy air days now
- 0 days/yr
- Unhealthy air days in 30 yrs
- 1 days/yr
Risk factors via First Street. Map © Google.
Why this score? — see what drove the D grade
The composite is a weighted blend of 9 inputs, each scored 0–100. Each bar is that input's sub-score; the figure is the points it added to the 100-point composite (weight × sub-score).
- Cash flow +14.7/30.0
- ARV discount +7.5/15.0
- DSCR +4.5/10.0
- 1% rule +3.6/10.0
- Rent growth +3.1/5.0
- Livability +2.9/5.0
- Schools +2.5/10.0
- Condition / age +2.5/5.0
- Appreciation +0.0/10.0
$219,000
🖨 Deal sheet (PDF) 📄 Offer letter ✓ Due diligence
Listing remarks MLS
Enjoy the best of East Texas living with this inviting property situated on approximately 0.657 acres just minutes from Tyler. Tucked away on quiet County Road 2326, this home offers a comfortable layout filled with natural light and a welcoming atmosphere. The spacious lot provides plenty of room to enjoy the outdoors, whether relaxing beneath the mature shade trees, entertaining guests, gardening, or expanding the property with a workshop or additional outdoor features. With a balance of privacy and convenience, this property offers the flexibility to fit a variety of lifestyles. Conveniently located near shopping, dining, healthcare, and everyday amenities while still capturing the peaceful feel of country living. A great opportunity to enjoy space, comfort, and accessibility in a desirable East Texas setting.
Key facts
- Natural light
- Outdoor features
- Workshop
Tags
Property features AI
Finance
- Other: Listing is active with exclusive right to sell agreement; Possession at closing/funding
- Financial info: Accepts Cash, Conventional, FHA, USDA loan, VA loan; Treat as clear loan type; No second mortgage
- HOA & community: No homeowners association
Exterior
- Parking: Covered carport with 2 spaces
- Utilities: Aerobic septic
- Home design: Single-family residence; One story; Residential property; Not attached to another property; Multiple parcel ID
- Construction: Built in 1972; Brick and stone veneer exterior; Composition roof; Slab foundation
- Exterior features: Dog run; Wood fencing; Lot approximately 0.657 acres; Will not subdivide
Interior
- Kitchen: Dishwasher; Electric oven; Electric range; Microwave; Electric water heater
- Bedrooms: 3 bedrooms (primary bedroom on main level)
- Bathrooms: 1 full bathroom
- Heating & cooling: Central heating; Gas jets for heating; Central air conditioning; Electric cooling
- Interior features: Cable TV available; Eat-in kitchen; One living area; Total of 4 rooms
- Laundry & utility: Washer/dryer hookups (appliances listed include electric water heater)
Neighborhood map
What this means for you Summary
Snapshot
- This is a 3-bed/1.0-bath single-family listed at $219k.
Deal economics
- At list price, monthly cash flow is $56 ($667/yr) — positive.
- The deal already cash-flows at list — no discount required.
- To meet the 1% rule (rent ≥ 1% of price), the offer needs to be $188k (14.1% below list).
- Recommended offer: $188k (14.1% below list) — sets the bar for 1% rule.
Location & tenants
- Location reads 57/100 on livability (#1,275 in TX) — a working-class tenant base; expect higher turnover. Strengths: cost of living A+; Watch: employment D, schools F, crime D-.
- Chapel Hill ISD (rural): math 25% / reading 33% proficiency, ranked #650 of 826 in TX (top 79%) — low school quality limits family demand, transient renter base, plan for 1-2y turnover; 64% free/reduced lunch — lower-income household profile, screen leases tightly.
- Market conditions: Rents rising (+2.4%/yr); 188 active listings in the ZIP; solid renter incomes; 595 units permitted in Smith County in 2024 (45 in 5+ unit buildings).
Forward outlook
- Local home prices are declining (-3.0%/yr); year-one equity from $2k of loan paydown is wiped out by about $7k of value loss. Plan a longer hold.
- Smith County population projected at +24% by 2050 — long-run rental-demand tailwind backs the buy-and-hold thesis.
Negotiation context
- It's been on market 16 days — a 2% lower offer ($216k) is reasonable based on typical stale-listing flexibility.
- 8 sale attempts since 4y ago with the ask held roughly flat each time — persistent listings suggest the price (not the market) is what's stuck; bring a comps-based counter.
Risks & watch-outs
- Climate carrying-cost: major wind risk, 65% chance of damaging wind over 30y; extreme-heat days projected 7→25/yr by 2055 (HVAC capex compounding) — expect insurance premiums to compound above CPI over the hold.
Questions for the listing agent
- Built in 1972 — when were the roof, HVAC, electrical panel, plumbing, and water heater last replaced?
- Is there a deadline driving the sale (1031 exchange, divorce, estate, relocation)? That informs how much negotiation room exists.
- Schools are F-rated, which usually means shorter tenancies and higher turnover. Who's the typical renter profile here, and what's been the actual vacancy rate?
- Crime grade is D in this area — have there been break-ins, vandalism, or insurance claims at this property in the last 3 years? What carrier currently insures it and at what premium?
- The area grade is low — what's the realistic commute time and amenity access for the typical tenant pool here? Any planned neighborhood developments (good or bad) we should know about?
- What's the average days-on-market for RENTAL listings here right now (not sales)? A rising rental-DOM trend means longer vacancies and softer asking-rent achievability than the comps imply.
- What's the recent tenant-quality profile in this submarket — average credit score on applications, eviction rate, late-payment / NSF rate, and stable-employment percentage? A property-management company in the area should have these aggregated.
- How much new for-sale + rental construction is in the pipeline within 1–3 miles? Heavy new supply typically softens prices + rents 12–24 months out; constrained supply supports both.
Investment metrics
- 1% rule
- 0.86% ✗
- Cap rate
- 6.60%
- Cash-on-cash
- 1.09%
- DSCR
- 1.05
- GRM
- 9.7
CMA / ARV
No comps found within radius.
Projected returns pro-forma
-3.0% appreciation · 2.37% rent growth · sell at horizon
- IRR
- -15.3%
- Equity multiple
- 0.46×
- Total profit
- $-33,156
- Equity at exit
- $32,654
- IRR
- -7.8%
- Equity multiple
- 0.52×
- Total profit
- $-29,208
- Equity at exit
- $18,935
Cash invested: $61,320 (down + closing). Projections, not guarantees.
Landlord ↔ Tenant lean methodology
- Overall (STATE)
- 87 Strongly Landlord-Friendly
- State Texas
- 87 Strongly Landlord-Friendly · R+5
- County
- — inherits STATE
- City
- — inherits STATE
ZIP-level market 75707
- Home prices YoY
- -24.8%
- Rents YoY
- 2.4%
- Active inventory
- 188
- Price-to-rent
- 9.7×
Monthly cashflow live
- Estimated rent
- $1,881 medium interval (Pro) →
- Mortgage (P&I)
- −$1,148
- Tax from tax record
- −$191 /mo · $2,291/yr
- Insurance
- −$91
- HOA
- −$0
- Vacancy / Maint / Mgmt
- −$395
- Net cashflow
- $56
Break-even live
Sensitivity live
| Price | -10% $180 | -5% $118 | +0% $56 | +5% $-6 | +10% $-68 |
|---|---|---|---|---|---|
| Rent | -10% $-93 | -5% $-19 | +0% $56 | +5% $130 | +10% $204 |
| Rate | -1.0pp $166 | -0.5pp $111 | base $56 | +0.5pp $-1 | +1.0pp $-59 |
UW: 25.0% down · 7.5% · 30yr · 1.5% tax · 5.0% vac · 8.0% maint · 8.0% mgmt
Financing live
Cash to close
- Down payment
- $54,750
- Closing costs
- $6,570
- Reserves months
- —
- Total cash needed
- —
Loan-product check · same deal, 3 products live
Conventional
25% down · 7.5% · 30yr
- Down + closing
- —
- Monthly P&I
- —
- Monthly cashflow
- —
- DSCR
- —
- Eligible?
- —
Personal DTI + credit; lowest rate.
DSCR
20% down · 8.5% · 30yr
- Down + closing
- —
- Monthly P&I
- —
- Monthly cashflow
- —
- DSCR
- —
- Eligible?
- —
No personal income docs; deal must DSCR.
Hard money
10% down · 12.0% · 12mo
- Down + closing
- —
- Monthly P&I
- —
- Monthly cashflow
- —
- DSCR
- —
- Eligible?
- —
Short-term bridge; refi at stabilization.
Listing history 12 events
-
2026-06-19days on market $219,000 Active 16 DOM
-
2026-06-18days on market $219,000 Active 15 DOM
-
2026-06-17days on market $219,000 Active 14 DOM
-
2026-06-16days on market $219,000 Active 13 DOM
-
2026-06-15days on market $219,000 Active 12 DOM
-
2026-06-14days on market $219,000 Active 10 DOM
-
2026-06-13days on market $219,000 Active 9 DOM
-
2026-06-10days on market $219,000 Active 6 DOM
-
2026-06-09days on market $219,000 Active 5 DOM
-
2026-06-08days on market $219,000 Active 4 DOM
-
2026-06-07remarks 699-char remark
-
2026-06-07$219,000 Active 3 DOM
ⓘ Source: listings_history table (triggers on properties + properties_extension) + one-shot
backfill from property_details.listing_events for pre-trigger history.
Tax reassessment forecast TX · Resets to sale price
- Current annual tax
- $2,291 · $191/mo
- Projected year-2 tax
- $4,008 · $334/mo
- Expected delta
- +$1,717/yr (+$143/mo · 74.9%)
ⓘ Screening estimate from a state-policy table — verify with the county assessor before closing.
Climate risk First Street
- Flood 1/10 Low FEMA zone X (unshaded) · 0% chance over 30 yrs
- Wildfire 3/10 Moderate
- Heat 6/10 Major 7 d/yr ≥109°F today · 25 d/yr by 30 yrs out
- Wind 6/10 Major 65% chance of damaging wind over 30 yrs
- Air quality 2/10 Low 0 unhealthy d/yr today · 1 by 30 yrs out
Nearby sold comps map
Loading sold comps map…
Walkable amenities ~0.75 mi
Loading nearby amenities…
Taxation est. · year 1
- Rental income
- $22,575
- − Mortgage interest
- −$12,267
- − Property taxes
- −$2,291
- − Insurance
- −$1,095
- − Repairs & maintenance
- −$1,806
- − Management
- −$1,806
- − Depreciation
- −$6,371
- Taxable loss
- −$3,061
- Est. tax savings @ 24.0%
- +$735
- After-tax cash flow
- $1,401/yr
For passive investors: Depreciation is non-cash, so a rental often shows a tax loss while cash-flowing — sheltering income. Rental losses are passive: they offset passive income freely, and up to $25,000/yr can offset ordinary (W-2) income if you actively participate and your MAGI is under $100k (phasing out to $0 by $150k); unused losses carry forward. On sale, claimed depreciation is recaptured at up to 25%, and gains may owe capital-gains tax (a 1031 exchange can defer both). Figures are a year-1 estimate at your 24.0% rate — not tax advice; consult a CPA.
Schools (NCES district)
- District
- Chapel Hill ISD
- NCES district ID
- 4813650
- Math proficiency
- 25% ▼ -10.00%
- Reading proficiency
- 33% ▼ -5.00%
- Median HH income
- $43,891
- Composite
- 24.76/100
- National rank
- #7603
- State rank
- #650 of 826 in TX
Livability — New Chapel Hill
- Score
- 57/100
- State rank
- #1275
- US rank
- #22160
Category grades
Schools grade is shown separately in the Schools card above.
Census & demographics
- County
- Smith County · 180,570 people
- City population
- 16,355
- Metro
- Tyler, TX
- Population (ZIP)
- 17,532
- Household income
- $84,954
- Rent vs Own
- Severe rent burden
- 304.0
Population outlook (Smith County) Hauer SSP2
- Today (2025)
- 248,890 people
- By 2030
- 261,665 · +5.1%
- By 2040
- 286,114 · +15.0%
- By 2050
- 308,006 · +23.8%
- By 2075
- 354,171 · +42.3%
- By 2100
- 372,828 · +49.8%
Race, ethnicity, and origin ACS 2023
- Neighborhood character
- Predominantly White (72%)
- Race & ethnicity
- White 72% Hispanic / Latino 14% Black 10% Two or more races 6% Asian 2%
- Hispanic origin (detail)
- Mexican 13%
- Common ancestry
- Slovak 1% Italian 1% Iranian 1%
- Foreign-born
- 5% · Canada
- Languages at home
- 88% English-only · Spanish 10% Other Indo-European 1% Tagalog/Filipino 1%
Political lean MEDSL · Smith
- 2024 margin
- Solid R (+45.1) · D 27.0% · R 72.1%
- 2008→2024 swing
- -5.6pp toward R · 2008: -39.5pp · 2024: -45.1pp
- All cycles
- 2024: R+45.1 2020: R+39.4 2016: R+43.9 2012: R+46.9 2008: R+39.5
Not yet ingested
- Civics
- —
Market trends
- HPI YoY
- ▼ -64.97%
- Current HPI
- 196.577
- Rent YoY
- ▲ 2.37%
- Metro
- Tyler, TX
- State GDP YoY
- ▲ 3.95%
- F500 in state
- 110
Industry mix (Fortune 500 HQ in TX)
| Industry | F500 HQs | Revenue |
|---|---|---|
| Energy | 16 | $1,198B |
|
||
| Technology | 5 | $198B |
|
||
| Engineering / Construction | 4 | $72B |
|
||
| Energy Services | 3 | $60B |
|
||
| Utilities | 3 | $41B |
|
||
| Healthcare | 2 | $330B |
|
||
Price history
-14.5% since first listed14 events — show timeline
- 2026-06-04 Listed $219,000 NTREIS
- 2026-06-04 Listed $219,000 LAAR
- 2026-06-03 Listed $219,000 GTAR
- 2025-12-15 Listed $235,000 LAAR
- 2025-12-15 Listed $235,000 NTREIS
- 2023-06-27 Listing Removed — NTREIS
- 2023-02-28 Price Changed $256,000 NTREIS
- 2022-12-27 Listed $260,000 NTREIS
- 2022-12-27 Listed $256,000 GTAR
- 2022-12-27 Listed $256,000 LAAR
- 2019-12-26 Sold (Public Records) — Public Records
- 2019-12-26 Sold (Public Records) — Public Records
- 2009-08-27 Sold (Public Records) — Public Records
- 2007-06-26 Sold (Public Records) — Public Records
Property tax history
+6.0%/yrLatest (2024): $2,291 · -12.6% YoY. Source: county tax records.
Cash-flow waterfall
monthlySold comps — $/sqft
last 12 mo · ≤1 miLoading sold comps…