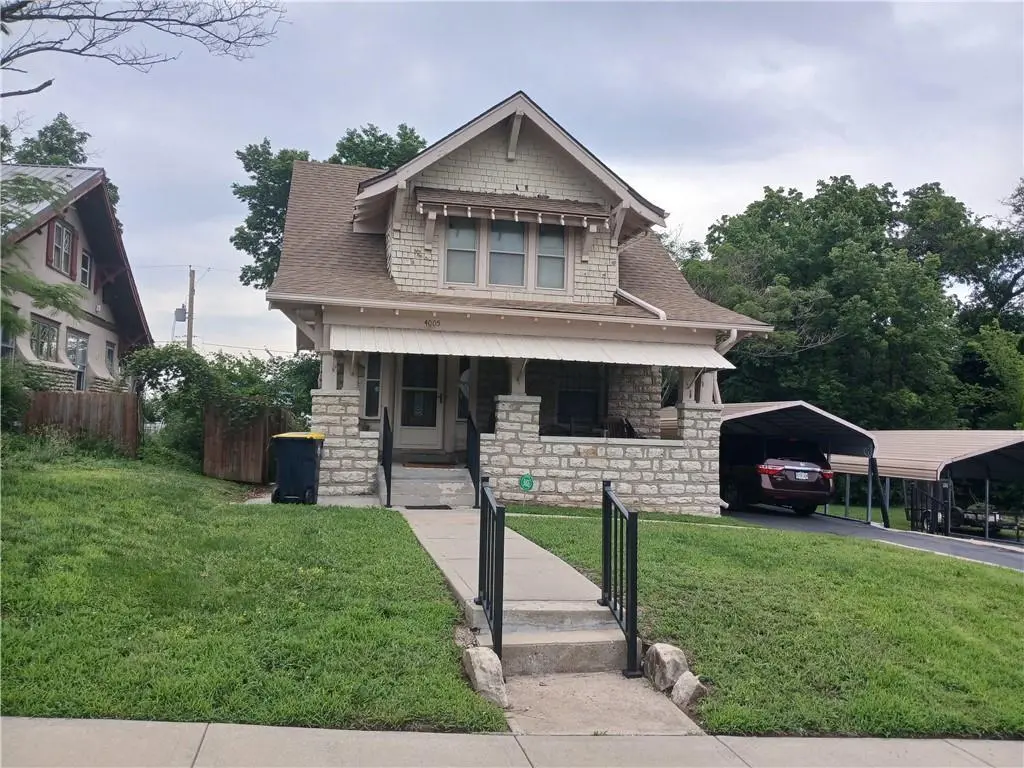
4005 Euclid Ave · Kansas City, MO
Flood risk 1/10 · Minimal
- FEMA flood zone
- X (unshaded)
- Chance of flooding over 30 yrs
- 0.0%
- Est. flood insurance / yr
- $473 – $860
Fire risk 1/10 · Minimal
- Est. fire insurance / yr
- $1,054 – $1,958
Heat risk 4/10 · Minor
- Hot days now (above 106°F)
- 7 days/yr
- Hot days in 30 yrs
- 17 days/yr
Wind risk 2/10 · Minimal
- Chance of severe wind over 30 yrs
- —
Air-quality risk 3/10 · Minor
- Unhealthy air days now
- 2 days/yr
- Unhealthy air days in 30 yrs
- 3 days/yr
Risk factors via First Street. Map © Google.
Why this score? — see what drove the C- grade
The composite is a weighted blend of 9 inputs, each scored 0–100. Each bar is that input's sub-score; the figure is the points it added to the 100-point composite (weight × sub-score).
- Cash flow +25.9/30.0
- DSCR +8.7/10.0
- 1% rule +5.7/10.0
- Livability +3.9/5.0
- Rent growth +3.6/5.0
- Condition / age +2.5/5.0
- Schools +1.5/10.0
- ARV discount +0.0/15.0
- Appreciation +0.0/10.0
$140,000
🖨 Deal sheet 📄 Offer letter ✓ Due diligence
Key facts
- 0.26 acre lot
- Built 1909
- Listed 4 days
Property features AI
Finance
- Other: Living area approximately 1,974 (total); above grade finished area 1,302; below grade finished area 672; Lot approximately 11,398 square feet; Listed age: 101+ years
- HOA & community: No association fees
Exterior
- Parking: Covered, detached parking
- Security: Security system
- Utilities: Public water; Public sewer
- Home design: Single-family residential; 2-story floor plan; Residential property
- Construction: Block construction; Tile roof; Concrete basement
- Exterior features: Metal fencing; Paved road access
Interior
- Kitchen: Disposal; Refrigerator
- Bedrooms: 3 bedrooms (all carpet; bedrooms located on second level)
- Flooring: Carpet; Laminate
- Bathrooms: 2 full bathrooms (both with all carpet; located on second level)
- Heating & cooling: Electric heating; Electric cooling (has cooling)
- Interior features: Ceiling fan(s); Security system
- Laundry & utility: Washer and dryer included; Laundry in basement and additional laundry location
Neighborhood map
What this means for you Summary
Snapshot
- This is a 3-bed/1.0-bath single-family listed at $140k.
Deal economics
- At list price, monthly cash flow is $345 ($4k/yr) — positive.
- The deal already cash-flows at list — no discount required.
- Meets the 1% rule at list price ($1k rent vs $140k).
- Cap rate 9.3% vs local median 3.9% in Kansas City — top-decile yield for the area; either an underpriced asset or a hidden risk that comps aren't pricing in. Stress-test before assuming the spread holds.
Location & tenants
- Location reads 78/100 on livability (#28 in MO, #2,671 nationally) — a middle-class / working-renter tenant base. Strengths: amenities A+, commute A+, cost of living A+; Watch: crime F.
- Kansas City 33 (urban): math 12% / reading 24% proficiency, ranked #308 of 324 in MO (top 95%) — low school quality limits family demand, transient renter base, plan for 1-2y turnover; 75% free/reduced lunch — lower-income household profile, screen leases tightly.
- Zoned schools: Central High School (math 2% / reading 17%, grade F, #507 of 521 statewide, top 98%, 535 students, 99% FRL) — zoned schools average 99% FRL vs 75% district-wide (24 pts higher); higher-poverty schools than district average — tighter screening recommended.
- Market conditions: Rents rising fast (+4.4%/yr); 187 active listings in the ZIP; 40 comparable units currently listed for rent nearby; rentals at typical pace (median 24d on market — plan ~3-4 weeks tenant-placement turnaround); lower-income renter base — watch delinquency; 4,002 units permitted in Jackson County in 2024 (2,271 in 5+ unit buildings).
- This rent runs 43% of the median local income ($42k/yr) — at the standard rent-burdened threshold; future hikes will face affordability resistance.
Forward outlook
- Local home prices are declining (-3.0%/yr); year-one equity from $968 of loan paydown is wiped out by about $4k of value loss. Plan a longer hold.
- Jackson County population projected at +4% by 2050 — modest demand growth; plan on rents tracking national, not racing it.
- At projected returns (-3.0% appreciation + 4.4% rent growth), your $39k cash investment doubles in ~9 years — after that, you're playing with house money.
Negotiation context
- Only 4 days on market — expect competitive offers; lowballing is unlikely to land.
Risks & watch-outs
- Watch-outs: built in 1909 — expect roof / HVAC / electrical / plumbing capex.
Questions for the listing agent
- Built in 1909 — when were the roof, HVAC, electrical panel, plumbing, and water heater last replaced?
- Is there a deadline driving the sale (1031 exchange, divorce, estate, relocation)? That informs how much negotiation room exists.
- Crime grade is F in this area — have there been break-ins, vandalism, or insurance claims at this property in the last 3 years? What carrier currently insures it and at what premium?
- What's the average days-on-market for RENTAL listings here right now (not sales)? A rising rental-DOM trend means longer vacancies and softer asking-rent achievability than the comps imply.
- What's the recent tenant-quality profile in this submarket — average credit score on applications, eviction rate, late-payment / NSF rate, and stable-employment percentage? A property-management company in the area should have these aggregated.
- How much new for-sale + rental construction is in the pipeline within 1–3 miles? Heavy new supply typically softens prices + rents 12–24 months out; constrained supply supports both.
Investment metrics
- 1% rule
- 1.07% ✓
- Cap rate
- 9.25%
- Cash-on-cash
- 10.57%
- DSCR
- 1.47
- GRM
- 7.8
CMA / ARV
- ARV (on-the-fly)
- $117,180
- Comps found
- 12
Show comp detail 12 sales within ~0.75 mi
| Address | Dist | Beds/Ba | Sqft | Sold | Price | $/sf | Match |
|---|---|---|---|---|---|---|---|
| 1605 E 37th St | 0.45mi | 3/1.5 | 1,338 (+3%) | 4mo | $115,000 | $86 | 69 |
| 3910 Wabash Ave | 0.31mi | 4/2.0 (+1) | 1,366 (+5%) | 1mo | $10,000 | $7 | 68 |
| 2809 E 39th St | 0.53mi | 3/1.0 | 1,279 (-2%) | 6mo | $114,900 | $90 | 68 |
| 4444 Olive St | 0.63mi | 3/1.5 | 1,291 (-1%) | 1mo | $120,000 | $93 | 66 |
| 2112 E 36th St | 0.54mi | 3/2.0 | 1,343 (+3%) | 2mo | $150,000 | $112 | 64 |
| 3800 Chestnut Ave | 0.54mi | 3/1.0 | 1,470 (+13%) | 1mo | $79,900 | $54 | 53 |
| 3920 S Benton Ave | 0.54mi | 2/1.5 (-1) | 1,160 (-11%) | 5mo | $65,000 | $56 | 46 |
| 3509 Brooklyn Ave | 0.62mi | 4/2.0 (+1) | 1,418 (+9%) | 3mo | $130,000 | $92 | 45 |
| 4200 Agnes Ave | 0.64mi | 4/2.0 (+1) | 1,399 (+8%) | 6mo | $189,000 | $135 | 44 |
| 3416 Park Ave | 0.74mi | 3/1.5 | 1,436 (+10%) | 5mo | $125,000 | $87 | 42 |
| 3620 Agnes St | 0.75mi | 3/1.0 | 1,444 (+11%) | 5mo | $95,000 | $66 | 42 |
| 1607 E 37th St | 0.44mi | 4/2.5 (+1) | 1,496 (+15%) | 5mo | $198,300 | $133 | 40 |
Match score weights: distance 35% · size 25% · config 20% · recency 20%. Top-matched comps best support the ARV.
Projected returns pro-forma
-3.0% appreciation · 4.42% rent growth · sell at horizon
- IRR
- 0.9%
- Equity multiple
- 1.04×
- Total profit
- $1,415
- Equity at exit
- $20,874
- IRR
- 11.8%
- Equity multiple
- 1.98×
- Total profit
- $38,470
- Equity at exit
- $12,105
Cash invested: $39,200 (down + closing). Projections, not guarantees.
Landlord ↔ Tenant lean methodology
- Overall (STATE)
- 81 Strongly Landlord-Friendly
- State Missouri
- 81 Strongly Landlord-Friendly · R+10
- County
- — inherits STATE
- City
- — inherits STATE
ZIP-level market 64130
- Home prices YoY
- -21.5%
- Rents YoY
- 4.4%
- Active inventory
- 187
- Price-to-rent
- 7.8×
Monthly cashflow live
- Estimated rent
- $1,496 high interval (Pro) →
- Mortgage (P&I)
- −$734
- Tax from tax record
- −$44 /mo · $527/yr
- Insurance
- −$58
- HOA
- −$0
- Vacancy / Maint / Mgmt
- −$314
- Net cashflow
- $345
Break-even live
UW: 25.0% down · 7.5% · 30yr · 1.5% tax · 5.0% vac · 8.0% maint · 8.0% mgmt
Financing live
Cash to close
- Down payment
- $35,000
- Closing costs
- $4,200
- Reserves months
- —
- Total cash needed
- —
Loan-product check · same deal, 3 products live
Conventional
25% down · 7.5% · 30yr
- Down + closing
- —
- Monthly P&I
- —
- Monthly cashflow
- —
- DSCR
- —
- Eligible?
- —
Personal DTI + credit; lowest rate.
DSCR
20% down · 8.5% · 30yr
- Down + closing
- —
- Monthly P&I
- —
- Monthly cashflow
- —
- DSCR
- —
- Eligible?
- —
No personal income docs; deal must DSCR.
Hard money
10% down · 12.0% · 12mo
- Down + closing
- —
- Monthly P&I
- —
- Monthly cashflow
- —
- DSCR
- —
- Eligible?
- —
Short-term bridge; refi at stabilization.
Rent comps 40 comps
| Address | Beds | Baths | Sqft | Rent | $/sqft | DOM | Units | Dist |
|---|---|---|---|---|---|---|---|---|
| 4014 Park Ave Kansas City, MO | 3.0 | 2.0 | 1271 | $1,273 | $1.00 | 43d | 1 | 0.15mi |
| 4112 Park Ave Kansas City, MO | 4.0 | 2.0 | 1700 | $1,800 | $1.06 | 14d | 1 | 0.22mi |
| 4107 Olive St Kansas City, MO | 3.0 | 1.5 | 1271 | $1,578 | $1.24 | 7d | 1 | 0.28mi |
| 3902 Wabash Ave Kansas City, MO | 4.0 | 2.0 | 1400 | $1,850 | $1.32 | 43d | 1 | 0.28mi |
| 4219 Woodland Ave Kansas City, MO | 4.0 | 2.0 | 1566 | $1,900 | $1.21 | 2d | 1 | 0.38mi |
| 3710 Wabash Ave Unit 2S Kansas City, MO | 2.0 | 1.0 | 875 | $850 | $0.97 | 23d | 1 | 0.46mi |
| 3609 Wayne Ave Kansas City, MO | 3.0 | 1.5 | 1118 | $1,900 | $1.70 | 23d | 1 | 0.53mi |
| 3817 S Benton Ave Kansas City, MO | 4.0 | 1.5 | 1380 | $1,650 | $1.20 | 23d | 1 | 0.57mi |
| 4119 S Benton Ave Kansas City, MO | 4.0 | 2.0 | 1700 | $1,800 | $1.06 | 43d | 1 | 0.58mi |
| 4401 Wayne Ave Kansas City, MO | 2.0 | 1.5 | 955 | $1,300 | $1.36 | 23d | 1 | 0.58mi |
| 4228 Virginia Ave Kansas City, MO | 3.0 | 1.0 | 1200 | $1,250 | $1.04 | 10d | 1 | 0.58mi |
| 4232 Virginia Ave Unit 3 Kansas City, MO | 3.0 | 1.0 | 1296 | $1,100 | $0.85 | 12d | 1 | 0.59mi |
| 4117 Forest Ave Kansas City, MO | 2.0 | 2.0 | 1300 | $1,390 | $1.07 | 23d | 1 | 0.60mi |
| 4119 Forest Ave Kansas City, MO | 2.0 | 1.0 | 950 | $1,400 | $1.47 | 12d | 1 | 0.60mi |
| 2002 E 35th St Kansas City, MO | 3.0 | 2.0 | 1426 | $1,295 | $0.91 | 7d | 1 | 0.63mi |
| 2018 E 35th St Kansas City, MO | 3.0 | 2.0 | 1502 | $1,800 | $1.20 | 3d | 1 | 0.63mi |
| 3840 Bellefontaine Ave Kansas City, MO | 3.0 | 1.0 | 1500 | $1,500 | $1.00 | 16d | 1 | 0.65mi |
| 4116 Bellefontaine Ave Kansas City, MO | 3.0 | 1.0 | 1234 | $1,000 | $0.81 | 23d | 1 | 0.66mi |
| 3630 Agnes Ave Kansas City, MO | 3.0 | 2.0 | 1448 | $1,500 | $1.04 | 10d | 1 | 0.70mi |
| 918 E 39th St Kansas City, MO | 2.0 | 1.0 | 1050 | $1,175 | $1.12 | 43d | 1 | 0.74mi |
| 4154 Harrison St Kansas City, MO | 2.0 | 1.0 | 1100 | $1,395 | $1.27 | 43d | 1 | 0.78mi |
| 3434 Chestnut Ave Kansas City, MO | 2.0 | 1.0 | 1512 | $1,100 | $0.73 | 10d | 1 | 0.79mi |
| 4144 College Ave Kansas City, MO | 3.0 | 1.0 | 1108 | $1,095 | $0.99 | 23d | 1 | 0.80mi |
| 4220 Harrison St Unit 1S Kansas City, MO | 3.0 | 2.0 | 1200 | $1,795 | $1.50 | 7d | 1 | 0.80mi |
| 1500 E 46th St Kansas City, MO | 1.0–3.0 | 1.0 | 803 | $1,275 | $1.59 | 43d | 1 | 0.83mi |
| 4013 Charlotte St Unit 1N Kansas City, MO | 2.0 | 1.0 | 900 | $1,200 | $1.33 | 23d | 1 | 0.83mi |
| 3524 Bellefontaine Ave Kansas City, MO | 3.0 | 1.0 | 1228 | $1,350 | $1.10 | 43d | 1 | 0.83mi |
| 4427 Agnes Ave Kansas City, MO | 3.0 | 1.0 | 1100 | $1,350 | $1.23 | 16d | 1 | 0.84mi |
| 3818 Indiana Ave Kansas City, MO | 3.0 | 1.5 | 1223 | $1,147 | $0.94 | 43d | 1 | 0.84mi |
| 1111 E Armour Blvd Kansas City, MO | 2.0 | 1.0–2.0 | 812 | $1,660 | $2.04 | 43d | 9 | 0.87mi |
| 1111 E Armour Blvd Kansas City, MO | 2.0 | 1.0–2.0 | 788 | $1,660 | $2.11 | 2d | 9 | 0.87mi |
| 820 E 43rd St Kansas City, MO | 2.0 | 1.0 | 900 | $985 | $1.09 | 17d | 1 | 0.88mi |
| 4534 S Benton Ave Kansas City, MO | 2.0 | 1.0 | 912 | $1,045 | $1.15 | 16d | 1 | 0.88mi |
| 4309 College Ave Kansas City, MO | 3.0 | 2.0 | 1040 | $1,550 | $1.49 | 16d | 1 | 0.89mi |
| 1108 E Armour Blvd Kansas City, MO | 2.0 | 1.0–2.0 | 773 | $1,745 | $2.26 | 2d | 11 | 0.90mi |
| 1108 E Armour Blvd Kansas City, MO | 2.0 | 1.0–2.0 | 780 | $1,745 | $2.24 | 43d | 5 | 0.90mi |
| 3233 Park Ave Unit 2 Kansas City, MO | 2.0 | 1.0 | 950 | $1,000 | $1.05 | 23d | 1 | 0.90mi |
| 3233 Park Ave Unit 1 Kansas City, MO | 2.0 | 1.0 | 950 | $1,075 | $1.13 | 43d | 1 | 0.90mi |
| 1025 E Armour Blvd Kansas City, MO | 2.0 | 1.0–2.0 | 779 | $1,815 | $2.33 | 43d | 22 | 0.91mi |
| 1025 E Armour Blvd Kansas City, MO | 2.0 | 1.0–2.0 | 784 | $1,835 | $2.34 | 2d | 20 | 0.91mi |
Listing history 3 events
-
2026-06-08status $140,000 Pending 4 DOM
-
2026-06-07days on market $140,000 Active 4 DOM
-
2026-06-05$140,000 Active 1 DOM
ⓘ Source: listings_history table (triggers on properties + properties_extension) + one-shot
backfill from property_details.listing_events for pre-trigger history.
Tax reassessment forecast MO · Resets to sale price
- Current annual tax
- $527 · $44/mo
- Projected year-2 tax
- $1,358 · $113/mo
- Expected delta
- +$831/yr (+$69/mo · 157.8%)
ⓘ Screening estimate from a state-policy table — verify with the county assessor before closing.
Climate risk First Street
- Flood 1/10 Low FEMA zone X (unshaded) · 0% chance over 30 yrs
- Wildfire 1/10 Low
- Heat 4/10 Moderate 7 d/yr ≥106°F today · 17 d/yr by 30 yrs out
- Wind 2/10 Low
- Air quality 3/10 Moderate 2 unhealthy d/yr today · 3 by 30 yrs out
Nearby sold comps map
Loading sold comps map…
Walkable amenities ~0.75 mi
Loading nearby amenities…
Taxation est. · year 1
- Rental income
- $17,950
- − Mortgage interest
- −$7,842
- − Property taxes
- −$527
- − Insurance
- −$700
- − Repairs & maintenance
- −$1,436
- − Management
- −$1,436
- − Depreciation
- −$4,073
- Taxable income
- $1,936
- Est. tax owed @ 24.0%
- −$465
- After-tax cash flow
- $3,679/yr
For passive investors: Depreciation is non-cash, so a rental often shows a tax loss while cash-flowing — sheltering income. Rental losses are passive: they offset passive income freely, and up to $25,000/yr can offset ordinary (W-2) income if you actively participate and your MAGI is under $100k (phasing out to $0 by $150k); unused losses carry forward. On sale, claimed depreciation is recaptured at up to 25%, and gains may owe capital-gains tax (a 1031 exchange can defer both). Figures are a year-1 estimate at your 24.0% rate — not tax advice; consult a CPA.
Schools (NCES district)
- District
- Kansas City 33
- NCES district ID
- 2916400
- Math proficiency
- 12% ▼ -8.00%
- Reading proficiency
- 24% ▬ 0.00%
- Median HH income
- $35,227
- Composite
- 14.8/100
- National rank
- #9387
- State rank
- #308 of 324 in MO
Livability — Kansas City
- Score
- 78/100
- State rank
- #28
- US rank
- #2671
Category grades
Schools grade is shown separately in the Schools card above.
Census & demographics
- Census place
- Kansas City, MO
- County
- Jackson County · 687,798 people
- City population
- 439,467
- Metro
- Kansas City, MO-KS
- Population (ZIP)
- 19,644
- Household income
- $42,221
- Rent vs Own
- Severe rent burden
- 1132.0
Population outlook (Jackson County) Hauer SSP2
- Today (2025)
- 719,589 people
- By 2030
- 731,456 · +1.6%
- By 2040
- 746,689 · +3.8%
- By 2050
- 749,289 · +4.1%
- By 2075
- 736,227 · +2.3%
- By 2100
- 668,210 · -7.1%
Race, ethnicity, and origin ACS 2023
- Neighborhood character
- Predominantly Black (80%)
- Race & ethnicity
- Black 80% White 9% Hispanic / Latino 8% Two or more races 6%
- Hispanic origin (detail)
- Mexican 5%
- Common ancestry
- Lithuanian 1% Swedish 0%
- Foreign-born
- 6% · Canada
- Languages at home
- 92% English-only · Spanish 7%
Political lean MEDSL · Jackson
- 2024 margin
- D (+19.3) · D 58.9% · R 39.5% · Other 1.6%
- 2008→2024 swing
- -6.1pp toward R · 2008: 25.4pp · 2024: 19.3pp
- All cycles
- 2024: D+19.3 2020: D+22.0 2016: D+16.6 2012: D+19.0 2008: D+25.4
Not yet ingested
- Civics
- —
Market trends
- HPI YoY
- ▼ -73.32%
- Current HPI
- 267.491
- Rent YoY
- ▲ 4.42%
- Metro
- Kansas City, MO-KS
- State GDP YoY
- ▲ 1.84%
- F500 in state
- 20
Industry mix (Fortune 500 HQ in MO)
| Industry | F500 HQs | Revenue |
|---|---|---|
| Healthcare | 1 | $163B |
|
||
| Insurance | 1 | $21B |
|
||
| Industrial Technology | 1 | $17B |
|
||
| Retail | 1 | $16B |
|
||
| Industrial Distribution | 1 | $10B |
|
||
| Utilities | 1 | $9B |
|
||
Price history
2 events — show timeline
- 2026-06-02 Listed $140,000 Heartland MLS as Distributed by MLS Grid
- 1990-10-15 Sold (Public Records) — Public Records
Property tax history
+3.4%/yrLatest (2025): $527 · -40.5% YoY. Source: county tax records.
Cash-flow waterfall
monthlySold comps — $/sqft
last 12 mo · ≤1 miLoading sold comps…