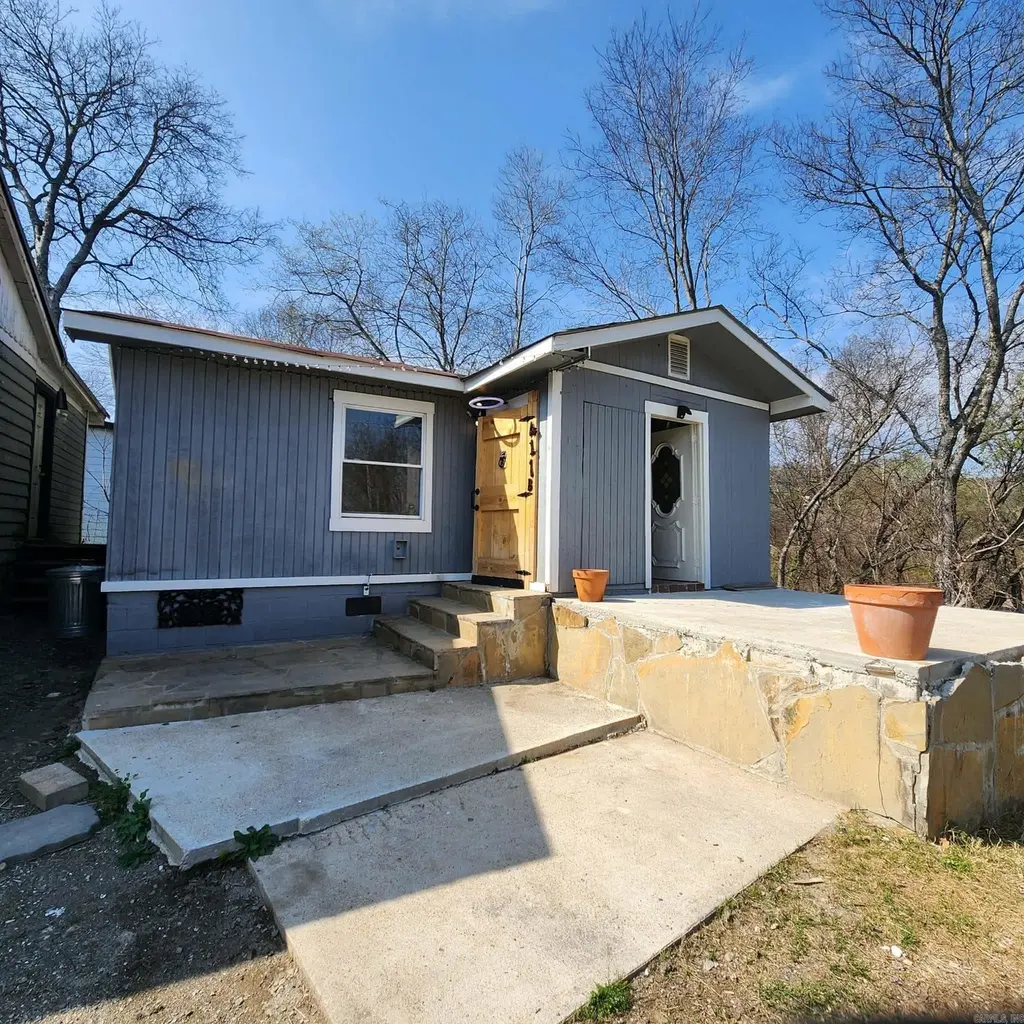
417b Mississippi St · Hot Springs, AR
Flood risk 1/10 · Minimal
- FEMA flood zone
- X (unshaded)
- Chance of flooding over 30 yrs
- 0.0%
- Est. flood insurance / yr
- $507 – $1,088
Fire risk 3/10 · Minor
- Est. fire insurance / yr
- $1,499 – $2,785
Heat risk 6/10 · Moderate
- Hot days now (above 111°F)
- 7 days/yr
- Hot days in 30 yrs
- 20 days/yr
Wind risk 4/10 · Minor
- Chance of severe wind over 30 yrs
- 9.0%
Air-quality risk 1/10 · Minimal
- Unhealthy air days now
- 0 days/yr
- Unhealthy air days in 30 yrs
- 0 days/yr
Risk factors via First Street. Map © Google.
Why this score? — see what drove the C+ grade
The composite is a weighted blend of 9 inputs, each scored 0–100. Each bar is that input's sub-score; the figure is the points it added to the 100-point composite (weight × sub-score).
- Cash flow +30.0/30.0
- DSCR +10.0/10.0
- 1% rule +9.9/10.0
- Livability +3.2/5.0
- Rent growth +2.5/5.0
- Condition / age +2.5/5.0
- Schools +2.0/10.0
- ARV discount +0.0/15.0
- Appreciation +0.0/10.0
$62,000
🖨 Deal sheet 📄 Offer letter ✓ Due diligence
Listing remarks MLS
Charming Investment Opportunity Near Downtown Hot Springs Located in the established Gorge Addition, this cozy 2-bedroom, 1-bath home offers approximately 600 square feet of simple, low-maintenance living. Built in 1990, the property features a functional single-level layout with an eat-in kitchen and updated finishes including newer tile flooring and fresh paint. Situated on a level-sloped lot with public utilities, the home also includes an additional adjacent lot—providing extra space, flexibility, or future potential. With a newer roof (within the last few years) and a modest footprint, this property is ideal for investors, rental income, or buyers looking for an affordable entry into the market. The surrounding area is quiet and primarily residential, with convenient access to local amenities and downtown Hot Springs. Quick Highlights: 2 Bedrooms | 1 Bathroom ~600 sq ft | Built in 1990 Includes additional lot Recent updates (paint, flooring, newer roof) Public water & sewer Ideal for rental, flip, or budget-friendly living * As is, No owner financing, No rent to own *
Key facts
- Updated finishes
- Fresh paint
- Level-sloped lot
Tags
Neighborhood map
What this means for you Summary
Snapshot
- This is a 1-bed/1.0-bath single-family listed at $62k.
Deal economics
- At list price, monthly cash flow is $299 ($4k/yr) — positive.
- The deal already cash-flows at list — no discount required.
- Meets the 1% rule at list price ($921 rent vs $62k).
- Recommended offer: $56k (9.0% below list) — sets the bar for market timing.
- Cap rate 12.1% vs local median 2.8% in Hot Springs — top-decile yield for the area; either an underpriced asset or a hidden risk that comps aren't pricing in. Stress-test before assuming the spread holds.
Location & tenants
- Location reads 65/100 on livability (#140 in AR) — a middle-class / working-renter tenant base. Strengths: cost of living A+, housing A+, health & safety A-; Watch: schools D, crime F, amenities F.
- Hot Springs School District (urban): math 24% / reading 25% proficiency, ranked #195 of 238 in AR (top 82%) — low school quality limits family demand, transient renter base, plan for 1-2y turnover; 72% free/reduced lunch — lower-income household profile, screen leases tightly.
- Market conditions: 363 active listings in the ZIP; 5 comparable units currently listed for rent nearby; rentals lingering (median 44d on market — plan ~5-8 weeks vacancy on turnover, expect pricing pressure); 80% of comp listings sitting > 30 days — soft ceiling on asking rent; 117 units permitted in Garland County in 2024 (24 in 5+ unit buildings).
Forward outlook
- Local home prices are declining (-3.0%/yr); year-one equity from $429 of loan paydown is wiped out by about $2k of value loss. Plan a longer hold.
- Garland County population projected at +7% by 2050 — modest demand growth; plan on rents tracking national, not racing it.
- At projected returns (-3.0% appreciation + 3.0% rent growth), your $17k cash investment doubles in ~6 years — after that, you're playing with house money.
Negotiation context
- It's been on market 108 days — a 9% lower offer ($56k) is reasonable based on typical stale-listing flexibility.
Risks & watch-outs
- Climate carrying-cost: extreme-heat days projected 7→20/yr by 2055 (HVAC capex compounding) — expect insurance premiums to compound above CPI over the hold.
Questions for the listing agent
- It's been on market 108 days. Have you received any prior offers? Is the seller open to a 9% concession, seller financing, or rate buy-down credit?
- Why hasn't it sold? Are there any deal-killer items the seller is aware of (foundation, flood, title, zoning, code violations)?
- Is there a deadline driving the sale (1031 exchange, divorce, estate, relocation)? That informs how much negotiation room exists.
- Schools are D-rated, which usually means shorter tenancies and higher turnover. Who's the typical renter profile here, and what's been the actual vacancy rate?
- Crime grade is F in this area — have there been break-ins, vandalism, or insurance claims at this property in the last 3 years? What carrier currently insures it and at what premium?
- What's the average days-on-market for RENTAL listings here right now (not sales)? A rising rental-DOM trend means longer vacancies and softer asking-rent achievability than the comps imply.
- What's the recent tenant-quality profile in this submarket — average credit score on applications, eviction rate, late-payment / NSF rate, and stable-employment percentage? A property-management company in the area should have these aggregated.
- How much new for-sale + rental construction is in the pipeline within 1–3 miles? Heavy new supply typically softens prices + rents 12–24 months out; constrained supply supports both.
Investment metrics
- 1% rule
- 1.49% ✓
- Cap rate
- 12.09%
- Cash-on-cash
- 20.69%
- DSCR
- 1.92
- GRM
- 5.6
CMA / ARV
- ARV (median comp)
- $52,000
- List price
- $62,000
- Delta
- 19.23%
- Verdict
- OVERPRICED
- Comps
- 7 within 1.0 mi
Show comp detail 2 sales within ~0.75 mi
| Address | Dist | Beds/Ba | Sqft | Sold | Price | $/sf | Match |
|---|---|---|---|---|---|---|---|
| 417 B Mississippi St | 0.00mi | 2/1.0 (+1) | 600 (0%) | 11mo | $31,000 | $52 | 86 |
| 117 Ramsey Pl | 0.37mi | 2/1.0 (+1) | 600 (0%) | 12mo | $76,000 | $127 | 67 |
Match score weights: distance 35% · size 25% · config 20% · recency 20%. Top-matched comps best support the ARV.
Projected returns pro-forma
-3.0% appreciation · 3.0% rent growth · sell at horizon
- IRR
- 13.0%
- Equity multiple
- 1.52×
- Total profit
- $9,029
- Equity at exit
- $9,244
- IRR
- 21.9%
- Equity multiple
- 2.87×
- Total profit
- $32,464
- Equity at exit
- $5,361
Cash invested: $17,360 (down + closing). Projections, not guarantees.
Landlord ↔ Tenant lean methodology
- Overall (STATE)
- 92 Strongly Landlord-Friendly
- State Arkansas
- 92 Strongly Landlord-Friendly · R+14
- County
- — inherits STATE
- City
- — inherits STATE
ZIP-level market 71901
- Home prices YoY
- -3.6%
- Active inventory
- 363
- Price-to-rent
- 5.6×
Monthly cashflow live
- Estimated rent
- $921 high interval (Pro) →
- Mortgage (P&I)
- −$325
- Tax est. 1.5%
- −$78 /mo · $930/yr
- Insurance
- −$26
- HOA
- −$0
- Vacancy / Maint / Mgmt
- −$193
- Net cashflow
- $299
Break-even live
UW: 25.0% down · 7.5% · 30yr · 1.5% tax · 5.0% vac · 8.0% maint · 8.0% mgmt
Financing live
Cash to close
- Down payment
- $15,500
- Closing costs
- $1,860
- Reserves months
- —
- Total cash needed
- —
Loan-product check · same deal, 3 products live
Conventional
25% down · 7.5% · 30yr
- Down + closing
- —
- Monthly P&I
- —
- Monthly cashflow
- —
- DSCR
- —
- Eligible?
- —
Personal DTI + credit; lowest rate.
DSCR
20% down · 8.5% · 30yr
- Down + closing
- —
- Monthly P&I
- —
- Monthly cashflow
- —
- DSCR
- —
- Eligible?
- —
No personal income docs; deal must DSCR.
Hard money
10% down · 12.0% · 12mo
- Down + closing
- —
- Monthly P&I
- —
- Monthly cashflow
- —
- DSCR
- —
- Eligible?
- —
Short-term bridge; refi at stabilization.
Rent comps 5 comps
| Address | Beds | Baths | Sqft | Rent | $/sqft | DOM | Units | Dist |
|---|---|---|---|---|---|---|---|---|
| 605 Hig Fry Rd Hot Springs National Park, AR | 2.0 | 1.0–2.0 | 806 | $1,108 | $1.37 | 23d | 1 | 0.71mi |
| 315 Convention Blvd Hot Springs, AR | 2.0 | 1.0 | 900 | $850 | $0.94 | 43d | 4 | 0.95mi |
| 405 Spring St Unit 2 Hot Springs, AR | 1.0 | 1.0 | 750 | $750 | $1.00 | 43d | 1 | 1.03mi |
| 1007 Park Ave Hot Springs National Park, AR | 1.0 | 1.0 | 668 | $952 | $1.43 | 43d | 1 | 1.35mi |
| 120 Greenway St Unit 1 Hot Springs, AR | 1.0 | 1.0 | 750 | $775 | $1.03 | 43d | 1 | 1.47mi |
Listing history 19 events
-
2026-06-19days on market $62,000 Active 108 DOM
-
2026-06-18days on market $62,000 Active 107 DOM
-
2026-06-17days on market $62,000 Active 106 DOM
-
2026-06-16days on market $62,000 Active 105 DOM
-
2026-06-15days on market $62,000 Active 104 DOM
-
2026-06-14days on market $62,000 Active 102 DOM
-
2026-06-13days on market $62,000 Active 101 DOM
-
2026-06-10days on market $62,000 Active 99 DOM
-
2026-06-09days on market $62,000 Active 98 DOM
-
2026-06-08days on market $62,000 Active 97 DOM
-
2026-06-07days on market $62,000 Active 96 DOM
-
2026-06-05days on market $62,000 Active 93 DOM
-
2026-06-02days on market $62,000 Active 91 DOM
-
2026-06-01days on market $62,000 Active 90 DOM
-
2026-05-31days on market $62,000 Active 89 DOM
-
2026-05-30days on market $62,000 Active 88 DOM
-
2026-04-04price $62,000 1104-char remark
Show marketing remark (1104 chars)
Charming Investment Opportunity Near Downtown Hot Springs Located in the established Gorge Addition, this cozy 2-bedroom, 1-bath home offers approximately 600 square feet of simple, low-maintenance living. Built in 1990, the property features a functional single-level layout with an eat-in kitchen and updated finishes including newer tile flooring and fresh paint. Situated on a level-sloped lot with public utilities, the home also includes an additional adjacent lot—providing extra space, flexibility, or future potential. With a newer roof (within the last few years) and a modest footprint, this property is ideal for investors, rental income, or buyers looking for an affordable entry into the market. The surrounding area is quiet and primarily residential, with convenient access to local amenities and downtown Hot Springs. Quick Highlights: 2 Bedrooms | 1 Bathroom ~600 sq ft | Built in 1990 Includes additional lot Recent updates (paint, flooring, newer roof) Public water & sewer Ideal for rental, flip, or budget-friendly living * As is, No owner financing, No rent to own *
-
2026-03-12price $72,000 1104-char remark
Show marketing remark (1104 chars)
Charming Investment Opportunity Near Downtown Hot Springs Located in the established Gorge Addition, this cozy 2-bedroom, 1-bath home offers approximately 600 square feet of simple, low-maintenance living. Built in 1990, the property features a functional single-level layout with an eat-in kitchen and updated finishes including newer tile flooring and fresh paint. Situated on a level-sloped lot with public utilities, the home also includes an additional adjacent lot—providing extra space, flexibility, or future potential. With a newer roof (within the last few years) and a modest footprint, this property is ideal for investors, rental income, or buyers looking for an affordable entry into the market. The surrounding area is quiet and primarily residential, with convenient access to local amenities and downtown Hot Springs. Quick Highlights: 2 Bedrooms | 1 Bathroom ~600 sq ft | Built in 1990 Includes additional lot Recent updates (paint, flooring, newer roof) Public water & sewer Ideal for rental, flip, or budget-friendly living * As is, No owner financing, No rent to own *
-
2026-03-03$79,000 New Listing 1104-char remark
Show marketing remark (1104 chars)
Charming Investment Opportunity Near Downtown Hot Springs Located in the established Gorge Addition, this cozy 2-bedroom, 1-bath home offers approximately 600 square feet of simple, low-maintenance living. Built in 1990, the property features a functional single-level layout with an eat-in kitchen and updated finishes including newer tile flooring and fresh paint. Situated on a level-sloped lot with public utilities, the home also includes an additional adjacent lot—providing extra space, flexibility, or future potential. With a newer roof (within the last few years) and a modest footprint, this property is ideal for investors, rental income, or buyers looking for an affordable entry into the market. The surrounding area is quiet and primarily residential, with convenient access to local amenities and downtown Hot Springs. Quick Highlights: 2 Bedrooms | 1 Bathroom ~600 sq ft | Built in 1990 Includes additional lot Recent updates (paint, flooring, newer roof) Public water & sewer Ideal for rental, flip, or budget-friendly living * As is, No owner financing, No rent to own *
ⓘ Source: listings_history table (triggers on properties + properties_extension) + one-shot
backfill from property_details.listing_events for pre-trigger history.
Climate risk First Street
- Flood 1/10 Low FEMA zone X (unshaded) · 0% chance over 30 yrs
- Wildfire 3/10 Moderate
- Heat 6/10 Major 7 d/yr ≥111°F today · 20 d/yr by 30 yrs out
- Wind 4/10 Moderate 9% chance of damaging wind over 30 yrs
- Air quality 1/10 Low 0 unhealthy d/yr today · 0 by 30 yrs out
Nearby sold comps map
Loading sold comps map…
Walkable amenities ~0.75 mi
Loading nearby amenities…
Taxation est. · year 1
- Rental income
- $11,055
- − Mortgage interest
- −$3,473
- − Property taxes
- −$930
- − Insurance
- −$310
- − Repairs & maintenance
- −$884
- − Management
- −$884
- − Depreciation
- −$1,804
- Taxable income
- $2,769
- Est. tax owed @ 24.0%
- −$665
- After-tax cash flow
- $2,927/yr
For passive investors: Depreciation is non-cash, so a rental often shows a tax loss while cash-flowing — sheltering income. Rental losses are passive: they offset passive income freely, and up to $25,000/yr can offset ordinary (W-2) income if you actively participate and your MAGI is under $100k (phasing out to $0 by $150k); unused losses carry forward. On sale, claimed depreciation is recaptured at up to 25%, and gains may owe capital-gains tax (a 1031 exchange can defer both). Figures are a year-1 estimate at your 24.0% rate — not tax advice; consult a CPA.
Schools (NCES district)
- District
- Hot Springs School District
- NCES district ID
- 0507890
- Math proficiency
- 24% ▼ -15.00%
- Reading proficiency
- 25% ▼ -12.00%
- Median HH income
- $28,817
- Composite
- 19.62/100
- National rank
- #8746
- State rank
- #195 of 238 in AR
Livability — Hot Springs
- Score
- 65/100
- State rank
- #140
- US rank
- #12498
Category grades
Schools grade is shown separately in the Schools card above.
Census & demographics
- Census place
- Hot Springs, AR
- County
- Garland County · 76,414 people
- City population
- 76,414
- Metro
- Hot Springs, AR
- Population (ZIP)
- 28,937
- Household income
- $53,514
- Rent vs Own
- Severe rent burden
- 961.0
Population outlook (Garland County) Hauer SSP2
- Today (2025)
- 100,343 people
- By 2030
- 101,880 · +1.5%
- By 2040
- 104,804 · +4.4%
- By 2050
- 107,292 · +6.9%
- By 2075
- 113,182 · +12.8%
- By 2100
- 112,247 · +11.9%
Race, ethnicity, and origin ACS 2023
- Neighborhood character
- Predominantly White (71%)
- Race & ethnicity
- White 71% Black 13% Hispanic / Latino 10% Two or more races 6%
- Hispanic origin (detail)
- Mexican 7%
- Common ancestry
- Italian 2% Slovak 2% Portuguese 1%
- Foreign-born
- 5% · Canada, Vietnam
- Languages at home
- 90% English-only · Spanish 7% Vietnamese 1%
Political lean MEDSL · Garland
- 2024 margin
- Solid R (+36.2) · D 30.8% · R 67.0% · Other 2.2%
- 2008→2024 swing
- -11.3pp toward R · 2008: -25.0pp · 2024: -36.2pp
- All cycles
- 2024: R+36.2 2020: R+34.0 2016: R+34.1 2012: R+29.9 2008: R+25.0
Not yet ingested
- Civics
- —
Market trends
- HPI YoY
- ▼ -11.75%
- Current HPI
- 317.2542
- Rent YoY
- —
- Metro
- Hot Springs, AR
- State GDP YoY
- ▲ 3.80%
- F500 in state
- 10
Industry mix (Fortune 500 HQ in AR)
| Industry | F500 HQs | Revenue |
|---|---|---|
| Retail | 1 | $681B |
|
||
| Food / Agriculture | 1 | $53B |
|
||
| Retail / Energy | 1 | $22B |
|
||
| Transportation / Logistics | 1 | $12B |
|
||
| Energy | 1 | $4B |
|
||
Price history
-21.5% since first listed3 events — show timeline
- 2026-04-04 Price Changed $62,000 CARMLS
- 2026-03-12 Price Changed $72,000 CARMLS
- 2026-03-03 Listed $79,000 CARMLS
Property tax history
-9.1%/yrLatest (2025): $29 · -1.3% YoY. Source: county tax records.
Cash-flow waterfall
monthlySold comps — $/sqft
last 12 mo · ≤1 miLoading sold comps…