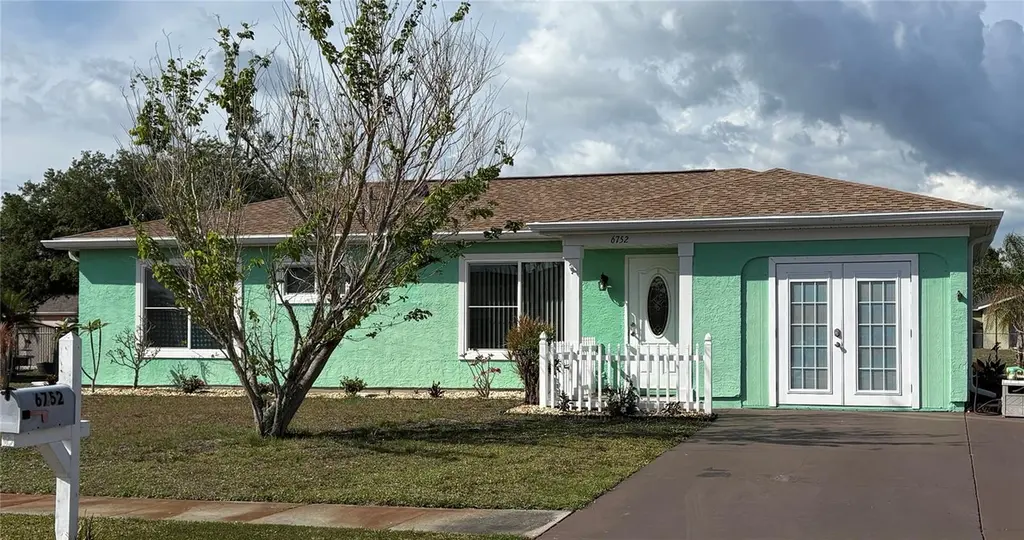
6752 Dennison Ave · North Port, FL
Flood risk 4/10 · Minor
- FEMA flood zone
- X (unshaded)
- Chance of flooding over 30 yrs
- 0.16%
- Est. flood insurance / yr
- $507 – $1,088
Fire risk 2/10 · Minimal
- Est. fire insurance / yr
- $947 – $1,759
Heat risk 10/10 · Severe
- Hot days now (above 107°F)
- 7 days/yr
- Hot days in 30 yrs
- 29 days/yr
Wind risk 10/10 · Severe
- Chance of severe wind over 30 yrs
- 99.0%
Air-quality risk 2/10 · Minimal
- Unhealthy air days now
- 1 days/yr
- Unhealthy air days in 30 yrs
- 1 days/yr
Risk factors via First Street. Map © Google.
Why this score? — see what drove the D grade
The composite is a weighted blend of 9 inputs, each scored 0–100. Each bar is that input's sub-score; the figure is the points it added to the 100-point composite (weight × sub-score).
- Cash flow +14.2/30.0
- ARV discount +7.5/15.0
- Schools +5.4/10.0
- DSCR +4.3/10.0
- Livability +3.8/5.0
- 1% rule +3.1/10.0
- Rent growth +2.6/5.0
- Condition / age +2.5/5.0
- Appreciation +0.0/10.0
$218,000
🖨 Deal sheet (PDF) 📄 Offer letter ✓ Due diligence
Listing remarks
Opportunity awaits with this 3-bedroom, 2-bath home offering a functional layout and desirable features. Highlights include a 2023 roof, electrical box upgraded in 2024, indoor laundry, a storage room and added bedroom with Double French doors. The backyard has plenty of space to run around and enjoy and also a covered patio area. There is a detached storage shed, ideal for tools, hobbies, or additional storage needs. Kitchen has solid wood cabinets, granite countertops, backsplash, ceiling fan and under cabinet lighting. The home has some great curb appeal with undated landscaping and fenced entryway. Take a look today and make it your home.
Key facts
- Storage room
- Double french doors
- 2023 roof
Tags
Property features AI
Finance
- Other: Homestead exempt; Zoning: RSF2
- Financial info: Lease restrictions apply
- HOA & community: Monthly HOA $25, annual fee $300; Association approval required; The Jockey Club Of North Port; Community pool, tennis courts, basketball court, racquetball, shuffleboard; Cats and dogs allowed
Exterior
- Parking: Storage (on property)
- Utilities: Public water; Public sewer; Cable connected; Electricity connected; Water connected; Sewer connected
- Home design: Single family residence; One story; Northeast-facing; Completed condition
- Construction: Stucco and frame construction; Shingle roof; Slab foundation; Built on one level
- Exterior features: Covered patio/porch; Hurricane shutters; Private mailbox; Shed(s); Landscaped yard; Level lot; Paved road access
Interior
- Kitchen: Range; Refrigerator; Water filtration system
- Bedrooms: 3 bedrooms
- Flooring: Carpet; Ceramic tile; Vinyl
- Bathrooms: 2 full bathrooms
- Heating & cooling: Central heating; Central air
- Interior features: Ceiling fans; Solid wood cabinets; Stone counters; Thermostat; Walk-in closets; Window treatments; Storage rooms
- Laundry & utility: Washer; Dryer; Electric water heater; Laundry inside
Neighborhood map
What this means for you Summary
Snapshot
- This is a 2-bed/2.0-bath single-family listed at $218k.
Deal economics
- At list price, monthly cash flow is $36 ($432/yr) — positive.
- The deal already cash-flows at list — no discount required.
- To meet the 1% rule (rent ≥ 1% of price), the offer needs to be $177k (18.7% below list).
- Recommended offer: $177k (18.7% below list) — sets the bar for 1% rule.
- Cap rate 6.5% vs local median 3.8% in North Port — top-decile yield for the area; either an underpriced asset or a hidden risk that comps aren't pricing in. Stress-test before assuming the spread holds.
Location & tenants
- Location reads 75/100 on livability (#252 in FL, #3,975 nationally) — a middle-class / working-renter tenant base. Strengths: crime A+, housing A+, health & safety A+; Watch: amenities F, commute F.
- Sarasota (urban): math 63% / reading 63% proficiency, ranked #7 of 73 in FL (top 10%) — acceptable for families but not a draw, mixed tenant base, ~2y average lease.
- Zoned schools: Glenallen Elementary School (math 54% / reading 54%, grade C, #936 of 2,144 statewide, top 44%, 716 students, 79% FRL); Heron Creek Middle School (math 54% / reading 52%, grade C+, #209 of 571 statewide, top 37%, 902 students, 72% FRL); North Port High School (math 44% / reading 57%, grade D+, #171 of 667 statewide, top 26%, 2,562 students, 54% FRL) — zoned schools average 68% FRL vs 42% district-wide (26 pts higher); higher-poverty schools than district average — tighter screening recommended.
- Market conditions: Rents flat; 857 active listings in the ZIP; 7,466 units permitted in Sarasota County in 2024 (2,138 in 5+ unit buildings).
- This rent runs 34% of the median local income ($63k/yr) — at the standard rent-burdened threshold; future hikes will face affordability resistance.
Forward outlook
- Local home prices are declining (-3.0%/yr); year-one equity from $2k of loan paydown is wiped out by about $7k of value loss. Plan a longer hold.
- Sarasota County population projected at +20% by 2050 — long-run rental-demand tailwind backs the buy-and-hold thesis.
Negotiation context
- It's been on market 47 days — a 3% lower offer ($211k) is reasonable based on typical stale-listing flexibility.
- Current owner paid $38k; list at $218k implies a 466% gain — meaningful room to come down on a strong offer.
Risks & watch-outs
- Climate carrying-cost: severe wind risk, 99% chance of damaging wind over 30y; extreme-heat days projected 7→29/yr by 2055 (HVAC capex compounding) — expect insurance premiums to compound above CPI over the hold.
Questions for the listing agent
- It's been on market 47 days. Have you received any prior offers? Is the seller open to a 19% concession, seller financing, or rate buy-down credit?
- Built in 1979 — when were the roof, HVAC, electrical panel, plumbing, and water heater last replaced?
- What does the HOA fee cover, when was the last increase, and are there any pending special assessments or reserve-fund shortfalls?
- Is there a deadline driving the sale (1031 exchange, divorce, estate, relocation)? That informs how much negotiation room exists.
- Schools are B-rated — typically a magnet for longer-tenancy family renters. What's the average tenant stay here, and is there a school-zone premium baked into asking?
- The area grade is low — what's the realistic commute time and amenity access for the typical tenant pool here? Any planned neighborhood developments (good or bad) we should know about?
- What's the average days-on-market for RENTAL listings here right now (not sales)? A rising rental-DOM trend means longer vacancies and softer asking-rent achievability than the comps imply.
- What's the recent tenant-quality profile in this submarket — average credit score on applications, eviction rate, late-payment / NSF rate, and stable-employment percentage? A property-management company in the area should have these aggregated.
- How much new for-sale + rental construction is in the pipeline within 1–3 miles? Heavy new supply typically softens prices + rents 12–24 months out; constrained supply supports both.
Investment metrics
- 1% rule
- 0.81% ✗
- Cap rate
- 6.49%
- Cash-on-cash
- 0.71%
- DSCR
- 1.03
- GRM
- 10.2
CMA / ARV
No comps found within radius.
Projected returns pro-forma
-3.0% appreciation · 0.26% rent growth · sell at horizon
- IRR
- -18.0%
- Equity multiple
- 0.38×
- Total profit
- $-37,850
- Equity at exit
- $32,505
- IRR
- -16.1%
- Equity multiple
- 0.20×
- Total profit
- $-48,732
- Equity at exit
- $18,849
Cash invested: $61,040 (down + closing). Projections, not guarantees.
Landlord ↔ Tenant lean methodology
- Overall (STATE)
- 87 Strongly Landlord-Friendly
- State Florida
- 87 Strongly Landlord-Friendly · R+3
- County
- — inherits STATE
- City
- — inherits STATE
ZIP-level market 34287
- Home prices YoY
- -20.1%
- Rents YoY
- 0.3%
- Active inventory
- 857
- Price-to-rent
- 10.2×
Monthly cashflow live
- Estimated rent
- $1,773 medium interval (Pro) →
- Mortgage (P&I)
- −$1,143
- Tax from tax record
- −$105 /mo · $1,264/yr
- Insurance
- −$91
- HOA
- −$25
- Vacancy / Maint / Mgmt
- −$372
- Net cashflow
- $36
Break-even live
Sensitivity live
| Price | -10% $159 | -5% $98 | +0% $36 | +5% $-26 | +10% $-87 |
|---|---|---|---|---|---|
| Rent | -10% $-104 | -5% $-34 | +0% $36 | +5% $106 | +10% $176 |
| Rate | -1.0pp $146 | -0.5pp $91 | base $36 | +0.5pp $-20 | +1.0pp $-78 |
UW: 25.0% down · 7.5% · 30yr · 1.5% tax · 5.0% vac · 8.0% maint · 8.0% mgmt
Financing live
Cash to close
- Down payment
- $54,500
- Closing costs
- $6,540
- Reserves months
- —
- Total cash needed
- —
Loan-product check · same deal, 3 products live
Conventional
25% down · 7.5% · 30yr
- Down + closing
- —
- Monthly P&I
- —
- Monthly cashflow
- —
- DSCR
- —
- Eligible?
- —
Personal DTI + credit; lowest rate.
DSCR
20% down · 8.5% · 30yr
- Down + closing
- —
- Monthly P&I
- —
- Monthly cashflow
- —
- DSCR
- —
- Eligible?
- —
No personal income docs; deal must DSCR.
Hard money
10% down · 12.0% · 12mo
- Down + closing
- —
- Monthly P&I
- —
- Monthly cashflow
- —
- DSCR
- —
- Eligible?
- —
Short-term bridge; refi at stabilization.
HOA detail
- Monthly dues
- $25 · $300/yr
- Likely covers
- electriclandscaping
Listing history 19 events
-
2026-06-21pricedays on market $218,000 Active 47 DOM
-
2026-06-18days on market $225,000 Active 44 DOM
-
2026-06-17days on market $225,000 Active 43 DOM
-
2026-06-16days on market $225,000 Active 42 DOM
-
2026-06-15days on market $225,000 Active 41 DOM
-
2026-06-13days on market $225,000 Active 39 DOM
-
2026-06-13days on market $225,000 Active 38 DOM
-
2026-06-10days on market $225,000 Active 36 DOM
-
2026-06-09days on market $225,000 Active 35 DOM
-
2026-06-08days on market $225,000 Active 34 DOM
-
2026-06-08days on market $225,000 Active 33 DOM
-
2026-06-05days on market $225,000 Active 30 DOM
-
2026-06-03days on market $225,000 Active 29 DOM
-
2026-06-02days on market $225,000 Active 28 DOM
-
2026-06-01days on market $225,000 Active 27 DOM
-
2026-05-31days on market $225,000 Active 26 DOM
-
2026-05-05$229,000 Active 650-char remark
-
1988-04-20soldstatus $38,500
-
1978-11-01soldstatus $38,300
ⓘ Source: listings_history table (triggers on properties + properties_extension) + one-shot
backfill from property_details.listing_events for pre-trigger history.
Tax reassessment forecast FL · Resets to sale price
- Current annual tax
- $1,264 · $105/mo
- Projected year-2 tax
- $1,809 · $151/mo
- Expected delta
- +$545/yr (+$45/mo · 43.1%)
ⓘ Screening estimate from a state-policy table — verify with the county assessor before closing.
Climate risk First Street
- Flood 4/10 Moderate FEMA zone X (unshaded) · 16% chance over 30 yrs
- Wildfire 2/10 Low
- Heat 10/10 Extreme 7 d/yr ≥107°F today · 29 d/yr by 30 yrs out
- Wind 10/10 Extreme 99% chance of damaging wind over 30 yrs
- Air quality 2/10 Low 1 unhealthy d/yr today · 1 by 30 yrs out
Nearby sold comps map
Loading sold comps map…
Walkable amenities ~0.75 mi
Loading nearby amenities…
Taxation est. · year 1
- Rental income
- $21,272
- − Mortgage interest
- −$12,211
- − Property taxes
- −$1,264
- − Insurance
- −$1,090
- − Repairs & maintenance
- −$1,702
- − Management
- −$1,702
- − HOA
- −$300
- − Depreciation
- −$6,342
- Taxable loss
- −$3,339
- Est. tax savings @ 24.0%
- +$801
- After-tax cash flow
- $1,233/yr
For passive investors: Depreciation is non-cash, so a rental often shows a tax loss while cash-flowing — sheltering income. Rental losses are passive: they offset passive income freely, and up to $25,000/yr can offset ordinary (W-2) income if you actively participate and your MAGI is under $100k (phasing out to $0 by $150k); unused losses carry forward. On sale, claimed depreciation is recaptured at up to 25%, and gains may owe capital-gains tax (a 1031 exchange can defer both). Figures are a year-1 estimate at your 24.0% rate — not tax advice; consult a CPA.
Schools (NCES district)
- District
- Sarasota
- NCES district ID
- 1201680
- Math proficiency
- 63% ▼ -8.00%
- Reading proficiency
- 63% ▼ -3.00%
- Median HH income
- $51,167
- Composite
- 53.68/100
- National rank
- #1428
- State rank
- #7 of 73 in FL
Livability — North Port
- Score
- 75/100
- State rank
- #252
- US rank
- #3975
Category grades
Schools grade is shown separately in the Schools card above.
Census & demographics
- Census place
- North Port, FL
- County
- Sarasota County · 448,376 people
- City population
- 75,324
- Metro
- North Port-Sarasota-Bradenton, FL
- Population (ZIP)
- 25,929
- Household income
- $63,464
- Rent vs Own
- Severe rent burden
- 522.0
Population outlook (Sarasota County) Hauer SSP2
- Today (2025)
- 452,380 people
- By 2030
- 474,175 · +4.8%
- By 2040
- 511,577 · +13.1%
- By 2050
- 541,467 · +19.7%
- By 2075
- 604,947 · +33.7%
- By 2100
- 621,965 · +37.5%
Race, ethnicity, and origin ACS 2023
- Neighborhood character
- Predominantly White (77%)
- Race & ethnicity
- White 77% Hispanic / Latino 14% Two or more races 7% Asian 4% Black 3%
- Hispanic origin (detail)
- Mexican 2% Puerto Rican 3% Cuban 3% Dominican 1%
- Common ancestry
- Romanian 4% Scotch-Irish 3% Lithuanian 3%
- Foreign-born
- 16% · Canada, Philippines
- Languages at home
- 81% English-only · Spanish 8% Russian/Polish/Slavic 5% French/Haitian/Cajun 2%
Political lean MEDSL · Sarasota
- 2024 margin
- R (+18.2) · D 40.5% · R 58.7%
- 2008→2024 swing
- -18.1pp toward R · 2008: -0.1pp · 2024: -18.2pp
- All cycles
- 2024: R+18.2 2020: R+10.4 2016: R+11.6 2012: R+7.4 2008: R+0.1
Not yet ingested
- Civics
- —
Market trends
- HPI YoY
- ▼ -70.89%
- Current HPI
- 280.8484
- Rent YoY
- ▲ 0.26%
- Metro
- North Port-Sarasota-Bradenton, FL
- State GDP YoY
- ▲ 3.28%
- F500 in state
- 36
Industry mix (Fortune 500 HQ in FL)
| Industry | F500 HQs | Revenue |
|---|---|---|
| Industrial Technology | 2 | $29B |
|
||
| Insurance | 2 | $17B |
|
||
| Retail | 1 | $60B |
|
||
| Technology Distribution | 1 | $58B |
|
||
| Homebuilding | 1 | $35B |
|
||
| Technology Manufacturing | 1 | $35B |
|
||
Price history
+487.5% since first listed4 events — show timeline
- 2026-05-29 Price Changed $225,000 Stellar MLS as Distributed by MLS Grid
- 2026-05-05 Listed $229,000 Stellar MLS as Distributed by MLS Grid
- 1988-04-20 Sold (Public Records) $38,500 Public Records
- 1978-11-01 Sold (Public Records) $38,300 Public Records
Property tax history
+6.1%/yrLatest (2025): $1,264 · +8.8% YoY. Source: county tax records.
Cash-flow waterfall
monthlySold comps — $/sqft
last 12 mo · ≤1 miLoading sold comps…