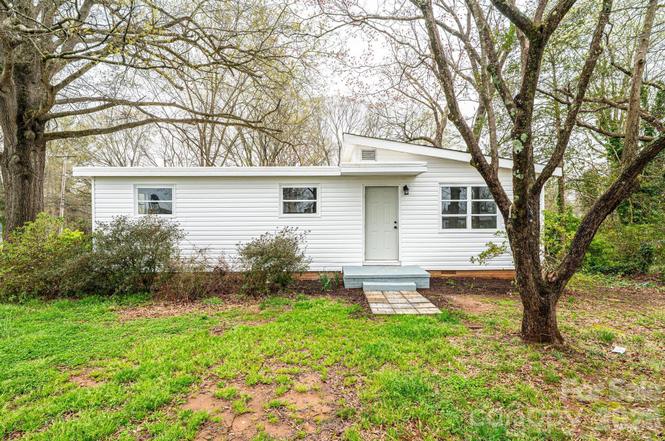
25 N Davis Ave · Newton, NC
Flood risk No data
- FEMA flood zone
- —
- Chance of flooding over 30 yrs
- —
- Est. flood insurance / yr
- —
Fire risk No data
- Est. fire insurance / yr
- —
Heat risk No data
- Hot days now (above threshold)
- —
- Hot days in 30 yrs
- —
Wind risk No data
- Chance of severe wind over 30 yrs
- —
Air-quality risk No data
- Unhealthy air days now
- —
- Unhealthy air days in 30 yrs
- —
Risk factors via First Street. Map © Google.
Why this score? — see what drove the D- grade
The composite is a weighted blend of 9 inputs, each scored 0–100. Each bar is that input's sub-score; the figure is the points it added to the 100-point composite (weight × sub-score).
- Cash flow +15.2/30.0
- DSCR +4.7/10.0
- Schools +4.0/10.0
- Livability +3.7/5.0
- 1% rule +3.1/10.0
- ARV discount +2.9/15.0
- Rent growth +2.5/5.0
- Condition / age +2.5/5.0
- Appreciation +0.0/10.0
$179,900
🖨 Deal sheet (PDF) 📄 Offer letter ✓ Due diligence
Listing remarks
Renovated and move-in ready, 25 N Davis has had many updates. This home features a brand new roof, all new plumbing, new flooring throughout, new windows in bedrooms, a completely updated kitchen with new cabinets and countertops, and a fully remodeled bathroom with modern finishes. All new appliances are included — refrigerator, stove, dishwasher, washer, and dryer — making this a true turnkey property. Perfect for a first-time buyer or an investor looking for a solid, updated home.
Key facts
- New plumbing
- New flooring
- New cabinets
Tags
Property features AI
Finance
- HOA & community: No HOA
Exterior
- Parking: Driveway (no main-level garage)
- Utilities: City water; Public sewer
- Home design: Single-family residence; Site-built construction; One story; R-7A zoning
- Construction: Vinyl exterior; Crawl space foundation; Built on site
- Exterior features: Concrete and paved road access; Publicly maintained road
Interior
- Kitchen: Dishwasher, Electric oven, Refrigerator
- Bedrooms: 3 bedrooms on the main level
- Bathrooms: 1 full bathroom on the main level
- Heating & cooling: Heat pump; Central air
- Interior features: Heat pump heating; Central air conditioning; Dishwasher; Electric oven; Refrigerator; One main living room (room count: 1)
- Laundry & utility: In-unit laundry
Neighborhood map
What this means for you Summary
Snapshot
- This is a 2-bed/1.0-bath single-family listed at $180k.
Deal economics
- At list price, monthly cash flow is $62 ($744/yr) — positive.
- The deal already cash-flows at list — no discount required.
- To meet the 1% rule (rent ≥ 1% of price), the offer needs to be $147k (18.6% below list).
- Recommended offer: $147k (18.6% below list) — sets the bar for 1% rule.
- Cap rate 6.7% vs local median 2.9% in Newton — top-decile yield for the area; either an underpriced asset or a hidden risk that comps aren't pricing in. Stress-test before assuming the spread holds.
Location & tenants
- Location reads 73/100 on livability (#77 in NC) — a middle-class / working-renter tenant base. Strengths: cost of living A+, housing A+, health & safety A+; Watch: employment C-, crime D+, amenities F.
- Newton Conover City Schools (suburban): math 49% / reading 47% proficiency, ranked #74 of 178 in NC (top 42%) — families likely to look elsewhere, expect single-tenant / working-renter base with shorter leases.
- Zoned schools: South Newton Elementary (math 37% / reading 32%, grade F, #835 of 1,410 statewide, top 62%, 350 students, 75% FRL); Newton-Conover Middle (math 43% / reading 48%, grade D+, #154 of 475 statewide, top 33%, 603 students, 65% FRL); Newton-Conover High (math 57% / reading 52%, grade C-, #270 of 535 statewide, top 52%, 758 students, 59% FRL).
- Market conditions: 229 active listings in the ZIP; 3 comparable units currently listed for rent nearby; rentals at typical pace (median 15d on market — plan ~3-4 weeks tenant-placement turnaround); 2,016 units permitted in Catawba County in 2024 (255 in 5+ unit buildings).
Forward outlook
- Local home prices are declining (-3.0%/yr); year-one equity from $1k of loan paydown is wiped out by about $5k of value loss. Plan a longer hold.
- Catawba County population projected to shrink 7% by 2050 — rents likely to lag national; underwrite the cash flow, not the appreciation.
Negotiation context
- It's been on market 89 days — a 6% lower offer ($169k) is reasonable based on typical stale-listing flexibility.
- 2 sale attempts; this cycle's ask has dropped $20k (10%) from the opening price — seller is motivated, your offer sets the floor, not the list.
Questions for the listing agent
- It's been on market 89 days. Have you received any prior offers? Is the seller open to a 19% concession, seller financing, or rate buy-down credit?
- Built in 1962 — when were the roof, HVAC, electrical panel, plumbing, and water heater last replaced?
- Why hasn't it sold? Are there any deal-killer items the seller is aware of (foundation, flood, title, zoning, code violations)?
- Is there a deadline driving the sale (1031 exchange, divorce, estate, relocation)? That informs how much negotiation room exists.
- Schools are D-rated, which usually means shorter tenancies and higher turnover. Who's the typical renter profile here, and what's been the actual vacancy rate?
- Crime grade is D in this area — have there been break-ins, vandalism, or insurance claims at this property in the last 3 years? What carrier currently insures it and at what premium?
- The area grade is low — what's the realistic commute time and amenity access for the typical tenant pool here? Any planned neighborhood developments (good or bad) we should know about?
- What's the average days-on-market for RENTAL listings here right now (not sales)? A rising rental-DOM trend means longer vacancies and softer asking-rent achievability than the comps imply.
- What's the recent tenant-quality profile in this submarket — average credit score on applications, eviction rate, late-payment / NSF rate, and stable-employment percentage? A property-management company in the area should have these aggregated.
- How much new for-sale + rental construction is in the pipeline within 1–3 miles? Heavy new supply typically softens prices + rents 12–24 months out; constrained supply supports both.
Investment metrics
- 1% rule
- 0.81% ✗
- Cap rate
- 6.71%
- Cash-on-cash
- 1.48%
- DSCR
- 1.07
- GRM
- 10.2
CMA / ARV
- ARV (on-the-fly)
- $163,200
- Comps found
- 12
Show comp detail 12 sales within ~0.75 mi
| Address | Dist | Beds/Ba | Sqft | Sold | Price | $/sf | Match |
|---|---|---|---|---|---|---|---|
| 18 S Coulter Ave | 0.22mi | 2/2.0 | 952 (-1%) | 11mo | $190,000 | $200 | 75 |
| 325 N Caldwell Ave | 0.16mi | 2/1.0 | 1,034 (+8%) | 10mo | $140,000 | $135 | 71 |
| 300 N Ervin Ave | 0.13mi | 2/1.0 | 853 (-11%) | 8mo | $180,000 | $211 | 69 |
| 127 S Caldwell Ave | 0.26mi | 3/1.0 (+1) | 1,000 (+4%) | 11mo | $102,000 | $102 | 67 |
| 216 N Davis Ave | 0.11mi | 3/1.0 (+1) | 1,064 (+11%) | 8mo | $89,000 | $84 | 66 |
| 504 N Spring Ave | 0.69mi | 2/1.0 | 946 (-2%) | 5mo | $167,000 | $177 | 61 |
| 614 S Ashe Ave | 0.75mi | 2/1.0 | 984 (+2%) | 1mo | $167,500 | $170 | 60 |
| 10 N Davis Ave | 0.11mi | 3/1.0 (+1) | 850 (-12%) | 13mo | $40,000 | $47 | 60 |
| 621 E 11th St | 0.61mi | 3/1.0 (+1) | 1,023 (+7%) | 1mo | $137,500 | $134 | 55 |
| 736 E 11th St | 0.69mi | 3/1.0 (+1) | 902 (-6%) | 1mo | $200,000 | $222 | 52 |
| 608 E E St | 0.48mi | 3/2.0 (+1) | 1,018 (+6%) | 10mo | $195,000 | $192 | 50 |
| 613 E 11th St | 0.61mi | 3/1.5 (+1) | 1,032 (+8%) | 14mo | $145,000 | $141 | 40 |
Match score weights: distance 35% · size 25% · config 20% · recency 20%. Top-matched comps best support the ARV.
Projected returns pro-forma
-3.0% appreciation · 3.0% rent growth · sell at horizon
- IRR
- -14.0%
- Equity multiple
- 0.50×
- Total profit
- $-25,274
- Equity at exit
- $26,824
- IRR
- -5.2%
- Equity multiple
- 0.66×
- Total profit
- $-17,206
- Equity at exit
- $15,554
Cash invested: $50,372 (down + closing). Projections, not guarantees.
Landlord ↔ Tenant lean methodology
- Overall (STATE)
- 85 Strongly Landlord-Friendly
- State North Carolina
- 85 Strongly Landlord-Friendly · R+3
- County
- — inherits STATE
- City
- — inherits STATE
ZIP-level market 28658
- Home prices YoY
- -23.3%
- Active inventory
- 229
- Price-to-rent
- 10.2×
Monthly cashflow live
- Estimated rent
- $1,465 medium interval (Pro) →
- Mortgage (P&I)
- −$943
- Tax from tax record
- −$77 /mo · $925/yr
- Insurance
- −$75
- HOA
- −$0
- Vacancy / Maint / Mgmt
- −$308
- Net cashflow
- $62
Break-even live
Sensitivity live
| Price | -10% $164 | -5% $113 | +0% $62 | +5% $11 | +10% $-40 |
|---|---|---|---|---|---|
| Rent | -10% $-54 | -5% $4 | +0% $62 | +5% $120 | +10% $178 |
| Rate | -1.0pp $153 | -0.5pp $108 | base $62 | +0.5pp $15 | +1.0pp $-32 |
UW: 25.0% down · 7.5% · 30yr · 1.5% tax · 5.0% vac · 8.0% maint · 8.0% mgmt
Financing live
Cash to close
- Down payment
- $44,975
- Closing costs
- $5,397
- Reserves months
- —
- Total cash needed
- —
Loan-product check · same deal, 3 products live
Conventional
25% down · 7.5% · 30yr
- Down + closing
- —
- Monthly P&I
- —
- Monthly cashflow
- —
- DSCR
- —
- Eligible?
- —
Personal DTI + credit; lowest rate.
DSCR
20% down · 8.5% · 30yr
- Down + closing
- —
- Monthly P&I
- —
- Monthly cashflow
- —
- DSCR
- —
- Eligible?
- —
No personal income docs; deal must DSCR.
Hard money
10% down · 12.0% · 12mo
- Down + closing
- —
- Monthly P&I
- —
- Monthly cashflow
- —
- DSCR
- —
- Eligible?
- —
Short-term bridge; refi at stabilization.
Rent comps 3 comps
| Address | Beds | Baths | Sqft | Rent | $/sqft | DOM | Units | Dist |
|---|---|---|---|---|---|---|---|---|
| 244 S Caldwell Ave Newton, NC | 2.0 | 1.5 | 918 | $1,575 | $1.72 | 6d | 1 | 0.50mi |
| 1326 N Frye Ave Unit I Newton, NC | 2.0 | 1.0 | 730 | $1,150 | $1.58 | 14d | 1 | 1.10mi |
| 409 E 20th St #14 Newton, NC | 2.0 | 1.0 | 1041 | $1,475 | $1.42 | 15d | 1 | 1.30mi |
Listing history 9 events
-
2026-05-19status Pending
-
2026-05-13price $179,900
-
2026-05-06price $184,900
-
2026-04-29price $189,900
-
2026-04-20price $194,900
-
2026-03-29status Active
-
2026-03-18historical Active Under Contract
-
2026-02-19$199,900 Active
-
2025-10-07soldstatus $340,000
ⓘ Source: listings_history table (triggers on properties + properties_extension) + one-shot
backfill from property_details.listing_events for pre-trigger history.
Tax reassessment forecast NC · Resets to sale price
- Current annual tax
- $925 · $77/mo
- Projected year-2 tax
- $1,475 · $123/mo
- Expected delta
- +$550/yr (+$46/mo · 59.5%)
ⓘ Screening estimate from a state-policy table — verify with the county assessor before closing.
Nearby sold comps map
Loading sold comps map…
Walkable amenities ~0.75 mi
Loading nearby amenities…
Taxation est. · year 1
- Rental income
- $17,581
- − Mortgage interest
- −$10,077
- − Property taxes
- −$925
- − Insurance
- −$900
- − Repairs & maintenance
- −$1,406
- − Management
- −$1,406
- − Depreciation
- −$5,233
- Taxable loss
- −$2,367
- Est. tax savings @ 24.0%
- +$568
- After-tax cash flow
- $1,312/yr
For passive investors: Depreciation is non-cash, so a rental often shows a tax loss while cash-flowing — sheltering income. Rental losses are passive: they offset passive income freely, and up to $25,000/yr can offset ordinary (W-2) income if you actively participate and your MAGI is under $100k (phasing out to $0 by $150k); unused losses carry forward. On sale, claimed depreciation is recaptured at up to 25%, and gains may owe capital-gains tax (a 1031 exchange can defer both). Figures are a year-1 estimate at your 24.0% rate — not tax advice; consult a CPA.
Schools (NCES district)
- District
- Newton Conover City Schools
- NCES district ID
- 3703360
- Math proficiency
- 49% ▲ 11.00%
- Reading proficiency
- 47% ▲ 3.00%
- Median HH income
- $39,491
- Composite
- 40.13/100
- National rank
- #3797
- State rank
- #74 of 178 in NC
Livability — Newton
- Score
- 73/100
- State rank
- #77
- US rank
- #5536
Category grades
Schools grade is shown separately in the Schools card above.
Census & demographics
- Census place
- Newton, NC
- Population (ZIP)
- 25,681
Population outlook (Catawba County) Hauer SSP2
- Today (2025)
- 156,513 people
- By 2030
- 155,267 · -0.8%
- By 2040
- 151,110 · -3.5%
- By 2050
- 145,524 · -7.0%
- By 2075
- 134,047 · -14.4%
- By 2100
- 119,424 · -23.7%
Race, ethnicity, and origin ACS 2023
- Neighborhood character
- Predominantly White (69%)
- Race & ethnicity
- White 69% Hispanic / Latino 12% Black 8% Two or more races 8% Asian 5%
- Hispanic origin (detail)
- Mexican 9%
- Common ancestry
- Slovak 2% Serbian 2% Italian 2%
- Foreign-born
- 8% · Canada, Jamaica, Vietnam
- Languages at home
- 84% English-only · Spanish 11% Other Asian/Pacific 3% Tagalog/Filipino 1%
Political lean MEDSL · Catawba
- 2024 margin
- Solid R (+38.0) · D 30.6% · R 68.6%
- 2008→2024 swing
- -13.0pp toward R · 2008: -25.0pp · 2024: -38.0pp
- All cycles
- 2024: R+38.0 2020: R+37.0 2016: R+38.0 2012: R+29.6 2008: R+25.0
Not yet ingested
- Civics
- —
Market trends
- HPI YoY
- ▼ -79.85%
- Current HPI
- 262.8541
- Rent YoY
- —
- Metro
- —
- State GDP YoY
- ▲ 3.28%
- F500 in state
- 26
Industry mix (Fortune 500 HQ in NC)
| Industry | F500 HQs | Revenue |
|---|---|---|
| Financial Services | 2 | $213B |
|
||
| Retail | 2 | $95B |
|
||
| Industrial Conglomerate | 1 | $38B |
|
||
| Metals / Steel | 1 | $35B |
|
||
| Utilities | 1 | $30B |
|
||
| Industrial Machinery | 1 | $19B |
|
||
Price history
-47.1% since first listed9 events — show timeline
- 2026-05-19 Pending — CANOPYMLS as Distributed by MLS Grid
- 2026-05-13 Price Changed $179,900 CANOPYMLS as Distributed by MLS Grid
- 2026-05-06 Price Changed $184,900 CANOPYMLS as Distributed by MLS Grid
- 2026-04-29 Price Changed $189,900 CANOPYMLS as Distributed by MLS Grid
- 2026-04-20 Price Changed $194,900 CANOPYMLS as Distributed by MLS Grid
- 2026-03-29 Relisted — CANOPYMLS as Distributed by MLS Grid
- 2026-03-18 Contingent — CANOPYMLS as Distributed by MLS Grid
- 2026-02-19 Listed $199,900 CANOPYMLS as Distributed by MLS Grid
- 2025-10-07 Sold (Public Records) $340,000 Public Records
Property tax history
+5.1%/yrLatest (2024): $925 · +0.0% YoY. Source: county tax records.
Cash-flow waterfall
monthlySold comps — $/sqft
last 12 mo · ≤1 miLoading sold comps…