6156 Rio Linda Blvd · Rio Linda, CA
Flood risk 7/10 · Major
- FEMA flood zone
- X (shaded)
- Chance of flooding over 30 yrs
- 0.96%
- Est. flood insurance / yr
- $507 – $1,088
Fire risk 7/10 · Major
- Est. fire insurance / yr
- $659 – $1,223
Heat risk 7/10 · Major
- Hot days now (above 102°F)
- 7 days/yr
- Hot days in 30 yrs
- 15 days/yr
Wind risk 1/10 · Minimal
- Chance of severe wind over 30 yrs
- —
Air-quality risk 10/10 · Severe
- Unhealthy air days now
- 29 days/yr
- Unhealthy air days in 30 yrs
- 33 days/yr
Risk factors via First Street. Map © Google.
Why this score? — see what drove the D grade
The composite is a weighted blend of 9 inputs, each scored 0–100. Each bar is that input's sub-score; the figure is the points it added to the 100-point composite (weight × sub-score).
- Cash flow +15.6/30.0
- ARV discount +7.5/15.0
- 1% rule +5.9/10.0
- DSCR +4.8/10.0
- Schools +3.1/10.0
- Livability +2.8/5.0
- Rent growth +2.5/5.0
- Condition / age +2.5/5.0
- Appreciation +0.0/10.0
$200,000
🖨 Deal sheet 📄 Offer letter ✓ Due diligence
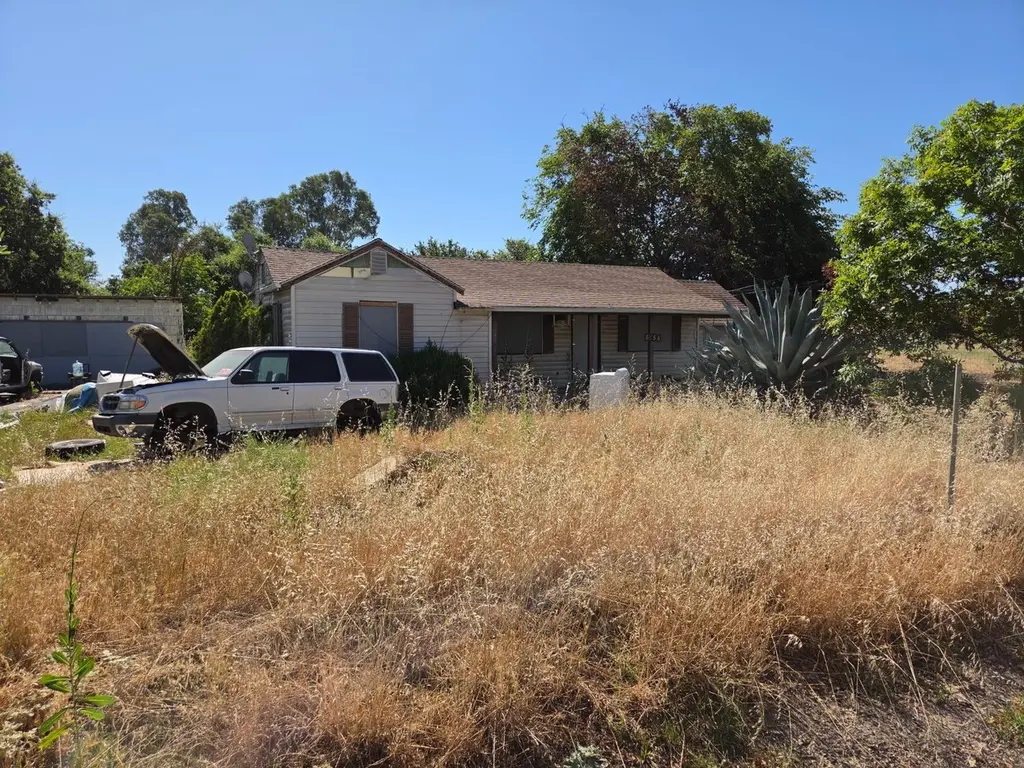
Listing remarks
This house is trash. Great area and lots of space, but even more trash. Close to shopping and restaurants. Likely a tear down.
Key facts
- 0.73 acre lot
- 2 garage spots
- Built 1952
Property features AI
Finance
- HOA & community: No homeowners association
Exterior
- Parking: Detached 2-car garage
- Utilities: Water provided by a water district; Other electric; Other sewer; Other utilities; Irrigation: other source
- Home design: Detached single-family residence; Built in 1952
- Construction: Composition roof
- Exterior features: Regular-shaped lot
Interior
- Kitchen: Kitchen with breakfast area
- Bedrooms: 2 bedrooms (located on the main level)
- Flooring: Other flooring
- Bathrooms: 1 full bathroom
- Heating & cooling: Other heating; Other cooling
- Interior features: One-story home; Breakfast area in kitchen; Main level includes bedrooms, living room, kitchen and garage
- Laundry & utility: Laundry area (details not specified)
Neighborhood map
What this means for you Summary
Snapshot
- This is a 2-bed/1.0-bath single-family listed at $200k.
Deal economics
- At list price, monthly cash flow is $19 ($232/yr) — positive.
- The deal already cash-flows at list — no discount required.
- Meets the 1% rule at list price ($2k rent vs $200k).
- Cap rate 6.8% vs local median 3.4% in Rio Linda — top-decile yield for the area; either an underpriced asset or a hidden risk that comps aren't pricing in. Stress-test before assuming the spread holds.
Location & tenants
- Location reads 55/100 on livability (#856 in CA) — a working-class tenant base; expect higher turnover. Strengths: housing A+, employment A-; Watch: schools C-, crime F, amenities F.
- Twin Rivers Unified (suburban): math 29% / reading 37% proficiency, ranked #970 of 1,400 in CA (top 69%) — families likely to look elsewhere, expect single-tenant / working-renter base with shorter leases; 76% free/reduced lunch — lower-income household profile, screen leases tightly.
- Market conditions: 52 active listings in the ZIP; 3 comparable units currently listed for rent nearby; rentals leasing fast (median 11d on market — plan ~1-2 weeks tenant-placement turnaround); 6,825 units permitted in Sacramento County in 2024 (1,752 in 5+ unit buildings).
Forward outlook
- Local home prices are declining (-3.0%/yr); year-one equity from $1k of loan paydown is wiped out by about $6k of value loss. Plan a longer hold.
- Sacramento County population projected at +17% by 2050 — long-run rental-demand tailwind backs the buy-and-hold thesis.
Negotiation context
- Only 3 days on market — expect competitive offers; lowballing is unlikely to land.
- Current owner paid $72k; list at $200k implies a 178% gain — meaningful room to come down on a strong offer.
Risks & watch-outs
- Watch-outs: property tax is 3.0% of price; flood insurance adds $66/mo; built in 1952 — expect roof / HVAC / electrical / plumbing capex.
- Climate carrying-cost: major flood risk; major wildfire risk; extreme-heat days projected 7→15/yr by 2055 (HVAC capex compounding) — expect insurance premiums to compound above CPI over the hold.
Questions for the listing agent
- Built in 1952 — when were the roof, HVAC, electrical panel, plumbing, and water heater last replaced?
- Property tax is high relative to price — has the assessment been appealed recently, and will the sale trigger a re-assessment?
- What's the actual annual flood-insurance premium (NFIP or private), and is the property in a SFHA with mandatory coverage?
- Is there a deadline driving the sale (1031 exchange, divorce, estate, relocation)? That informs how much negotiation room exists.
- Crime grade is F in this area — have there been break-ins, vandalism, or insurance claims at this property in the last 3 years? What carrier currently insures it and at what premium?
- The area grade is low — what's the realistic commute time and amenity access for the typical tenant pool here? Any planned neighborhood developments (good or bad) we should know about?
- What's the average days-on-market for RENTAL listings here right now (not sales)? A rising rental-DOM trend means longer vacancies and softer asking-rent achievability than the comps imply.
- What's the recent tenant-quality profile in this submarket — average credit score on applications, eviction rate, late-payment / NSF rate, and stable-employment percentage? A property-management company in the area should have these aggregated.
- How much new for-sale + rental construction is in the pipeline within 1–3 miles? Heavy new supply typically softens prices + rents 12–24 months out; constrained supply supports both.
Investment metrics
- 1% rule
- 1.09% ✓
- Cap rate
- 6.81%
- Cash-on-cash
- 1.84%
- DSCR
- 1.08
- GRM
- 7.7
CMA / ARV
- ARV (on-the-fly)
- $440,296
- Comps found
- 12
Show comp detail 12 sales within ~0.75 mi
| Address | Dist | Beds/Ba | Sqft | Sold | Price | $/sf | Match |
|---|---|---|---|---|---|---|---|
| 450 Lilac Ln | 0.36mi | 2/2.0 | 1,120 (-4%) | 3mo | $340,000 | $304 | 70 |
| 212 Jubilee Way | 0.38mi | 3/2.0 (+1) | 1,196 (+2%) | 1mo | $440,000 | $368 | 69 |
| 209 Jubilee Way | 0.41mi | 3/2.0 (+1) | 1,195 (+2%) | 8mo | $449,900 | $376 | 62 |
| 539 Harling Ct | 0.30mi | 3/2.0 (+1) | 1,093 (-7%) | 7mo | $370,000 | $339 | 60 |
| 518 Jamie Ct | 0.41mi | 3/2.0 (+1) | 1,129 (-4%) | 7mo | $398,000 | $353 | 60 |
| 6624 5th St | 0.62mi | 3/1.0 (+1) | 1,219 (+4%) | 3mo | $438,000 | $359 | 57 |
| 5812 W 2nd St | 0.65mi | 3/2.0 (+1) | 1,146 (-2%) | 4mo | $513,000 | $448 | 53 |
| 6544 Sunview Way | 0.58mi | 3/2.0 (+1) | 1,118 (-4%) | 7mo | $425,000 | $380 | 51 |
| 6731 5th St | 0.74mi | 3/1.5 (+1) | 1,237 (+6%) | 1mo | $440,000 | $356 | 48 |
| 144 Withington Ave | 0.53mi | 3/1.0 (+1) | 1,026 (-12%) | 4mo | $390,000 | $380 | 46 |
| 129 Withington Ave | 0.69mi | 3/1.0 (+1) | 1,026 (-12%) | 1mo | $410,000 | $400 | 41 |
| 330 Willis Ave | 0.72mi | 3/2.0 (+1) | 1,008 (-14%) | 4mo | $480,000 | $476 | 30 |
Match score weights: distance 35% · size 25% · config 20% · recency 20%. Top-matched comps best support the ARV.
Projected returns pro-forma
-3.0% appreciation · 3.0% rent growth · sell at horizon
- IRR
- -15.5%
- Equity multiple
- 0.45×
- Total profit
- $-30,953
- Equity at exit
- $29,821
- IRR
- -6.8%
- Equity multiple
- 0.56×
- Total profit
- $-24,453
- Equity at exit
- $17,292
Cash invested: $56,000 (down + closing). Projections, not guarantees.
Landlord ↔ Tenant lean methodology
- Overall (STATE)
- 18 Strongly Tenant-Friendly
- State California
- 18 Strongly Tenant-Friendly · D+13
- County
- — inherits STATE
- City
- — inherits STATE
ZIP-level market 95673
- Active inventory
- 52
- Price-to-rent
- 7.7×
Monthly cashflow live
- Estimated rent
- $2,171 medium interval (Pro) →
- Mortgage (P&I)
- −$1,049
- Tax from tax record
- −$497 /mo · $5,963/yr
- Insurance
- −$83
- Flood insurance flood zone
- −$66 /mo · $798/yr
- HOA
- −$0
- Vacancy / Maint / Mgmt
- −$456
- Net cashflow
- $19
Break-even live
UW: 25.0% down · 7.5% · 30yr · 1.5% tax · 5.0% vac · 8.0% maint · 8.0% mgmt
Financing live
Cash to close
- Down payment
- $50,000
- Closing costs
- $6,000
- Reserves months
- —
- Total cash needed
- —
Loan-product check · same deal, 3 products live
Conventional
25% down · 7.5% · 30yr
- Down + closing
- —
- Monthly P&I
- —
- Monthly cashflow
- —
- DSCR
- —
- Eligible?
- —
Personal DTI + credit; lowest rate.
DSCR
20% down · 8.5% · 30yr
- Down + closing
- —
- Monthly P&I
- —
- Monthly cashflow
- —
- DSCR
- —
- Eligible?
- —
No personal income docs; deal must DSCR.
Hard money
10% down · 12.0% · 12mo
- Down + closing
- —
- Monthly P&I
- —
- Monthly cashflow
- —
- DSCR
- —
- Eligible?
- —
Short-term bridge; refi at stabilization.
Rent comps 3 comps
| Address | Beds | Baths | Sqft | Rent | $/sqft | DOM | Units | Dist |
|---|---|---|---|---|---|---|---|---|
| 6044 Marysville Blvd Rio Linda, CA | 2.0 | 1.0 | 700 | $1,625 | $2.32 | 1d | 1 | 0.32mi |
| 6472 Linn Way Rio Linda, CA | 3.0 | 1.0 | 1026 | $2,345 | $2.29 | 16d | 1 | 0.47mi |
| 245 Withington Ave Rio Linda, CA | 3.0 | 2.0 | 1067 | $2,550 | $2.39 | 10d | 1 | 0.50mi |
Listing history 4 events
-
2026-06-18days on market $200,000 Active 3 DOM
-
2026-06-17days on market $200,000 Active 2 DOM
-
2026-06-16remarks 126-char remark
-
2026-06-16$200,000 Active 1 DOM
ⓘ Source: listings_history table (triggers on properties + properties_extension) + one-shot
backfill from property_details.listing_events for pre-trigger history.
Tax reassessment forecast CA · Resets to sale price
- Current annual tax
- $5,963 · $497/mo
- Projected year-2 tax
- $5,963 · $497/mo
- Expected delta
- $0/yr ($0/mo · 0.0%)
ⓘ Screening estimate from a state-policy table — verify with the county assessor before closing.
Climate risk First Street
- Flood 7/10 Severe FEMA zone X (shaded) · 96% chance over 30 yrs
- Wildfire 7/10 Severe
- Heat 7/10 Severe 7 d/yr ≥102°F today · 15 d/yr by 30 yrs out
- Wind 1/10 Low
- Air quality 10/10 Extreme 29 unhealthy d/yr today · 33 by 30 yrs out
Nearby sold comps map
Loading sold comps map…
Walkable amenities ~0.75 mi
Loading nearby amenities…
Taxation est. · year 1
- Rental income
- $26,048
- − Mortgage interest
- −$11,203
- − Property taxes
- −$5,963
- − Insurance
- −$1,798
- − Repairs & maintenance
- −$2,084
- − Management
- −$2,084
- − Depreciation
- −$5,818
- Taxable loss
- −$2,901
- Est. tax savings @ 24.0%
- +$696
- After-tax cash flow
- $928/yr
For passive investors: Depreciation is non-cash, so a rental often shows a tax loss while cash-flowing — sheltering income. Rental losses are passive: they offset passive income freely, and up to $25,000/yr can offset ordinary (W-2) income if you actively participate and your MAGI is under $100k (phasing out to $0 by $150k); unused losses carry forward. On sale, claimed depreciation is recaptured at up to 25%, and gains may owe capital-gains tax (a 1031 exchange can defer both). Figures are a year-1 estimate at your 24.0% rate — not tax advice; consult a CPA.
Schools (NCES district)
- District
- Twin Rivers Unified
- NCES district ID
- 0601332
- Math proficiency
- 29% ▲ 2.00%
- Reading proficiency
- 37% ▲ 2.00%
- Median HH income
- $42,481
- Composite
- 30.67/100
- National rank
- #11437
- State rank
- #970 of 1400 in CA
Livability — Rio Linda
- Score
- 55/100
- State rank
- #856
- US rank
- #23451
Category grades
Schools grade is shown separately in the Schools card above.
Census & demographics
- Census place
- Rio Linda, CA
- City population
- 16,935
- Population (ZIP)
- 16,935
Population outlook (Sacramento County) Hauer SSP2
- Today (2025)
- 1,660,763 people
- By 2030
- 1,732,990 · +4.3%
- By 2040
- 1,855,755 · +11.7%
- By 2050
- 1,941,335 · +16.9%
- By 2075
- 2,046,162 · +23.2%
- By 2100
- 1,961,444 · +18.1%
Race, ethnicity, and origin ACS 2023
- Neighborhood character
- Diverse neighborhood (Simpson 0.56)
- Race & ethnicity
- White 60% Hispanic / Latino 26% Asian 8% Two or more races 8% Black 3%
- Hispanic origin (detail)
- Mexican 22% Puerto Rican 2%
- Common ancestry
- Scotch-Irish 4% Subsaharan African 2% Italian 2%
- Foreign-born
- 17% · Canada, South Korea, Vietnam
- Languages at home
- 71% English-only · Spanish 14% Russian/Polish/Slavic 7% Other Asian/Pacific 5%
Political lean MEDSL · Sacramento
- 2024 margin
- D (+19.7) · D 58.1% · R 38.4% · Other 3.5%
- 2008→2024 swing
- +0.7pp no change · 2008: 19.0pp · 2024: 19.7pp
- All cycles
- 2024: D+19.7 2020: D+25.3 2016: D+23.7 2012: D+16.3 2008: D+19.0
Not yet ingested
- Civics
- —
Market trends
- HPI YoY
- ▼ -339.49%
- Current HPI
- 356.5128
- Rent YoY
- —
- Metro
- —
- State GDP YoY
- ▲ 3.21%
- F500 in state
- 116
Industry mix (Fortune 500 HQ in CA)
| Industry | F500 HQs | Revenue |
|---|---|---|
| Technology | 27 | $1,492B |
|
||
| Financial Services | 3 | $174B |
|
||
| Retail | 3 | $44B |
|
||
| Insurance | 3 | $26B |
|
||
| Media / Entertainment | 2 | $115B |
|
||
| Pharmaceuticals / Biotech | 2 | $62B |
|
||
Price history
1 event — show timeline
- 1988-07-08 Sold (Public Records) $72,000 Public Records
Property tax history
+10.1%/yrLatest (2025): $5,963 · +147.1% YoY. Source: county tax records.
Cash-flow waterfall
monthlySold comps — $/sqft
last 12 mo · ≤1 miLoading sold comps…