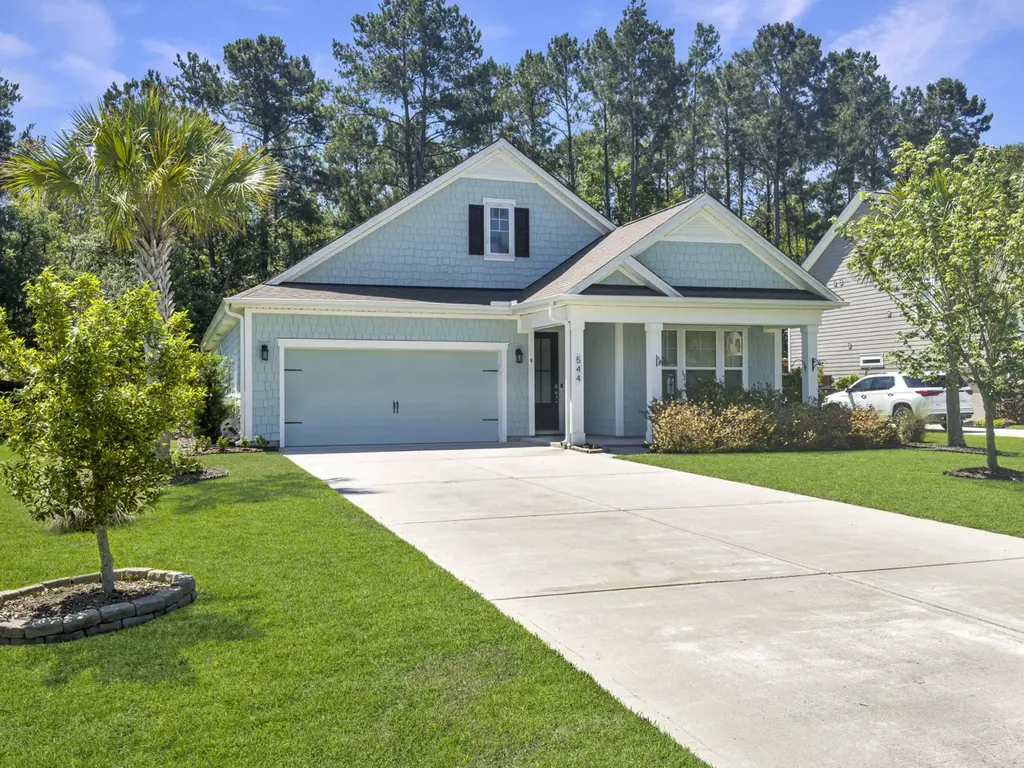
544 Pontoon Rd · Charleston, SC
Flood risk 1/10 · Minimal
- FEMA flood zone
- X (unshaded)
- Chance of flooding over 30 yrs
- 0.0%
- Est. flood insurance / yr
- $507 – $1,088
Fire risk 6/10 · Moderate
- Est. fire insurance / yr
- $783 – $1,453
Heat risk 9/10 · Severe
- Hot days now (above 107°F)
- 7 days/yr
- Hot days in 30 yrs
- 18 days/yr
Wind risk 8/10 · Major
- Chance of severe wind over 30 yrs
- 98.0%
Air-quality risk 3/10 · Minor
- Unhealthy air days now
- 3 days/yr
- Unhealthy air days in 30 yrs
- 4 days/yr
Risk factors via First Street. Map © Google.
Why this score? — see what drove the D grade
The composite is a weighted blend of 9 inputs, each scored 0–100. Each bar is that input's sub-score; the figure is the points it added to the 100-point composite (weight × sub-score).
- Cash flow +15.2/30.0
- DSCR +4.7/10.0
- Appreciation +4.4/10.0
- Livability +3.8/5.0
- Schools +3.6/10.0
- 1% rule +3.3/10.0
- Rent growth +2.5/5.0
- Condition / age +2.5/5.0
- ARV discount +0.7/15.0
$635,000
🖨 Deal sheet 📄 Offer letter ✓ Due diligence
Listing remarks MLS
Welcome to this Charming one-story home located in a peaceful neighborhood of Bridges of Seven Lakes. This gated community offers Play Parks, Dog Park, Walking Paths, a Swimming Pool overlooking the lake with a dock with a covered pavilion. In your new home you will find 3 bedrooms, and 2 full bathrooms. ALL ROOMS HAVE CEILING FANS. Before crossing the threshold, an inviting front porch welcomes you into this wonderful spacious floor plan. The home has lots of natural light, 9-foot ceilings which allows for a very open and spacious feel. The foyer is embellished with beautiful flooring that flow into the main living area accented with exquisite crown molding and wainscoting. NEW AND IMPROVED SEPTIC COMPRESSOR. TERMITE BOND GOOD FOR 3 YEARSIn the kitchen you will find recess lighting, stunning cabinets, backsplash behind the gas stove, stainless steel appliances, huge pantry, an island, granite countertops, and pendant lighting. The master bedroom has access to two walk-in closets, one is the master bedroom and the other is in the master bathroom. Both closets have magnificent custom shelving. The master bath also has tile floors, dual sinks, and a large shower. You will find the 2nd bedroom with picturesque windows allowing lots of light and sunshine. The 3rd bedroom has shiplap and sliding barn door. There is a large laundry room with tile flooring. The living/dining area has access to the screened in patio. Enjoy your morning coffee sitting in your screened in patio. Here you can enjoy the quiet peaceful serenity of your backyard retreat. In the backyard you will find a custom shed. The property also has an irrigation system, security system, hurricane shutters, gutters, and has a fully fenced in yard.
Key facts
- Firepit
- Backs up to woods
- Screened porch
Tags
Property features AI
Finance
- HOA & community: Annual association fee; Community amenities include dock facilities, dog park, gated entry, park, pool, trash service, and walk/jog trails
Exterior
- Parking: 2-car garage with garage door opener; 2 total parking spaces
- Utilities: Septic tank; BCW & SA utility service; Dominion Energy power
- Home design: Single-family detached home; One story; Ground-level entry
- Construction: Architectural roof; Fee simple ownership
- Exterior features: Lawn irrigation; Rain gutters; Metal and wood fencing
Interior
- Kitchen: Dishwasher; Disposal; Gas cooktop; Microwave; Refrigerator; ENERGY STAR qualified appliances; Tankless water heater
- Bedrooms: 3 bedrooms; Primary bedroom with ceiling fan, multiple closets and a walk-in closet
- Flooring: Carpet; Ceramic tile
- Bathrooms: 2 bathrooms
- Heating & cooling: Central air conditioning; Electric forced air heating
- Interior features: Smooth ceilings; High ceilings; Kitchen island; Living/dining combo; Pantry; Ceiling fans
- Laundry & utility: Laundry room with washer and electric dryer hookups
Neighborhood map
What this means for you Summary
Snapshot
- This is a 3-bed/2.0-bath single-family listed at $635k.
Deal economics
- At list price, monthly cash flow is $217 ($3k/yr) — positive.
- The deal already cash-flows at list — no discount required.
- To meet the 1% rule (rent ≥ 1% of price), the offer needs to be $528k (16.8% below list).
- Recommended offer: $528k (16.8% below list) — sets the bar for 1% rule.
- Cap rate 6.7% vs local median 2.4% in Charleston — top-decile yield for the area; either an underpriced asset or a hidden risk that comps aren't pricing in. Stress-test before assuming the spread holds.
Location & tenants
- Location reads 76/100 on livability (#22 in SC, #3,336 nationally) — a middle-class / working-renter tenant base. Strengths: amenities A+, housing A+, health & safety A+; Watch: crime D+, commute F, cost of living D-.
- Berkeley 01 (suburban): math 35% / reading 48% proficiency, ranked #30 of 80 in SC (top 38%) — families likely to look elsewhere, expect single-tenant / working-renter base with shorter leases.
- Zoned schools: Cainhoy Elementary (math 2% / reading 12%, grade F, #594 of 597 statewide, top 100%, 154 students, 100% FRL); Philip Simmons Middle (math 31% / reading 48%, grade F, #82 of 229 statewide, top 37%, 428 students, 35% FRL); Philip Simmons High (math 42% / reading 92%, grade B, #73 of 196 statewide, top 41%, 771 students, 21% FRL) — zoned schools at 52% FRL track the district average.
- Market conditions: 69 active listings in the ZIP; 3,183 units permitted in Berkeley County in 2024 (580 in 5+ unit buildings).
Forward outlook
- Local home prices are declining (-1.1%/yr); year-one equity from $4k of loan paydown is wiped out by about $7k of value loss. Plan a longer hold.
- Berkeley County population projected at +48% by 2050 — long-run rental-demand tailwind backs the buy-and-hold thesis.
Negotiation context
- Only 12 days on market — expect competitive offers; lowballing is unlikely to land.
- 5 sale attempts since 6y ago with the ask held roughly flat each time — persistent listings suggest the price (not the market) is what's stuck; bring a comps-based counter.
- Current owner paid $549k; 16% above their basis — modest negotiation headroom, anchor on the comps not their cost.
Risks & watch-outs
- Climate carrying-cost: severe wind risk, 98% chance of damaging wind over 30y; major wildfire risk; extreme-heat days projected 7→18/yr by 2055 (HVAC capex compounding) — expect insurance premiums to compound above CPI over the hold.
Questions for the listing agent
- What does the HOA fee cover, when was the last increase, and are there any pending special assessments or reserve-fund shortfalls?
- Is there a deadline driving the sale (1031 exchange, divorce, estate, relocation)? That informs how much negotiation room exists.
- Schools are A-rated — typically a magnet for longer-tenancy family renters. What's the average tenant stay here, and is there a school-zone premium baked into asking?
- Crime grade is D in this area — have there been break-ins, vandalism, or insurance claims at this property in the last 3 years? What carrier currently insures it and at what premium?
- The area grade is low — what's the realistic commute time and amenity access for the typical tenant pool here? Any planned neighborhood developments (good or bad) we should know about?
- What's the average days-on-market for RENTAL listings here right now (not sales)? A rising rental-DOM trend means longer vacancies and softer asking-rent achievability than the comps imply.
- What's the recent tenant-quality profile in this submarket — average credit score on applications, eviction rate, late-payment / NSF rate, and stable-employment percentage? A property-management company in the area should have these aggregated.
- How much new for-sale + rental construction is in the pipeline within 1–3 miles? Heavy new supply typically softens prices + rents 12–24 months out; constrained supply supports both.
Investment metrics
- 1% rule
- 0.83% ✗
- Cap rate
- 6.70%
- Cash-on-cash
- 1.47%
- DSCR
- 1.07
- GRM
- 10.0
CMA / ARV
- ARV (on-the-fly)
- $551,874
- Comps found
- 1
Show comp detail 1 sale within ~0.75 mi
| Address | Dist | Beds/Ba | Sqft | Sold | Price | $/sf | Match |
|---|---|---|---|---|---|---|---|
| 679 Pontoon Rd | 0.37mi | 3/3.0 | 1,944 (+9%) | 22mo | $600,000 | $309 | 46 |
Match score weights: distance 35% · size 25% · config 20% · recency 20%. Top-matched comps best support the ARV.
Projected returns pro-forma
-1.12% appreciation · 3.0% rent growth · sell at horizon
- IRR
- -4.9%
- Equity multiple
- 0.79×
- Total profit
- $-37,476
- Equity at exit
- $149,746
- IRR
- 2.0%
- Equity multiple
- 1.18×
- Total profit
- $32,753
- Equity at exit
- $154,251
Cash invested: $177,800 (down + closing). Projections, not guarantees.
Landlord ↔ Tenant lean methodology
- Overall (STATE)
- 90 Strongly Landlord-Friendly
- State South Carolina
- 90 Strongly Landlord-Friendly · R+6
- County
- — inherits STATE
- City
- — inherits STATE
ZIP-level market 29450
- Home prices YoY
- -0.2%
- Active inventory
- 69
- Price-to-rent
- 10.0×
Monthly cashflow live
- Estimated rent
- $5,282 medium interval (Pro) →
- Mortgage (P&I)
- −$3,330
- Tax from tax record
- −$182 /mo · $2,180/yr
- Insurance
- −$265
- HOA
- −$179
- Vacancy / Maint / Mgmt
- −$1,109
- Net cashflow
- $217
Break-even live
UW: 25.0% down · 7.5% · 30yr · 1.5% tax · 5.0% vac · 8.0% maint · 8.0% mgmt
Financing live
Cash to close
- Down payment
- $158,750
- Closing costs
- $19,050
- Reserves months
- —
- Total cash needed
- —
Loan-product check · same deal, 3 products live
Conventional
25% down · 7.5% · 30yr
- Down + closing
- —
- Monthly P&I
- —
- Monthly cashflow
- —
- DSCR
- —
- Eligible?
- —
Personal DTI + credit; lowest rate.
DSCR
20% down · 8.5% · 30yr
- Down + closing
- —
- Monthly P&I
- —
- Monthly cashflow
- —
- DSCR
- —
- Eligible?
- —
No personal income docs; deal must DSCR.
Hard money
10% down · 12.0% · 12mo
- Down + closing
- —
- Monthly P&I
- —
- Monthly cashflow
- —
- DSCR
- —
- Eligible?
- —
Short-term bridge; refi at stabilization.
HOA detail
- Monthly dues
- $179 · $2,148/yr
- Likely covers
- gaspoolsecurity
Listing history 11 events
-
2026-06-18days on market $635,000 Active 12 DOM
-
2026-06-17days on market $635,000 Active 11 DOM
-
2026-06-16days on market $635,000 Active 10 DOM
-
2026-06-15days on market $635,000 Active 9 DOM
-
2026-06-13days on market $635,000 Active 7 DOM
-
2026-06-13days on market $635,000 Active 6 DOM
-
2026-06-10days on market $635,000 Active 4 DOM
-
2026-06-09days on market $635,000 Active 3 DOM
-
2026-06-08days on market $635,000 Active 2 DOM
-
2026-06-07remarks 699-char remark
-
2026-06-07$635,000 Active 1 DOM
ⓘ Source: listings_history table (triggers on properties + properties_extension) + one-shot
backfill from property_details.listing_events for pre-trigger history.
Tax reassessment forecast SC · Resets to sale price
- Current annual tax
- $2,180 · $182/mo
- Projected year-2 tax
- $3,620 · $302/mo
- Expected delta
- +$1,440/yr (+$120/mo · 66.1%)
ⓘ Screening estimate from a state-policy table — verify with the county assessor before closing.
Climate risk First Street
- Flood 1/10 Low FEMA zone X (unshaded) · 0% chance over 30 yrs
- Wildfire 6/10 Major
- Heat 9/10 Extreme 7 d/yr ≥107°F today · 18 d/yr by 30 yrs out
- Wind 8/10 Severe 98% chance of damaging wind over 30 yrs
- Air quality 3/10 Moderate 3 unhealthy d/yr today · 4 by 30 yrs out
Nearby sold comps map
Loading sold comps map…
Walkable amenities ~0.75 mi
Loading nearby amenities…
Taxation est. · year 1
- Rental income
- $63,382
- − Mortgage interest
- −$35,570
- − Property taxes
- −$2,180
- − Insurance
- −$3,175
- − Repairs & maintenance
- −$5,071
- − Management
- −$5,071
- − HOA
- −$2,148
- − Depreciation
- −$18,473
- Taxable loss
- −$8,305
- Est. tax savings @ 24.0%
- +$1,993
- After-tax cash flow
- $4,602/yr
For passive investors: Depreciation is non-cash, so a rental often shows a tax loss while cash-flowing — sheltering income. Rental losses are passive: they offset passive income freely, and up to $25,000/yr can offset ordinary (W-2) income if you actively participate and your MAGI is under $100k (phasing out to $0 by $150k); unused losses carry forward. On sale, claimed depreciation is recaptured at up to 25%, and gains may owe capital-gains tax (a 1031 exchange can defer both). Figures are a year-1 estimate at your 24.0% rate — not tax advice; consult a CPA.
Schools (NCES district)
- District
- Berkeley 01
- NCES district ID
- 4501170
- Math proficiency
- 35% ▼ -8.00%
- Reading proficiency
- 48% ▼ -2.00%
- Median HH income
- $52,724
- Composite
- 35.95/100
- National rank
- #4799
- State rank
- #30 of 80 in SC
Livability — Charleston
- Score
- 76/100
- State rank
- #22
- US rank
- #3336
Category grades
Schools grade is shown separately in the Schools card above.
Census & demographics
- City population
- 200,573
- Population (ZIP)
- 3,124
Population outlook (Berkeley County) Hauer SSP2
- Today (2025)
- 254,184 people
- By 2030
- 279,677 · +10.0%
- By 2040
- 329,379 · +29.6%
- By 2050
- 375,557 · +47.8%
- By 2075
- 476,740 · +87.6%
- By 2100
- 535,945 · +110.8%
Race, ethnicity, and origin ACS 2023
- Neighborhood character
- Majority Black (64%)
- Race & ethnicity
- Black 64% White 25% Hispanic / Latino 9% Two or more races 4%
- Hispanic origin (detail)
- Mexican 6% Dominican 2%
- Common ancestry
- Serbian 7% Italian 1% Lithuanian 1%
- Foreign-born
- 2% · Canada
- Languages at home
- 96% English-only · Spanish 3%
Political lean MEDSL · Berkeley
- 2024 margin
- R (+16.3) · D 41.1% · R 57.4% · Other 1.4%
- 2008→2024 swing
- -3.2pp toward R · 2008: -13.1pp · 2024: -16.3pp
- All cycles
- 2024: R+16.3 2020: R+11.7 2016: R+17.4 2012: R+18.9 2008: R+13.1
Not yet ingested
- Civics
- —
Market trends
- HPI YoY
- ▼ -1.12%
- Current HPI
- 462.4619
- Rent YoY
- —
- Metro
- —
- State GDP YoY
- ▲ 4.51%
- F500 in state
- 2
Industry mix (Fortune 500 HQ in SC)
| Industry | F500 HQs | Revenue |
|---|---|---|
| Packaging | 1 | $7B |
|
||
Price history
+59.6% since first listed18 events — show timeline
- 2026-06-06 Listed $635,000 Charleston Trident MLS
- 2024-11-12 Sold (Public Records) $549,000 Public Records
- 2024-11-12 Sold (MLS) $549,000 Charleston Trident MLS
- 2024-09-15 Contingent — Charleston Trident MLS
- 2024-08-30 Price Changed $549,000 Charleston Trident MLS
- 2024-05-15 Price Changed $564,999 Charleston Trident MLS
- 2024-05-05 Relisted — Charleston Trident MLS
- 2024-04-28 Contingent — Charleston Trident MLS
- 2024-04-07 Price Changed $569,000 Charleston Trident MLS
- 2024-03-03 Listed $575,000 Charleston Trident MLS
- 2023-10-03 Listing Removed — Charleston Trident MLS
- 2023-09-18 Price Changed $594,999 Charleston Trident MLS
- 2023-09-02 Listed $599,999 Charleston Trident MLS
- 2021-03-31 Sold (MLS) $430,035 Charleston Trident MLS
- 2020-09-04 Price Changed $429,665 Charleston Trident MLS
- 2020-09-04 Contingent — Charleston Trident MLS
- 2020-04-21 Price Changed $399,900 Charleston Trident MLS
- 2020-02-14 Listed $397,900 Charleston Trident MLS
Property tax history
+141.1%/yrLatest (2025): $2,180 · +14.3% YoY. Source: county tax records.
Cash-flow waterfall
monthlySold comps — $/sqft
last 12 mo · ≤1 miLoading sold comps…