722 Berlander Dr · Independence, KY
Flood risk 1/10 · Minimal
- FEMA flood zone
- X (unshaded)
- Chance of flooding over 30 yrs
- 0.0%
- Est. flood insurance / yr
- $507 – $1,088
Fire risk 3/10 · Minor
- Est. fire insurance / yr
- $839 – $1,559
Heat risk 4/10 · Minor
- Hot days now (above 102°F)
- 7 days/yr
- Hot days in 30 yrs
- 19 days/yr
Wind risk 2/10 · Minimal
- Chance of severe wind over 30 yrs
- 1.0%
Air-quality risk 3/10 · Minor
- Unhealthy air days now
- 2 days/yr
- Unhealthy air days in 30 yrs
- 4 days/yr
Risk factors via First Street. Map © Google.
Why this score? — see what drove the D grade
The composite is a weighted blend of 9 inputs, each scored 0–100. Each bar is that input's sub-score; the figure is the points it added to the 100-point composite (weight × sub-score).
- Cash flow +12.1/30.0
- ARV discount +9.3/15.0
- Schools +4.0/10.0
- Rent growth +3.8/5.0
- DSCR +3.6/10.0
- Livability +3.6/5.0
- 1% rule +2.9/10.0
- Condition / age +2.5/5.0
- Appreciation +0.0/10.0
$274,900
🖨 Deal sheet (PDF) 📄 Offer letter ✓ Due diligence
Listing remarks MLS
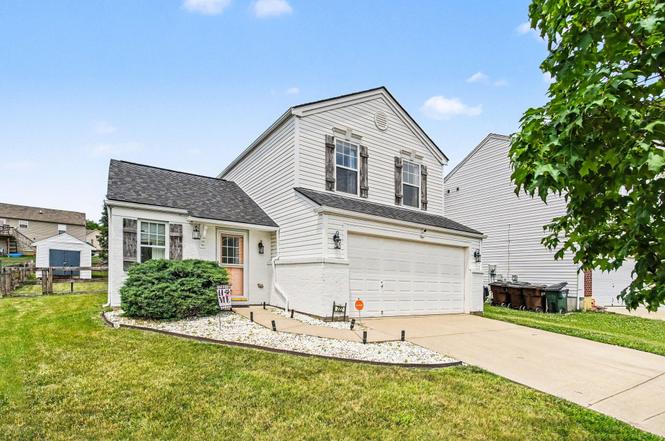
Well-loved move in ready 2-story home in Glenhurst community. Attractive exterior boasts painted brick, distressed wood shutters, & dimensional shingled roof. Open & airy main level features soaring cathedral ceilings in the living room & luxury vinyl flooring throughout. Tasteful neutral décor, 6 panel doors, & modernized lighting. Cute updated 1st floor half bath. Fully equipped eat in kitchen includes SS appliances, walk in pantry, adjoining dining room & walkout to the rear yard. Convenient tiled laundry room has sink & cabinets for storage plus walks out to the 2 car garage w/ opener. Fenced usable yard, paver patio, & shed. Primary suite w/ overhead fan, walk in closet, & updated tiled bath. 2nd tiled full bath & 2 additional bedrooms w/ ceiling fans on 2nd floor.
Key facts
- 5,985 sq ft lot
- 2 garage spots
- Built 2006
Property features AI
Exterior
- Parking: Attached 2-car garage; Driveway; Garage with automatic door opener; Garage faces front
- Utilities: Public water; Public sewer
- Home design: Single family house; Two levels; Built in 2006
- Construction: Brick and vinyl siding exterior; Shingle roof; Slab foundation
- Exterior features: Patio; Wood fencing; Cleared lot; Outbuilding
Interior
- Kitchen: Stainless steel appliances; Electric oven; Electric range; Dishwasher; Garbage disposal; Microwave; Refrigerator; Eat-in layout
- Bedrooms: Primary bedroom (13 x 13); Bedroom 2 (11 x 9); Bedroom 3 (11 x 9)
- Bathrooms: 2 full bathrooms; 1 half bathroom; Primary bath is an en suite
- Heating & cooling: Heat pump heating (electric); Central air conditioning
- Interior features: Walk-in closets; Entrance foyer; Eat-in kitchen; Cathedral ceilings; Ceiling fans; High ceilings; Multi-panel doors
- Laundry & utility: Washer hookup; Electric dryer hookup; Main level laundry; Washer included (stated)
Neighborhood map
What this means for you Summary
Snapshot
- This is a 3-bed/2.5-bath single-family listed at $275k.
Deal economics
- At list price, monthly cash flow is $-60 ($-714/yr) — negative.
- To cash-flow at today's rent, offer at most $264k (3.8% below list).
- To meet the 1% rule (rent ≥ 1% of price), the offer needs to be $217k (21.0% below list).
- Recommended offer: $217k (21.0% below list) — sets the bar for 1% rule.
- Cap rate 6.0% vs local median 3.7% in Independence — top-decile yield for the area; either an underpriced asset or a hidden risk that comps aren't pricing in. Stress-test before assuming the spread holds.
Location & tenants
- Location reads 72/100 on livability (#130 in KY) — a middle-class / working-renter tenant base. Strengths: crime A+, employment A+, cost of living A+; Watch: amenities F, commute F, health & safety F.
- Kenton County (suburban): math 42% / reading 48% proficiency, ranked #14 of 165 in KY (top 8%) — families likely to look elsewhere, expect single-tenant / working-renter base with shorter leases.
- Zoned schools: Beechgrove Elementary School (math 41% / reading 42%, grade F, #197 of 676 statewide, top 29%, 660 students, 61% FRL); Twenhofel Middle School (math 33% / reading 47%, grade F, #59 of 217 statewide, top 29%, 835 students, 39% FRL); Simon Kenton High School (math 40% / reading 44%, grade F, #32 of 254 statewide, top 13%, 1,859 students, 37% FRL).
- Market conditions: Rents rising fast (+5.4%/yr); 258 active listings in the ZIP; 4 comparable units currently listed for rent nearby; rentals at typical pace (median 25d on market — plan ~3-4 weeks tenant-placement turnaround); solid renter incomes; 699 units permitted in Kenton County in 2024 (287 in 5+ unit buildings).
Forward outlook
- Local home prices are declining (-3.0%/yr); year-one equity from $2k of loan paydown is wiped out by about $8k of value loss. Plan a longer hold.
- Kenton County population projected at +5% by 2050 — modest demand growth; plan on rents tracking national, not racing it.
Negotiation context
- Only 2 days on market — expect competitive offers; lowballing is unlikely to land.
- 3 sale attempts since 9y ago with the ask held roughly flat each time — persistent listings suggest the price (not the market) is what's stuck; bring a comps-based counter.
Questions for the listing agent
- What do current leases actually rent for vs. the listed asking? Can we see a recent rent roll and the last 12 months of T-12 income?
- Is there a deadline driving the sale (1031 exchange, divorce, estate, relocation)? That informs how much negotiation room exists.
- Schools are B-rated — typically a magnet for longer-tenancy family renters. What's the average tenant stay here, and is there a school-zone premium baked into asking?
- The area grade is low — what's the realistic commute time and amenity access for the typical tenant pool here? Any planned neighborhood developments (good or bad) we should know about?
- What's the average days-on-market for RENTAL listings here right now (not sales)? A rising rental-DOM trend means longer vacancies and softer asking-rent achievability than the comps imply.
- What's the recent tenant-quality profile in this submarket — average credit score on applications, eviction rate, late-payment / NSF rate, and stable-employment percentage? A property-management company in the area should have these aggregated.
- How much new for-sale + rental construction is in the pipeline within 1–3 miles? Heavy new supply typically softens prices + rents 12–24 months out; constrained supply supports both.
Investment metrics
- 1% rule
- 0.79% ✗
- Cap rate
- 6.03%
- Cash-on-cash
- -0.93%
- DSCR
- 0.96
- GRM
- 10.6
CMA / ARV
- ARV (on-the-fly)
- $286,272
- Comps found
- 12
Show comp detail 12 sales within ~0.75 mi
| Address | Dist | Beds/Ba | Sqft | Sold | Price | $/sf | Match |
|---|---|---|---|---|---|---|---|
| 722 Berlander Dr | 0.00mi | 3/2.5 | 1,344 (0%) | 5mo | $259,900 | $193 | 96 |
| 665 Berlander Dr | 0.13mi | 3/2.5 | 1,436 (+7%) | 4mo | $275,000 | $192 | 79 |
| 639 Hornbean Dr | 0.31mi | 3/2.5 | 1,284 (-4%) | 5mo | $266,000 | $207 | 74 |
| 622 Branch Ct | 0.31mi | 3/3.0 | 1,267 (-6%) | 4mo | $270,000 | $213 | 70 |
| 10649 Kelsey Dr | 0.34mi | 4/2.0 (+1) | 1,400 (+4%) | 2mo | $325,000 | $232 | 69 |
| 461 Maher Rd | 0.64mi | 3/2.5 | 1,328 (-1%) | 2mo | $225,000 | $169 | 66 |
| 586 Berlander Dr | 0.29mi | 3/2.0 | 1,201 (-11%) | 8mo | $251,000 | $209 | 60 |
| 800 Berlander Dr | 0.36mi | 3/3.0 | 1,508 (+12%) | 2mo | $330,000 | $219 | 59 |
| 801 Berlander Dr | 0.37mi | 3/3.5 | 1,508 (+12%) | 1mo | $350,000 | $232 | 58 |
| 558 Tupelo Dr | 0.43mi | 3/2.5 | 1,203 (-10%) | 7mo | $271,000 | $225 | 57 |
| 10720 Melbury Ct Unit 286GL | 0.45mi | 3/2.5 | 1,470 (+9%) | 8mo | $385,900 | $263 | 56 |
| 504 Rosebud Cir | 0.46mi | 4/3.0 (+1) | 1,456 (+8%) | 10mo | $290,000 | $199 | 50 |
Match score weights: distance 35% · size 25% · config 20% · recency 20%. Top-matched comps best support the ARV.
Projected returns pro-forma
-3.0% appreciation · 5.37% rent growth · sell at horizon
- IRR
- -15.4%
- Equity multiple
- 0.44×
- Total profit
- $-43,084
- Equity at exit
- $40,988
- IRR
- -3.5%
- Equity multiple
- 0.74×
- Total profit
- $-19,757
- Equity at exit
- $23,768
Cash invested: $76,972 (down + closing). Projections, not guarantees.
Landlord ↔ Tenant lean methodology
- Overall (STATE)
- 83 Strongly Landlord-Friendly
- State Kentucky
- 83 Strongly Landlord-Friendly · R+16
- County
- — inherits STATE
- City
- — inherits STATE
ZIP-level market 41051
- Home prices YoY
- -32.6%
- Rents YoY
- 5.4%
- Active inventory
- 258
- Price-to-rent
- 10.6×
Monthly cashflow live
- Estimated rent
- $2,170 medium interval (Pro) →
- Mortgage (P&I)
- −$1,442
- Tax from tax record
- −$218 /mo · $2,616/yr
- Insurance
- −$115
- HOA
- −$0
- Vacancy / Maint / Mgmt
- −$456
- Net cashflow
- $-60
Break-even live
Sensitivity live
| Price | -10% $96 | -5% $18 | +0% $-60 | +5% $-137 | +10% $-215 |
|---|---|---|---|---|---|
| Rent | -10% $-231 | -5% $-145 | +0% $-60 | +5% $26 | +10% $112 |
| Rate | -1.0pp $79 | -0.5pp $10 | base $-60 | +0.5pp $-131 | +1.0pp $-203 |
UW: 25.0% down · 7.5% · 30yr · 1.5% tax · 5.0% vac · 8.0% maint · 8.0% mgmt
Financing live
Cash to close
- Down payment
- $68,725
- Closing costs
- $8,247
- Reserves months
- —
- Total cash needed
- —
Loan-product check · same deal, 3 products live
Conventional
25% down · 7.5% · 30yr
- Down + closing
- —
- Monthly P&I
- —
- Monthly cashflow
- —
- DSCR
- —
- Eligible?
- —
Personal DTI + credit; lowest rate.
DSCR
20% down · 8.5% · 30yr
- Down + closing
- —
- Monthly P&I
- —
- Monthly cashflow
- —
- DSCR
- —
- Eligible?
- —
No personal income docs; deal must DSCR.
Hard money
10% down · 12.0% · 12mo
- Down + closing
- —
- Monthly P&I
- —
- Monthly cashflow
- —
- DSCR
- —
- Eligible?
- —
Short-term bridge; refi at stabilization.
Rent comps 4 comps
| Address | Beds | Baths | Sqft | Rent | $/sqft | DOM | Units | Dist |
|---|---|---|---|---|---|---|---|---|
| 71 Deer Haven Ct Unit DH07 Florence, KY | 3.0 | 2.0 | 1400 | $1,950 | $1.39 | 9d | 1 | 1.44mi |
| 71 Deer Haven Ct Unit RL10322 Florence, KY | 3.0 | 2.5 | 1550 | $1,999 | $1.29 | 9d | 1 | 1.44mi |
| 71 Deer Haven Ct Unit DH65 Florence, KY | 3.0 | 2.0 | 1400 | $1,950 | $1.39 | 25d | 1 | 1.44mi |
| 71 Deer Haven Ct Unit DH6 Florence, KY | 3.0 | 2.5 | 1500 | $1,925 | $1.28 | 25d | 1 | 1.44mi |
Listing history 4 events
-
2026-06-17status $274,900 Pending 2 DOM
-
2026-06-17days on market $274,900 Active 2 DOM
-
2026-06-16remarks 678-char remark
-
2026-06-16$274,900 Active 1 DOM
ⓘ Source: listings_history table (triggers on properties + properties_extension) + one-shot
backfill from property_details.listing_events for pre-trigger history.
Tax reassessment forecast KY · Resets to sale price
- Current annual tax
- $2,616 · $218/mo
- Projected year-2 tax
- $2,616 · $218/mo
- Expected delta
- $0/yr ($0/mo · 0.0%)
ⓘ Screening estimate from a state-policy table — verify with the county assessor before closing.
Climate risk First Street
- Flood 1/10 Low FEMA zone X (unshaded) · 0% chance over 30 yrs
- Wildfire 3/10 Moderate
- Heat 4/10 Moderate 7 d/yr ≥102°F today · 19 d/yr by 30 yrs out
- Wind 2/10 Low 100% chance of damaging wind over 30 yrs
- Air quality 3/10 Moderate 2 unhealthy d/yr today · 4 by 30 yrs out
Nearby sold comps map
Loading sold comps map…
Walkable amenities ~0.75 mi
Loading nearby amenities…
Taxation est. · year 1
- Rental income
- $26,045
- − Mortgage interest
- −$15,399
- − Property taxes
- −$2,616
- − Insurance
- −$1,374
- − Repairs & maintenance
- −$2,084
- − Management
- −$2,084
- − Depreciation
- −$7,997
- Taxable loss
- −$5,509
- Est. tax savings @ 24.0%
- +$1,322
- After-tax cash flow
- $608/yr
For passive investors: Depreciation is non-cash, so a rental often shows a tax loss while cash-flowing — sheltering income. Rental losses are passive: they offset passive income freely, and up to $25,000/yr can offset ordinary (W-2) income if you actively participate and your MAGI is under $100k (phasing out to $0 by $150k); unused losses carry forward. On sale, claimed depreciation is recaptured at up to 25%, and gains may owe capital-gains tax (a 1031 exchange can defer both). Figures are a year-1 estimate at your 24.0% rate — not tax advice; consult a CPA.
Schools (NCES district)
- District
- Kenton County
- NCES district ID
- 2103090
- Math proficiency
- 42% ▼ -13.00%
- Reading proficiency
- 48% ▼ -14.00%
- Median HH income
- $66,183
- Composite
- 40.17/100
- National rank
- #3789
- State rank
- #14 of 165 in KY
Livability — Independence
- Score
- 72/100
- State rank
- #130
- US rank
- #6165
Category grades
Schools grade is shown separately in the Schools card above.
Census & demographics
- Census place
- Independence, KY
- County
- Kenton County · 142,881 people
- City population
- 33,054
- Metro
- Cincinnati, OH-KY-IN
- Population (ZIP)
- 33,054
- Household income
- $104,201
- Rent vs Own
- Severe rent burden
- 243.0
Population outlook (Kenton County) Hauer SSP2
- Today (2025)
- 174,205 people
- By 2030
- 177,897 · +2.1%
- By 2040
- 182,671 · +4.9%
- By 2050
- 183,543 · +5.4%
- By 2075
- 178,977 · +2.7%
- By 2100
- 159,920 · -8.2%
Race, ethnicity, and origin ACS 2023
- Neighborhood character
- Predominantly White (93%)
- Race & ethnicity
- White 93% Two or more races 3% Hispanic / Latino 2% Black 1% Asian 1%
- Common ancestry
- Italian 3% Lithuanian 3% Slovak 2%
- Foreign-born
- 3% · China, Canada
- Languages at home
- 96% English-only · Spanish 1% Chinese 1% Other Asian/Pacific 1%
Political lean MEDSL · Kenton
- 2024 margin
- Strong R (+21.7) · D 38.2% · R 59.9% · Other 1.9%
- 2008→2024 swing
- -0.9pp no change · 2008: -20.9pp · 2024: -21.7pp
- All cycles
- 2024: R+21.7 2020: R+19.3 2016: R+26.1 2012: R+24.3 2008: R+20.9
Not yet ingested
- Civics
- —
Market trends
- HPI YoY
- ▼ -105.60%
- Current HPI
- 218.492
- Rent YoY
- ▲ 5.37%
- Metro
- Cincinnati, OH-KY-IN
- State GDP YoY
- ▲ 1.81%
- F500 in state
- 4
Industry mix (Fortune 500 HQ in KY)
| Industry | F500 HQs | Revenue |
|---|---|---|
| Healthcare | 1 | $118B |
|
||
| Food / Beverage | 1 | $7B |
|
||
Price history
+77.5% since first listed9 events — show timeline
- 2026-06-15 Listed $274,900 NKMLS
- 2026-01-14 Sold (Public Records) $259,900 Public Records
- 2026-01-09 Sold (MLS) $259,900 NKMLS
- 2025-12-03 Pending — NKMLS
- 2025-11-24 Price Changed $259,900 NKMLS
- 2025-11-13 Listed $269,900 NKMLS
- 2017-10-27 Sold (Public Records) $154,500 Public Records
- 2017-10-25 Sold (MLS) $154,500 NKMLS
- 2017-09-05 Listed $154,900 NKMLS
Property tax history
+3.7%/yrLatest (2025): $2,616 · +12.8% YoY. Source: county tax records.
Cash-flow waterfall
monthlySold comps — $/sqft
last 12 mo · ≤1 miLoading sold comps…