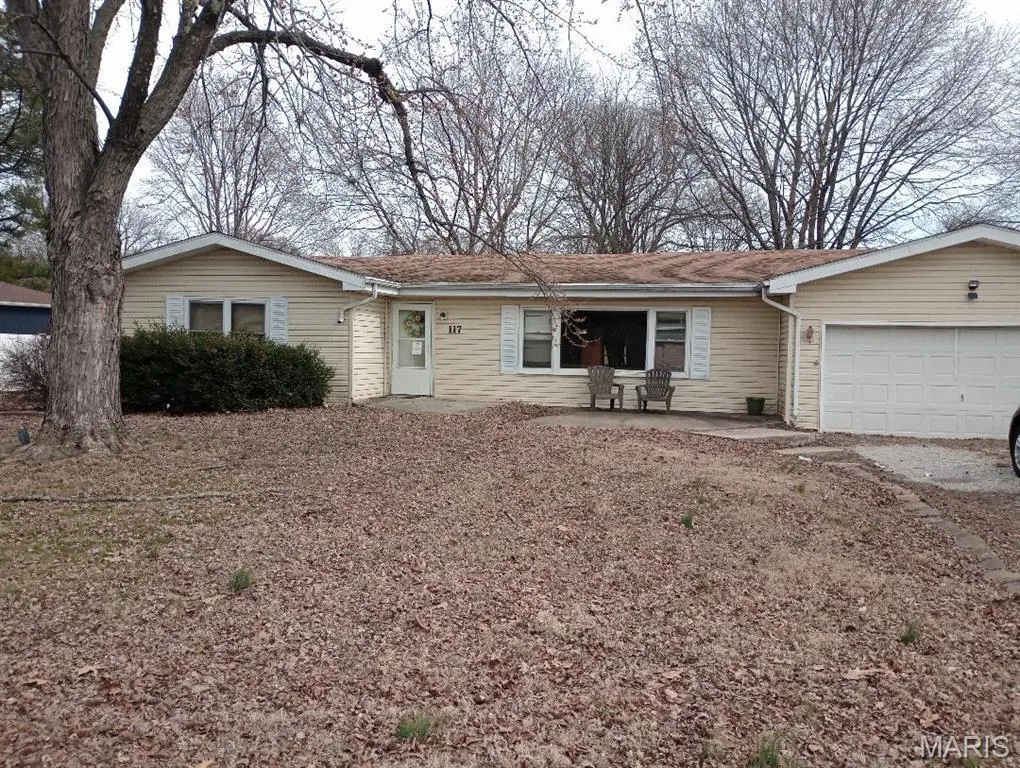
117 Bonita St · Wood River, IL
Flood risk 7/10 · Major
- FEMA flood zone
- X
- Chance of flooding over 30 yrs
- 0.76%
- Est. flood insurance / yr
- $507 – $1,088
Fire risk 1/10 · Minimal
- Est. fire insurance / yr
- $804 – $1,492
Heat risk 5/10 · Moderate
- Hot days now (above 107°F)
- 7 days/yr
- Hot days in 30 yrs
- 20 days/yr
Wind risk 2/10 · Minimal
- Chance of severe wind over 30 yrs
- 1.0%
Air-quality risk 3/10 · Minor
- Unhealthy air days now
- 2 days/yr
- Unhealthy air days in 30 yrs
- 4 days/yr
Risk factors via First Street. Map © Google.
Why this score? — see what drove the B+ grade
The composite is a weighted blend of 9 inputs, each scored 0–100. Each bar is that input's sub-score; the figure is the points it added to the 100-point composite (weight × sub-score).
- Cash flow +30.0/30.0
- ARV discount +15.0/15.0
- 1% rule +10.0/10.0
- DSCR +10.0/10.0
- Livability +3.8/5.0
- Rent growth +2.5/5.0
- Condition / age +2.5/5.0
- Schools +1.7/10.0
- Appreciation +0.0/10.0
$85,500
🖨 Deal sheet 📄 Offer letter ✓ Due diligence
Listing remarks
Discover a timeless single-family residence at 117 Bonita St, built in 1958. This property offers a unique opportunity to embrace a lifestyle of comfort and convenience in a charming setting. This inviting home provides a canvas for creating your ideal living space. Explore the possibilities and envision your future in this spacious Wood River home in Roxana school district. Property is being sold AS-IS, seller will not provide for inspections including occupancy. Buyer to verify all MLS data but not limited square footage, schools, taxes, exemptions, and features.
Key facts
- 0.5 acre lot
- 2 garage spots
- Built 1958
Property features AI
Exterior
- Parking: Detached/attached garage (faces front) with gravel approach; 2-car garage (approximately 20 x 20)
- Utilities: Public water; Public sewer; Electric service by Ameren; Cable available; Electricity available; Natural gas available
- Home design: Single-family residence; One level; Private ownership; Property marked as fixer
- Construction: Vinyl siding; Shallow crawl space foundation; House structure; Built year and source listed in public records
- Exterior features: Patio; Shed(s); Back yard and front yard; Irregular lot shape; Asphalt road frontage on a city street; French doors; Storm doors
Interior
- Kitchen: Free-standing gas range; Refrigerator
- Bedrooms: Three bedrooms — all on the main level (sizes approx. 13.5 x 13.5; 13.75 x 13.5; 11.75 x 11.5)
- Flooring: Carpet; Vinyl
- Bathrooms: One full bathroom on the main level (approx. 9.25 x 8.25)
- Heating & cooling: Forced air heating (natural gas); Multiple cooling units
- Interior features: Free-standing gas range; Refrigerator; Carpet flooring; Vinyl flooring; Crawl space basement
- Laundry & utility: Crawl space (utility access)
Neighborhood map
What this means for you Summary
Snapshot
- This is a 3-bed/1.0-bath single-family listed at $86k.
Deal economics
- At list price, monthly cash flow is $476 ($6k/yr) — positive.
- The deal already cash-flows at list — no discount required.
- Meets the 1% rule at list price ($1k rent vs $86k).
- Recommended offer: $83k (3.0% below list) — sets the bar for market timing.
- Cap rate 13.9% vs local median 5.9% in Wood River — top-decile yield for the area; either an underpriced asset or a hidden risk that comps aren't pricing in. Stress-test before assuming the spread holds.
Location & tenants
- Location reads 75/100 on livability (#214 in IL, #4,027 nationally) — a middle-class / working-renter tenant base. Strengths: cost of living A+, housing A+, health & safety B; Watch: amenities C-, commute D+, employment D+.
- Roxana CUSD 1 (suburban): math 18% / reading 19% proficiency, ranked #440 of 620 in IL (top 71%) — low school quality limits family demand, transient renter base, plan for 1-2y turnover.
- Zoned schools: Roxana Sr High School (math 12% / reading 12%, grade F, #511 of 693 statewide, top 75%, 515 students, 0% FRL) — zoned schools average 0% FRL vs 51% district-wide (51 pts lower); this property's tenant base skews higher-income than the district average.
- Market conditions: 33 active listings in the ZIP; 1 comparable units currently listed for rent nearby; 336 units permitted in Madison County in 2024 (0 in 5+ unit buildings).
Forward outlook
- Local home prices are declining (-3.0%/yr); year-one equity from $591 of loan paydown is wiped out by about $3k of value loss. Plan a longer hold.
- Madison County population projected at -18% by 2050 — secular population decline; favor cash flow + early exit over multi-decade hold.
- At projected returns (-3.0% appreciation + 3.0% rent growth), your $24k cash investment doubles in ~6 years — after that, you're playing with house money.
Negotiation context
- It's been on market 41 days — a 3% lower offer ($83k) is reasonable based on typical stale-listing flexibility.
Risks & watch-outs
- Watch-outs: flood insurance adds $66/mo; built in 1958 — expect roof / HVAC / electrical / plumbing capex.
- Climate carrying-cost: major flood risk; extreme-heat days projected 7→20/yr by 2055 (HVAC capex compounding) — expect insurance premiums to compound above CPI over the hold.
Questions for the listing agent
- It's been on market 41 days. Have you received any prior offers? Is the seller open to a 3% concession, seller financing, or rate buy-down credit?
- Built in 1958 — when were the roof, HVAC, electrical panel, plumbing, and water heater last replaced?
- What's the actual annual flood-insurance premium (NFIP or private), and is the property in a SFHA with mandatory coverage?
- Is there a deadline driving the sale (1031 exchange, divorce, estate, relocation)? That informs how much negotiation room exists.
- Schools are F-rated, which usually means shorter tenancies and higher turnover. Who's the typical renter profile here, and what's been the actual vacancy rate?
- What's the average days-on-market for RENTAL listings here right now (not sales)? A rising rental-DOM trend means longer vacancies and softer asking-rent achievability than the comps imply.
- What's the recent tenant-quality profile in this submarket — average credit score on applications, eviction rate, late-payment / NSF rate, and stable-employment percentage? A property-management company in the area should have these aggregated.
- How much new for-sale + rental construction is in the pipeline within 1–3 miles? Heavy new supply typically softens prices + rents 12–24 months out; constrained supply supports both.
Investment metrics
- 1% rule
- 1.73% ✓
- Cap rate
- 13.91%
- Cash-on-cash
- 27.20%
- DSCR
- 2.21
- GRM
- 4.8
CMA / ARV
- ARV (median comp)
- $148,740
- List price
- $85,500
- Delta
- -42.52%
- Verdict
- UNDERPRICED
- Comps
- 20 within 1.0 mi
Show comp detail 12 sales within ~0.75 mi
| Address | Dist | Beds/Ba | Sqft | Sold | Price | $/sf | Match |
|---|---|---|---|---|---|---|---|
| 1808 Harrison Ave | 0.28mi | 3/1.5 | 1,690 (-4%) | 9mo | $135,000 | $80 | 71 |
| 1710 Harrison Ave | 0.29mi | 3/2.0 | 1,800 (+2%) | 12mo | $199,900 | $111 | 68 |
| 109 N 13th St | 0.33mi | 3/1.5 | 1,596 (-9%) | 11mo | $135,000 | $85 | 59 |
| 340 10th St | 0.67mi | 3/1.0 | 1,684 (-4%) | 4mo | $150,000 | $89 | 59 |
| 1206 Lewis Ave | 0.44mi | 2/1.5 (-1) | 1,580 (-10%) | 8mo | $155,000 | $98 | 49 |
| 750 E Ferguson Ave | 0.71mi | 3/2.0 | 1,691 (-4%) | 9mo | $199,900 | $118 | 49 |
| 237 S 9th St | 0.63mi | 4/2.0 (+1) | 1,808 (+3%) | 12mo | $179,900 | $100 | 47 |
| 616 12th St | 0.73mi | 3/1.5 | 1,876 (+7%) | 10mo | $169,900 | $91 | 45 |
| 810 Halloran Ave | 0.74mi | 2/1.0 (-1) | 1,524 (-13%) | 2mo | $93,000 | $61 | 37 |
| 835 Lewis Ave | 0.69mi | 4/2.0 (+1) | 1,890 (+8%) | 13mo | $50,000 | $26 | 35 |
| 1006 Esther Ave | 0.61mi | 2/2.0 (-1) | 1,505 (-14%) | 5mo | $77,000 | $51 | 34 |
| 204 S Central Ave | 0.52mi | 2/2.0 (-1) | 1,504 (-14%) | 11mo | $145,000 | $96 | 33 |
Match score weights: distance 35% · size 25% · config 20% · recency 20%. Top-matched comps best support the ARV.
Projected returns pro-forma
-3.0% appreciation · 3.0% rent growth · sell at horizon
- IRR
- 17.1%
- Equity multiple
- 1.69×
- Total profit
- $16,563
- Equity at exit
- $12,748
- IRR
- 25.7%
- Equity multiple
- 3.25×
- Total profit
- $53,822
- Equity at exit
- $7,392
Cash invested: $23,940 (down + closing). Projections, not guarantees.
Landlord ↔ Tenant lean methodology
- Overall (STATE)
- 43 Moderately Tenant-Leaning
- State Illinois
- 43 Moderately Tenant-Leaning · D+7
- County
- — inherits STATE
- City
- — inherits STATE
ZIP-level market 62095
- Home prices YoY
- -22.9%
- Active inventory
- 33
- Price-to-rent
- 4.8×
Monthly cashflow live
- Estimated rent
- $1,477 medium interval (Pro) →
- Mortgage (P&I)
- −$448
- Tax from tax record
- −$140 /mo · $1,681/yr
- Insurance
- −$36
- Flood insurance flood zone
- −$66 /mo · $798/yr
- HOA
- −$0
- Vacancy / Maint / Mgmt
- −$310
- Net cashflow
- $476
Break-even live
UW: 25.0% down · 7.5% · 30yr · 1.5% tax · 5.0% vac · 8.0% maint · 8.0% mgmt
Financing live
Cash to close
- Down payment
- $21,375
- Closing costs
- $2,565
- Reserves months
- —
- Total cash needed
- —
Loan-product check · same deal, 3 products live
Conventional
25% down · 7.5% · 30yr
- Down + closing
- —
- Monthly P&I
- —
- Monthly cashflow
- —
- DSCR
- —
- Eligible?
- —
Personal DTI + credit; lowest rate.
DSCR
20% down · 8.5% · 30yr
- Down + closing
- —
- Monthly P&I
- —
- Monthly cashflow
- —
- DSCR
- —
- Eligible?
- —
No personal income docs; deal must DSCR.
Hard money
10% down · 12.0% · 12mo
- Down + closing
- —
- Monthly P&I
- —
- Monthly cashflow
- —
- DSCR
- —
- Eligible?
- —
Short-term bridge; refi at stabilization.
Rent comps 1 comps
| Address | Beds | Baths | Sqft | Rent | $/sqft | DOM | Units | Dist |
|---|---|---|---|---|---|---|---|---|
| 135 E Acton Ave Wood River, IL | 4.0 | 2.0 | 1560 | $1,750 | $1.12 | 43d | 1 | 1.29mi |
Listing history 10 events
-
2026-06-13statusdays on market $85,500 Pending 41 DOM
-
2026-06-09days on market $85,500 Active 38 DOM
-
2026-06-08days on market $85,500 Active 37 DOM
-
2026-06-07days on market $85,500 Active 36 DOM
-
2026-06-05days on market $85,500 Active 33 DOM
-
2026-06-03days on market $85,500 Active 32 DOM
-
2026-06-02days on market $85,500 Active 31 DOM
-
2026-06-01days on market $85,500 Active 30 DOM
-
2026-05-31days on market $85,500 Active 29 DOM
-
2026-05-02$85,500 Active 571-char remark
ⓘ Source: listings_history table (triggers on properties + properties_extension) + one-shot
backfill from property_details.listing_events for pre-trigger history.
Tax reassessment forecast IL · Partial reset (capped growth)
- Current annual tax
- $1,681 · $140/mo
- Projected year-2 tax
- $1,811 · $151/mo
- Expected delta
- +$130/yr (+$11/mo · 7.7%)
ⓘ Screening estimate from a state-policy table — verify with the county assessor before closing.
Climate risk First Street
- Flood 7/10 Severe FEMA zone X · 76% chance over 30 yrs
- Wildfire 1/10 Low
- Heat 5/10 Major 7 d/yr ≥107°F today · 20 d/yr by 30 yrs out
- Wind 2/10 Low 100% chance of damaging wind over 30 yrs
- Air quality 3/10 Moderate 2 unhealthy d/yr today · 4 by 30 yrs out
Nearby sold comps map
Loading sold comps map…
Walkable amenities ~0.75 mi
Loading nearby amenities…
Taxation est. · year 1
- Rental income
- $17,724
- − Mortgage interest
- −$4,789
- − Property taxes
- −$1,681
- − Insurance
- −$1,225
- − Repairs & maintenance
- −$1,418
- − Management
- −$1,418
- − Depreciation
- −$2,487
- Taxable income
- $4,705
- Est. tax owed @ 24.0%
- −$1,129
- After-tax cash flow
- $4,586/yr
For passive investors: Depreciation is non-cash, so a rental often shows a tax loss while cash-flowing — sheltering income. Rental losses are passive: they offset passive income freely, and up to $25,000/yr can offset ordinary (W-2) income if you actively participate and your MAGI is under $100k (phasing out to $0 by $150k); unused losses carry forward. On sale, claimed depreciation is recaptured at up to 25%, and gains may owe capital-gains tax (a 1031 exchange can defer both). Figures are a year-1 estimate at your 24.0% rate — not tax advice; consult a CPA.
Schools (NCES district)
- District
- Roxana CUSD 1
- NCES district ID
- 1735010
- Math proficiency
- 18% ▼ -8.00%
- Reading proficiency
- 19% ▼ -11.00%
- Median HH income
- $50,661
- Composite
- 16.73/100
- National rank
- #9164
- State rank
- #440 of 620 in IL
Livability — Wood River
- Score
- 75/100
- State rank
- #214
- US rank
- #4027
Category grades
Schools grade is shown separately in the Schools card above.
Census & demographics
- Census place
- Wood River, IL
- County
- Madison County · 189,064 people
- City population
- 10,726
- Metro
- St. Louis, MO-IL
- Population (ZIP)
- 10,726
- Household income
- $65,013
- Rent vs Own
- Severe rent burden
- 383.0
Population outlook (Madison County) Hauer SSP2
- Today (2025)
- 258,371 people
- By 2030
- 251,523 · -2.7%
- By 2040
- 233,640 · -9.6%
- By 2050
- 213,042 · -17.5%
- By 2075
- 165,255 · -36.0%
- By 2100
- 123,953 · -52.0%
Race, ethnicity, and origin ACS 2023
- Neighborhood character
- Predominantly White (87%)
- Race & ethnicity
- White 87% Black 6% Two or more races 6% Hispanic / Latino 3%
- Common ancestry
- Lithuanian 2% Romanian 2% Iranian 1%
- Foreign-born
- 2% · Canada
- Languages at home
- 97% English-only · Spanish 2%
Political lean MEDSL · Madison
- 2024 margin
- R (+13.3) · D 42.5% · R 55.8% · Other 1.8%
- 2008→2024 swing
- -22.5pp toward R · 2008: 9.2pp · 2024: -13.3pp
- All cycles
- 2024: R+13.3 2020: R+13.2 2016: R+15.6 2012: R+1.4 2008: D+9.2
Not yet ingested
- Civics
- —
Market trends
- HPI YoY
- ▼ -64.69%
- Current HPI
- 217.1264
- Rent YoY
- —
- Metro
- St. Louis, MO-IL
- State GDP YoY
- ▲ 1.59%
- F500 in state
- 60
Industry mix (Fortune 500 HQ in IL)
| Industry | F500 HQs | Revenue |
|---|---|---|
| Insurance | 4 | $201B |
|
||
| Consumer Goods | 4 | $87B |
|
||
| Industrial Machinery | 3 | $64B |
|
||
| Healthcare | 2 | $55B |
|
||
| Retail / Pharmacy | 1 | $148B |
|
||
| Agriculture / Food | 1 | $86B |
|
||
Price history
2 events — show timeline
- 2026-06-12 Pending — MARIS as Distributed by MLS Grid
- 2026-05-02 Listed $85,500 MARIS as Distributed by MLS Grid
Property tax history
+0.3%/yrLatest (2024): $1,681 · +8.5% YoY. Source: county tax records.
Cash-flow waterfall
monthlySold comps — $/sqft
last 12 mo · ≤1 miLoading sold comps…