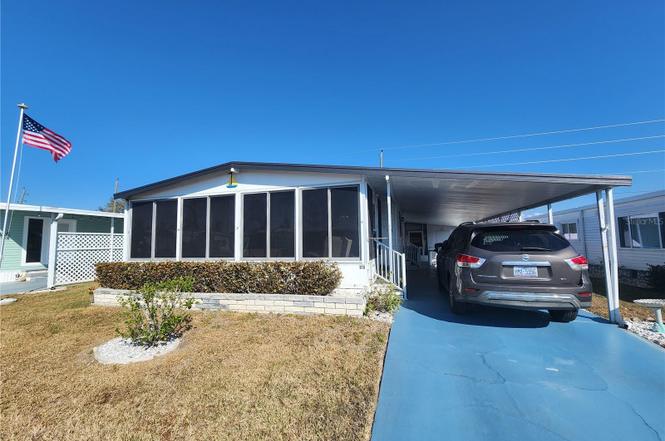
808 53rd Ave E #19 · Bayshore Gardens, FL
Flood risk 1/10 · Minimal
- FEMA flood zone
- X (unshaded)
- Chance of flooding over 30 yrs
- 0.0%
- Est. flood insurance / yr
- $507 – $1,088
Fire risk 1/10 · Minimal
- Est. fire insurance / yr
- $947 – $1,759
Heat risk 10/10 · Severe
- Hot days now (above 107°F)
- 7 days/yr
- Hot days in 30 yrs
- 28 days/yr
Wind risk 10/10 · Severe
- Chance of severe wind over 30 yrs
- 99.0%
Air-quality risk 2/10 · Minimal
- Unhealthy air days now
- 1 days/yr
- Unhealthy air days in 30 yrs
- 2 days/yr
Risk factors via First Street. Map © Google.
Why this score? — see what drove the D grade
The composite is a weighted blend of 9 inputs, each scored 0–100. Each bar is that input's sub-score; the figure is the points it added to the 100-point composite (weight × sub-score).
- Cash flow +17.8/30.0
- 1% rule +6.3/10.0
- DSCR +5.6/10.0
- Schools +4.4/10.0
- Livability +4.1/5.0
- Condition / age +2.5/5.0
- Rent growth +2.3/5.0
- ARV discount +1.4/15.0
- Appreciation +0.0/10.0
$157,000
🖨 Deal sheet 📄 Offer letter ✓ Due diligence
Listing remarks
Welcome to Palm Lake Estates, FULLY FURNISHED, MOVE IN READY!! AFFORDABLE LIVING!! NO LOT RENT!! LOW MAINTENANCE FEE!! A well-maintained and active 55+ community offering comfort, convenience, and affordability with NO LOT RENT! COMMUNITY POOL. This furnished two-bedroom, two-bath home is truly move-in ready—just bring your suitcase. This unit is in the PET area. Enjoy relaxing year-round in the glass and screen-enclosed Florida room, complete with A/C and a cozy fireplace for added comfort. The subfloors have been replaced with plywood and upgraded with beautiful luxury vinyl flooring throughout. The kitchen offers the convenience of a stack washer and dryer, which is new, along
Key facts
- Florida room
- New refrigerator
- Newer windows
Tags
Property features AI
Finance
- Other: Lease restrictions apply; Property type: Residential; Property subtype: Mobile Home; Lot size approx. 0.1 acre (0 to less than 1/4 acre); Road surface: Asphalt
- Financial info: Monthly association/condo fee $275 (includes cable TV, pool, internet, management, private road, sewer, trash, water); Total annual fees $3,300
- HOA & community: Association: Frankie/Judi (association approval required); Association amenities include cable TV, clubhouse, shuffleboard court; Community features: clubhouse, community mailbox, deed restrictions; Senior community
Exterior
- Parking: Carport with 2 spaces
- Utilities: Public water; Public sewer; Cable available
- Home design: Residential mobile home (double wide); Single-story; Faces west; Entry level: One
- Construction: Vinyl siding; Roof over; Crawlspace foundation; Estimated living area 1,352 sq ft; Building area 2,068 sq ft
- Exterior features: Other exterior features; Asphalt road access
Interior
- Kitchen: Dishwasher; Range; Microwave; Refrigerator; Electric water heater
- Bedrooms: 2 bedrooms
- Bathrooms: 2 full bathrooms
- Heating & cooling: Central heating (electric); Central air conditioning
- Interior features: Ceiling fans; Open floor plan; Walk-in closets; Electric fireplace
- Laundry & utility: Washer and dryer in kitchen area
Neighborhood map
What this means for you Summary
Snapshot
- This is a 2-bed/1.0-bath manufactured listed at $157k.
Deal economics
- At list price, monthly cash flow is $130 ($2k/yr) — positive.
- The deal already cash-flows at list — no discount required.
- Meets the 1% rule at list price ($2k rent vs $157k).
- Recommended offer: $138k (12.0% below list) — sets the bar for market timing.
- Cap rate 7.3% vs local median 4.7% in Bayshore Gardens — top-decile yield for the area; either an underpriced asset or a hidden risk that comps aren't pricing in. Stress-test before assuming the spread holds.
Location & tenants
- Location reads 82/100 on livability (#72 in FL, #1,180 nationally) — a professional / high-income tenant draw. Strengths: cost of living A+, housing A+, health & safety A+; Watch: crime C-, commute C-, schools F.
- Manatee (suburban): math 54% / reading 50% proficiency, ranked #26 of 73 in FL (top 36%) — acceptable for families but not a draw, mixed tenant base, ~2y average lease.
- Market conditions: Rents soft (-1.0%/yr); 384 active listings in the ZIP; 40 comparable units currently listed for rent nearby; rentals at typical pace (median 16d on market — plan ~3-4 weeks tenant-placement turnaround); 7,472 units permitted in Manatee County in 2024 (1,782 in 5+ unit buildings).
- This rent runs 30% of the median local income ($71k/yr) — at the standard rent-burdened threshold; future hikes will face affordability resistance.
Forward outlook
- Local home prices are declining (-3.0%/yr); year-one equity from $1k of loan paydown is wiped out by about $5k of value loss. Plan a longer hold.
- Manatee County population projected at +43% by 2050 — long-run rental-demand tailwind backs the buy-and-hold thesis.
Negotiation context
- It's been on market 125 days — a 12% lower offer ($138k) is reasonable based on typical stale-listing flexibility.
- Current owner paid $50k; list at $157k implies a 214% gain — meaningful room to come down on a strong offer.
Risks & watch-outs
- Climate carrying-cost: severe wind risk, 99% chance of damaging wind over 30y; extreme-heat days projected 7→28/yr by 2055 (HVAC capex compounding) — expect insurance premiums to compound above CPI over the hold.
Questions for the listing agent
- It's been on market 125 days. Have you received any prior offers? Is the seller open to a 12% concession, seller financing, or rate buy-down credit?
- Built in 1975 — when were the roof, HVAC, electrical panel, plumbing, and water heater last replaced?
- What does the HOA fee cover, when was the last increase, and are there any pending special assessments or reserve-fund shortfalls?
- Why hasn't it sold? Are there any deal-killer items the seller is aware of (foundation, flood, title, zoning, code violations)?
- Is there a deadline driving the sale (1031 exchange, divorce, estate, relocation)? That informs how much negotiation room exists.
- Schools are F-rated, which usually means shorter tenancies and higher turnover. Who's the typical renter profile here, and what's been the actual vacancy rate?
- The area grade is low — what's the realistic commute time and amenity access for the typical tenant pool here? Any planned neighborhood developments (good or bad) we should know about?
- What's the average days-on-market for RENTAL listings here right now (not sales)? A rising rental-DOM trend means longer vacancies and softer asking-rent achievability than the comps imply.
- What's the recent tenant-quality profile in this submarket — average credit score on applications, eviction rate, late-payment / NSF rate, and stable-employment percentage? A property-management company in the area should have these aggregated.
- How much new for-sale + rental construction is in the pipeline within 1–3 miles? Heavy new supply typically softens prices + rents 12–24 months out; constrained supply supports both.
Investment metrics
- 1% rule
- 1.13% ✓
- Cap rate
- 7.28%
- Cash-on-cash
- 3.54%
- DSCR
- 1.16
- GRM
- 7.4
CMA / ARV
- ARV (on-the-fly)
- $138,240
- Comps found
- 12
Show comp detail 12 sales within ~0.75 mi
| Address | Dist | Beds/Ba | Sqft | Sold | Price | $/sf | Match |
|---|---|---|---|---|---|---|---|
| 808 53rd Ave E #108 | 0.16mi | 2/2.0 | 1,152 (0%) | 4mo | $135,000 | $117 | 85 |
| 808 53rd Ave E #75 | 0.08mi | 2/2.0 | 1,266 (+10%) | 2mo | $149,000 | $118 | 74 |
| 808 53rd Ave E #66 | 0.05mi | 2/2.0 | 1,056 (-8%) | 7mo | $85,000 | $80 | 74 |
| 209 E 52nd Avenue Plz E | 0.46mi | 2/2.0 | 1,152 (0%) | 1mo | $165,500 | $144 | 74 |
| 808 53rd Ave E #277 | 0.16mi | 2/2.0 | 1,056 (-8%) | 2mo | $188,000 | $178 | 73 |
| 205 52nd Avenue Ter E | 0.44mi | 2/2.0 | 1,124 (-2%) | 1mo | $180,000 | $160 | 70 |
| 305 52nd Avenue Plz E | 0.44mi | 2/2.0 | 1,153 (+0%) | 9mo | $200,000 | $173 | 68 |
| 808 53rd Ave E #273 | 0.12mi | 2/2.0 | 1,288 (+12%) | 4mo | $154,000 | $120 | 67 |
| 204 52nd Avenue Ter E | 0.44mi | 2/2.0 | 1,200 (+4%) | 6mo | $115,000 | $96 | 64 |
| 808 53rd Ave E Unit 184J | 0.14mi | 2/2.0 | 1,324 (+15%) | 3mo | $110,000 | $83 | 62 |
| 4908 6th B St E | 0.66mi | 2/2.0 | 1,261 (+10%) | 0mo | $130,000 | $103 | 49 |
| 212 52nd Avenue Plz W | 0.65mi | 2/2.0 | 1,228 (+7%) | 8mo | $180,000 | $147 | 48 |
Match score weights: distance 35% · size 25% · config 20% · recency 20%. Top-matched comps best support the ARV.
Projected returns pro-forma
-3.0% appreciation · 0.0% rent growth · sell at horizon
- IRR
- -14.6%
- Equity multiple
- 0.49×
- Total profit
- $-22,247
- Equity at exit
- $23,409
- IRR
- -13.0%
- Equity multiple
- 0.36×
- Total profit
- $-28,286
- Equity at exit
- $13,574
Cash invested: $43,960 (down + closing). Projections, not guarantees.
Landlord ↔ Tenant lean methodology
- Overall (STATE)
- 87 Strongly Landlord-Friendly
- State Florida
- 87 Strongly Landlord-Friendly · R+3
- County
- — inherits STATE
- City
- — inherits STATE
ZIP-level market 34203
- Home prices YoY
- -24.5%
- Rents YoY
- -1.0%
- Active inventory
- 384
- Price-to-rent
- 7.4×
Monthly cashflow live
- Estimated rent
- $1,777 high interval (Pro) →
- Mortgage (P&I)
- −$823
- Tax from tax record
- −$111 /mo · $1,329/yr
- Insurance
- −$65
- HOA
- −$275
- Vacancy / Maint / Mgmt
- −$373
- Net cashflow
- $130
Break-even live
UW: 25.0% down · 7.5% · 30yr · 1.5% tax · 5.0% vac · 8.0% maint · 8.0% mgmt
Financing live
Cash to close
- Down payment
- $39,250
- Closing costs
- $4,710
- Reserves months
- —
- Total cash needed
- —
Loan-product check · same deal, 3 products live
Conventional
25% down · 7.5% · 30yr
- Down + closing
- —
- Monthly P&I
- —
- Monthly cashflow
- —
- DSCR
- —
- Eligible?
- —
Personal DTI + credit; lowest rate.
DSCR
20% down · 8.5% · 30yr
- Down + closing
- —
- Monthly P&I
- —
- Monthly cashflow
- —
- DSCR
- —
- Eligible?
- —
No personal income docs; deal must DSCR.
Hard money
10% down · 12.0% · 12mo
- Down + closing
- —
- Monthly P&I
- —
- Monthly cashflow
- —
- DSCR
- —
- Eligible?
- —
Short-term bridge; refi at stabilization.
Rent comps 40 comps
| Address | Beds | Baths | Sqft | Rent | $/sqft | DOM | Units | Dist |
|---|---|---|---|---|---|---|---|---|
| 5323 11th Street Cir E Bradenton, FL | 2.0 | 2.0 | 1303 | $1,900 | $1.46 | 23d | 1 | 0.20mi |
| 5613 8th St Ct E Bradenton, FL | 3.0 | 2.0 | 1000 | $1,700 | $1.70 | 23d | 1 | 0.26mi |
| 716 56th Avenue Dr E Bradenton, FL | 3.0 | 2.0 | 1000 | $1,700 | $1.70 | 3d | 1 | 0.32mi |
| 808 53rd Ave E #203 Bradenton, FL | 2.0 | 2.0 | 1208 | $1,450 | $1.20 | 16d | 1 | 0.44mi |
| 409 57th Avenue Dr E Bradenton, FL | 2.0 | 1.5 | 1209 | $1,375 | $1.14 | 10d | 1 | 0.45mi |
| 408 57th Avenue Dr E Unit A Bradenton, FL | 2.0 | 1.5 | 1209 | $1,350 | $1.12 | 10d | 1 | 0.49mi |
| 408 57th Avenue Dr E Apt E Bradenton, FL | 2.0 | 1.5 | 1209 | $1,375 | $1.14 | 11d | 1 | 0.49mi |
| 312 57th Avenue Dr E Unit B Bradenton, FL | 2.0 | 1.5 | 1209 | $1,350 | $1.12 | 3d | 1 | 0.51mi |
| 308 57th Avenue Dr E Unit B Bradenton, FL | 2.0 | 1.5 | 1209 | $1,350 | $1.12 | 3d | 1 | 0.53mi |
| 304 57th Avenue Dr E Bradenton, FL | 2.0 | 1.5 | 1209 | $1,445 | $1.20 | 23d | 3 | 0.53mi |
| 304 57th Avenue Dr E Bradenton, FL | 2.0 | 1.5 | 1209 | $1,362 | $1.13 | 3d | 5 | 0.53mi |
| 5719 14th St E Bradenton, FL | 1.0 | 1.0 | 978 | $1,425 | $1.46 | 3d | 1 | 0.58mi |
| 5828 3rd St E Bradenton, FL | 3.0 | 2.0 | 1036 | $1,995 | $1.93 | 23d | 1 | 0.61mi |
| 1109 59th Avenue Cir E Unit 1109 Bradenton, FL | 3.0 | 2.0 | 945 | $1,795 | $1.90 | 23d | 1 | 0.69mi |
| 5580 Fountain Lake Cir Bradenton, FL | 1.0–3.0 | 1.0–2.0 | 1052 | $1,908 | $1.81 | 2d | 38 | 0.88mi |
| 503 51st Ave W Unit 503 Bradenton, FL | 3.0 | 2.0 | 882 | $1,275 | $1.45 | 23d | 1 | 0.89mi |
| 503 51st Ave W Bradenton, FL | 3.0 | 2.0 | 882 | $1,075 | $1.22 | 11d | 1 | 0.89mi |
| 1022 61st Avenue Dr E Bradenton, FL | 3.0 | 1.0 | 970 | $1,450 | $1.49 | 16d | 1 | 0.91mi |
| 613 61st Avenue Ter E Unit 613 Bradenton, FL | 3.0 | 2.0 | 1194 | $2,195 | $1.84 | 16d | 1 | 0.91mi |
| 1345 301 Blvd E Bradenton, FL | 1.0–3.0 | 1.0–2.0 | 872 | $1,320 | $1.51 | 23d | 9 | 0.91mi |
| 5502 8th Street Ct W Bradenton, FL | 2.0 | 2.0 | 896 | $1,595 | $1.78 | 23d | 1 | 0.94mi |
| 608 51st Ave W Bradenton, FL | 2.0 | 1.5 | 760 | $2,200 | $2.89 | 23d | 1 | 0.95mi |
| 1207 62nd Ave E Bradenton, FL | 3.0 | 2.0 | 1018 | $1,995 | $1.96 | 23d | 1 | 1.01mi |
| 6205 12th Street Ct E Bradenton, FL | 3.0 | 2.0 | 1018 | $1,895 | $1.86 | 23d | 1 | 1.04mi |
| 4810 Ho Wil Ln Unit 4810 Bradenton, FL | 2.0 | 1.0 | 784 | $1,600 | $2.04 | 23d | 1 | 1.07mi |
| 707 50th Ave W Bradenton, FL | 2.0 | 1.0 | 730 | $1,150 | $1.58 | 23d | 1 | 1.07mi |
| 202 46th Avenue Ter W #409 Bradenton, FL | 2.0 | 2.0 | 1086 | $1,995 | $1.84 | 23d | 1 | 1.08mi |
| 3 Date Ave Bradenton, FL | 2.0 | 2.0 | 1000 | $1,495 | $1.50 | 23d | 1 | 1.08mi |
| 203 46th Avenue Ter W Bradenton, FL | 1.0 | 1.0 | 880 | $1,099 | $1.25 | 3d | 1 | 1.09mi |
| 304 47th Avenue Dr W #112 Bradenton, FL | 1.0 | 1.0 | 725 | $1,200 | $1.66 | 23d | 1 | 1.10mi |
| 512 60th Avenue Ter W Unit 512 Bradenton, FL | 3.0 | 1.5 | 972 | $1,900 | $1.95 | 10d | 1 | 1.11mi |
| 1007 57th Ave W Bradenton, FL | 2.0 | 1.5 | 967 | $1,495 | $1.55 | 10d | 1 | 1.12mi |
| 915 50th Avenue Plz W Bradenton, FL | 2.0 | 1.0 | 700 | $1,200 | $1.71 | 23d | 1 | 1.17mi |
| 4630 5th St W Ste 6 Bradenton, FL | 2.0 | 1.0 | 1000 | $1,600 | $1.60 | 11d | 1 | 1.17mi |
| 655 Park Cir Bradenton, FL | 1.0 | 1.5 | 816 | $1,100 | $1.35 | 23d | 1 | 1.20mi |
| 723 44th Ave E Unit 5 Bradenton, FL | 2.0 | 1.5 | 1350 | $1,650 | $1.22 | 16d | 1 | 1.22mi |
| 2129 49th Ave E Bradenton, FL | 3.0 | 2.0 | 1370 | $2,245 | $1.64 | 3d | 1 | 1.31mi |
| 1167 42nd Ter E Bradenton, FL | 3.0 | 2.0 | 1274 | $2,025 | $1.59 | 19d | 1 | 1.35mi |
| 5531 16th St W Unit 5537 Bradenton, FL | 2.0 | 1.0 | 750 | $1,650 | $2.20 | 3d | 1 | 1.43mi |
| 605 64th Ave W Bradenton, FL | 2.0 | 1.0 | 784 | $1,250 | $1.59 | 11d | 1 | 1.44mi |
HOA detail
- Monthly dues
- $275 · $3,300/yr
- Likely covers
- pool
Listing history 18 events
-
2026-06-18days on market $157,000 Active 125 DOM
-
2026-06-17days on market $157,000 Active 124 DOM
-
2026-06-16days on market $157,000 Active 123 DOM
-
2026-06-15days on market $157,000 Active 122 DOM
-
2026-06-13days on market $157,000 Active 120 DOM
-
2026-06-13days on market $157,000 Active 119 DOM
-
2026-06-10days on market $157,000 Active 117 DOM
-
2026-06-09days on market $157,000 Active 116 DOM
-
2026-06-08days on market $157,000 Active 115 DOM
-
2026-06-08days on market $157,000 Active 114 DOM
-
2026-06-03days on market $157,000 Active 110 DOM
-
2026-06-02days on market $157,000 Active 109 DOM
-
2026-06-01days on market $157,000 Active 108 DOM
-
2026-05-31days on market $157,000 Active 107 DOM
-
2026-02-13$157,000 Active
-
1999-11-18soldstatus $50,000
-
1994-05-20soldstatus $50,000
-
1989-10-25soldstatus $50,000
ⓘ Source: listings_history table (triggers on properties + properties_extension) + one-shot
backfill from property_details.listing_events for pre-trigger history.
Tax reassessment forecast FL · Resets to sale price
- Current annual tax
- $1,329 · $111/mo
- Projected year-2 tax
- $1,329 · $111/mo
- Expected delta
- $0/yr ($0/mo · 0.0%)
ⓘ Screening estimate from a state-policy table — verify with the county assessor before closing.
Climate risk First Street
- Flood 1/10 Low FEMA zone X (unshaded) · 0% chance over 30 yrs
- Wildfire 1/10 Low
- Heat 10/10 Extreme 7 d/yr ≥107°F today · 28 d/yr by 30 yrs out
- Wind 10/10 Extreme 99% chance of damaging wind over 30 yrs
- Air quality 2/10 Low 1 unhealthy d/yr today · 2 by 30 yrs out
Nearby sold comps map
Loading sold comps map…
Walkable amenities ~0.75 mi
Loading nearby amenities…
Taxation est. · year 1
- Rental income
- $21,329
- − Mortgage interest
- −$8,794
- − Property taxes
- −$1,329
- − Insurance
- −$785
- − Repairs & maintenance
- −$1,706
- − Management
- −$1,706
- − HOA
- −$3,300
- − Depreciation
- −$4,567
- Taxable loss
- −$859
- Est. tax savings @ 24.0%
- +$206
- After-tax cash flow
- $1,762/yr
For passive investors: Depreciation is non-cash, so a rental often shows a tax loss while cash-flowing — sheltering income. Rental losses are passive: they offset passive income freely, and up to $25,000/yr can offset ordinary (W-2) income if you actively participate and your MAGI is under $100k (phasing out to $0 by $150k); unused losses carry forward. On sale, claimed depreciation is recaptured at up to 25%, and gains may owe capital-gains tax (a 1031 exchange can defer both). Figures are a year-1 estimate at your 24.0% rate — not tax advice; consult a CPA.
Schools (NCES district)
- District
- Manatee
- NCES district ID
- 1201230
- Math proficiency
- 54% ▼ -6.00%
- Reading proficiency
- 50% ▼ -2.00%
- Median HH income
- $49,607
- Composite
- 44.43/100
- National rank
- #2806
- State rank
- #26 of 73 in FL
Livability — Bayshore Gardens
- Score
- 82/100
- State rank
- #72
- US rank
- #1180
Category grades
Schools grade is shown separately in the Schools card above.
Census & demographics
- County
- Manatee County · 416,364 people
- City population
- 33,840
- Metro
- North Port-Sarasota-Bradenton, FL
- Population (ZIP)
- 40,618
- Household income
- $70,761
- Rent vs Own
- Severe rent burden
- 1469.0
Population outlook (Manatee County) Hauer SSP2
- Today (2025)
- 447,342 people
- By 2030
- 488,911 · +9.3%
- By 2040
- 567,934 · +27.0%
- By 2050
- 637,995 · +42.6%
- By 2075
- 781,970 · +74.8%
- By 2100
- 848,272 · +89.6%
Race, ethnicity, and origin ACS 2023
- Neighborhood character
- Predominantly White (65%)
- Race & ethnicity
- White 65% Hispanic / Latino 19% Two or more races 12% Black 9% Asian 5%
- Hispanic origin (detail)
- Mexican 9% Puerto Rican 3% Cuban 2% Dominican 1%
- Common ancestry
- Lithuanian 3% Romanian 3% Slovak 2%
- Foreign-born
- 17% · Canada, Vietnam, Dominican Republic
- Languages at home
- 76% English-only · Spanish 16% Vietnamese 2% Other Indo-European 1%
Political lean MEDSL · Manatee
- 2024 margin
- Strong R (+23.5) · D 37.9% · R 61.4%
- 2008→2024 swing
- -16.5pp toward R · 2008: -7.0pp · 2024: -23.5pp
- All cycles
- 2024: R+23.5 2020: R+16.1 2016: R+17.1 2012: R+12.5 2008: R+7.0
Not yet ingested
- Civics
- —
Market trends
- HPI YoY
- ▼ -95.87%
- Current HPI
- 295.8871
- Rent YoY
- ▼ -0.97%
- Metro
- North Port-Sarasota-Bradenton, FL
- State GDP YoY
- ▲ 3.28%
- F500 in state
- 36
Industry mix (Fortune 500 HQ in FL)
| Industry | F500 HQs | Revenue |
|---|---|---|
| Industrial Technology | 2 | $29B |
|
||
| Insurance | 2 | $17B |
|
||
| Retail | 1 | $60B |
|
||
| Technology Distribution | 1 | $58B |
|
||
| Homebuilding | 1 | $35B |
|
||
| Technology Manufacturing | 1 | $35B |
|
||
Price history
+214.0% since first listed4 events — show timeline
- 2026-02-13 Listed $157,000 Stellar MLS as Distributed by MLS Grid
- 1999-11-18 Sold (Public Records) $50,000 Public Records
- 1994-05-20 Sold (Public Records) $50,000 Public Records
- 1989-10-25 Sold (Public Records) $50,000 Public Records
Property tax history
+9.7%/yrLatest (2025): $1,329 · -2.4% YoY. Source: county tax records.
Cash-flow waterfall
monthlySold comps — $/sqft
last 12 mo · ≤1 miLoading sold comps…