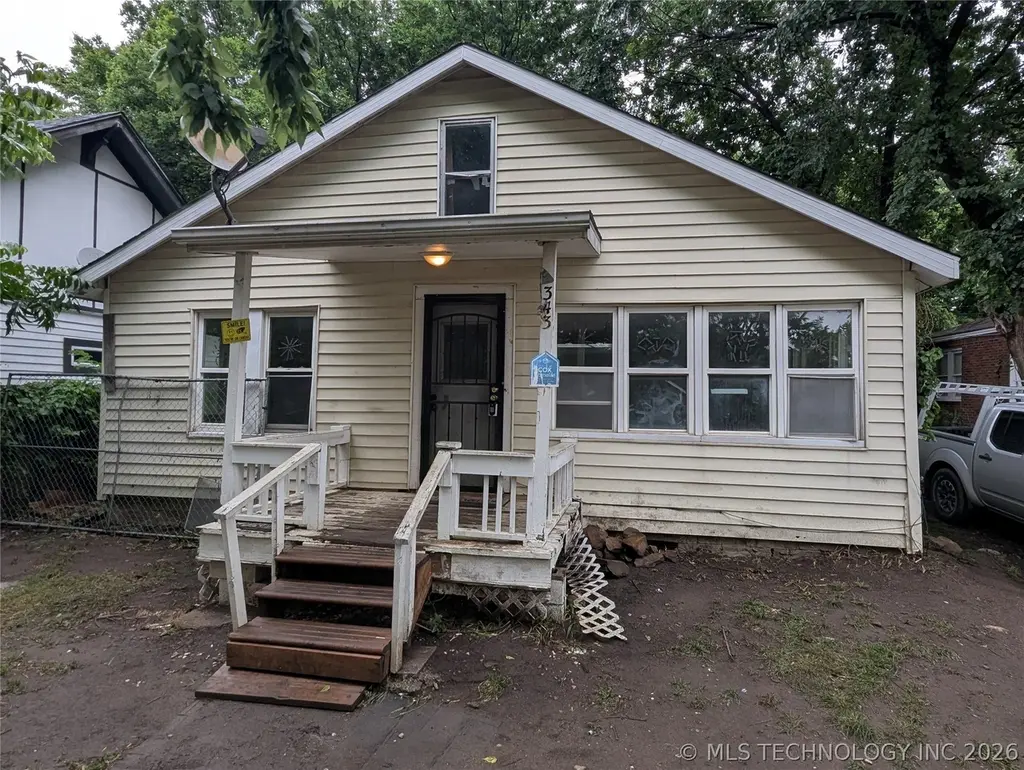
343 S Zunis Ave · Tulsa, OK
Flood risk 1/10 · Minimal
- FEMA flood zone
- X (unshaded)
- Chance of flooding over 30 yrs
- 0.0%
- Est. flood insurance / yr
- $507 – $1,088
Fire risk 1/10 · Minimal
- Est. fire insurance / yr
- $2,463 – $4,575
Heat risk 6/10 · Moderate
- Hot days now (above 110°F)
- 7 days/yr
- Hot days in 30 yrs
- 18 days/yr
Wind risk 2/10 · Minimal
- Chance of severe wind over 30 yrs
- 4.0%
Air-quality risk 2/10 · Minimal
- Unhealthy air days now
- 2 days/yr
- Unhealthy air days in 30 yrs
- 2 days/yr
Risk factors via First Street. Map © Google.
Why this score? — see what drove the B- grade
The composite is a weighted blend of 9 inputs, each scored 0–100. Each bar is that input's sub-score; the figure is the points it added to the 100-point composite (weight × sub-score).
- Cash flow +30.0/30.0
- 1% rule +10.0/10.0
- DSCR +10.0/10.0
- ARV discount +7.5/15.0
- Rent growth +4.0/5.0
- Livability +3.8/5.0
- Condition / age +2.5/5.0
- Schools +0.8/10.0
- Appreciation +0.0/10.0
$65,000
🖨 Deal sheet 📄 Offer letter ✓ Due diligence
Listing remarks MLS
HUD#422-287352 BACK ON THE MARKET Classic bungalow with large rooms, vinyl siding and nice yard in Kendall Whittier urban renewal area. Needs a little refresh and a new family. As-Is, 203K eligible
Key facts
- 6,750 sq ft lot
- Built 1915
- Listed 7 days
Property features AI
Finance
- HOA & community: Sidewalks in the community
Exterior
- Parking: Gravel driveway
- Security: No safety shelter
- Utilities: Public water; Public sewer; Electric service available
- Home design: Single-story home; Faces west; Crawlspace foundation; Vinyl siding with wood frame construction
- Construction: Built (year per public records); Vinyl siding; Wood frame construction; Asphalt/fiberglass roof; Crawlspace foundation
- Exterior features: Gravel driveway; Partial fencing; Mature trees on lot
Interior
- Kitchen: Oven; Range / Stove; Laminate counters
- Bedrooms: Master bedroom with walk-in closet (first level); Additional bedrooms without attached baths (first level)
- Flooring: Carpet; Tile; Vinyl
- Bathrooms: One full bathroom; Master bath with bathtub (first level)
- Heating & cooling: Central heating (electric); Central air conditioning
- Interior features: High-speed internet; Cable TV; Wired for data; Laminate countertops; Vinyl and wood-frame windows
- Laundry & utility: Utility room (inside, first level); Gas water heater
Neighborhood map
What this means for you Summary
Snapshot
- This is a 3-bed/1.0-bath single-family listed at $65k.
Deal economics
- At list price, monthly cash flow is $808 ($10k/yr) — positive.
- The deal already cash-flows at list — no discount required.
- Meets the 1% rule at list price ($2k rent vs $65k).
- Cap rate 21.2% vs local median 3.9% in Tulsa — top-decile yield for the area; either an underpriced asset or a hidden risk that comps aren't pricing in. Stress-test before assuming the spread holds.
Location & tenants
- Location reads 75/100 on livability (#13 in OK, #4,058 nationally) — a middle-class / working-renter tenant base. Strengths: amenities A+, commute A+, cost of living A+; Watch: schools F, crime F, employment D-.
- Tulsa (urban): math 7% / reading 12% proficiency, ranked #250 of 270 in OK (top 93%) — low school quality limits family demand, transient renter base, plan for 1-2y turnover; 76% free/reduced lunch — lower-income household profile, screen leases tightly.
- Market conditions: Rents rising fast (+5.8%/yr); 82 active listings in the ZIP; 36 comparable units currently listed for rent nearby; rentals leasing fast (median 12d on market — plan ~1-2 weeks tenant-placement turnaround); 2,818 units permitted in Tulsa County in 2024 (518 in 5+ unit buildings).
- This rent runs 35% of the median local income ($55k/yr) — at the standard rent-burdened threshold; future hikes will face affordability resistance.
Forward outlook
- Local home prices are declining (-3.0%/yr); year-one equity from $449 of loan paydown is wiped out by about $2k of value loss. Plan a longer hold.
- Tulsa County population projected at +30% by 2050 — long-run rental-demand tailwind backs the buy-and-hold thesis.
- At projected returns (-3.0% appreciation + 5.8% rent growth), your $18k cash investment doubles in ~3 years — after that, you're playing with house money.
Negotiation context
- Only 7 days on market — expect competitive offers; lowballing is unlikely to land.
- 4 sale attempts since 23y ago with the ask held roughly flat each time — persistent listings suggest the price (not the market) is what's stuck; bring a comps-based counter.
Risks & watch-outs
- Watch-outs: built in 1915 — expect roof / HVAC / electrical / plumbing capex.
- Climate carrying-cost: extreme-heat days projected 7→18/yr by 2055 (HVAC capex compounding) — expect insurance premiums to compound above CPI over the hold.
Questions for the listing agent
- Built in 1915 — when were the roof, HVAC, electrical panel, plumbing, and water heater last replaced?
- Is there a deadline driving the sale (1031 exchange, divorce, estate, relocation)? That informs how much negotiation room exists.
- Schools are F-rated, which usually means shorter tenancies and higher turnover. Who's the typical renter profile here, and what's been the actual vacancy rate?
- Crime grade is F in this area — have there been break-ins, vandalism, or insurance claims at this property in the last 3 years? What carrier currently insures it and at what premium?
- What's the average days-on-market for RENTAL listings here right now (not sales)? A rising rental-DOM trend means longer vacancies and softer asking-rent achievability than the comps imply.
- What's the recent tenant-quality profile in this submarket — average credit score on applications, eviction rate, late-payment / NSF rate, and stable-employment percentage? A property-management company in the area should have these aggregated.
- How much new for-sale + rental construction is in the pipeline within 1–3 miles? Heavy new supply typically softens prices + rents 12–24 months out; constrained supply supports both.
Investment metrics
- 1% rule
- 2.48% ✓
- Cap rate
- 21.20%
- Cash-on-cash
- 53.25%
- DSCR
- 3.37
- GRM
- 3.4
CMA / ARV
- ARV (on-the-fly)
- $180,880
- Comps found
- 12
Show comp detail 12 sales within ~0.75 mi
| Address | Dist | Beds/Ba | Sqft | Sold | Price | $/sf | Match |
|---|---|---|---|---|---|---|---|
| 519 S Yorktown Ave | 0.13mi | 2/1.0 (-1) | 1,056 (-1%) | 3mo | $185,000 | $175 | 85 |
| 407 S Xanthus Ave | 0.14mi | 3/1.5 | 975 (-8%) | 0mo | $60,000 | $62 | 77 |
| 2504 E 4th St | 0.28mi | 2/1.0 (-1) | 1,093 (+3%) | 4mo | $179,000 | $164 | 75 |
| 2516 E 3rd St | 0.32mi | 2/1.0 (-1) | 1,088 (+2%) | 3mo | $174,500 | $160 | 74 |
| 333 S Zunis Ave | 0.02mi | 3/2.0 | 1,162 (+9%) | 7mo | $120,000 | $103 | 74 |
| 2215 E 8th St | 0.35mi | 2/1.0 (-1) | 1,000 (-6%) | 2mo | $200,000 | $200 | 67 |
| 2532 E 4th St | 0.35mi | 2/2.0 (-1) | 1,088 (+2%) | 6mo | $185,000 | $170 | 66 |
| 2718 4th St | 0.56mi | 3/1.0 | 1,025 (-4%) | 4mo | $125,000 | $122 | 64 |
| 2604 E 2nd St | 0.43mi | 2/1.0 (-1) | 977 (-8%) | 0mo | $181,300 | $186 | 61 |
| 2811 E 3rd St | 0.68mi | 3/2.5 | 1,057 (-1%) | 3mo | $229,900 | $218 | 59 |
| 2735 E 1st St | 0.66mi | 2/1.0 (-1) | 988 (-7%) | 3mo | $165,000 | $167 | 50 |
| 2635 E 10th St | 0.64mi | 3/1.0 | 1,192 (+12%) | 9mo | $273,500 | $229 | 43 |
Match score weights: distance 35% · size 25% · config 20% · recency 20%. Top-matched comps best support the ARV.
Projected returns pro-forma
-3.0% appreciation · 5.8% rent growth · sell at horizon
- IRR
- 54.5%
- Equity multiple
- 3.51×
- Total profit
- $45,614
- Equity at exit
- $9,692
- IRR
- 60.7%
- Equity multiple
- 7.95×
- Total profit
- $126,403
- Equity at exit
- $5,620
Cash invested: $18,200 (down + closing). Projections, not guarantees.
Landlord ↔ Tenant lean methodology
- Overall (STATE)
- 83 Strongly Landlord-Friendly
- State Oklahoma
- 83 Strongly Landlord-Friendly · R+20
- County
- — inherits STATE
- City
- — inherits STATE
ZIP-level market 74104
- Rents YoY
- 5.8%
- Active inventory
- 82
- Price-to-rent
- 3.4×
Monthly cashflow live
- Estimated rent
- $1,613 high interval (Pro) →
- Mortgage (P&I)
- −$341
- Tax from tax record
- −$99 /mo · $1,183/yr
- Insurance
- −$27
- HOA
- −$0
- Vacancy / Maint / Mgmt
- −$339
- Net cashflow
- $808
Break-even live
UW: 25.0% down · 7.5% · 30yr · 1.5% tax · 5.0% vac · 8.0% maint · 8.0% mgmt
Financing live
Cash to close
- Down payment
- $16,250
- Closing costs
- $1,950
- Reserves months
- —
- Total cash needed
- —
Loan-product check · same deal, 3 products live
Conventional
25% down · 7.5% · 30yr
- Down + closing
- —
- Monthly P&I
- —
- Monthly cashflow
- —
- DSCR
- —
- Eligible?
- —
Personal DTI + credit; lowest rate.
DSCR
20% down · 8.5% · 30yr
- Down + closing
- —
- Monthly P&I
- —
- Monthly cashflow
- —
- DSCR
- —
- Eligible?
- —
No personal income docs; deal must DSCR.
Hard money
10% down · 12.0% · 12mo
- Down + closing
- —
- Monthly P&I
- —
- Monthly cashflow
- —
- DSCR
- —
- Eligible?
- —
Short-term bridge; refi at stabilization.
Rent comps 36 comps
| Address | Beds | Baths | Sqft | Rent | $/sqft | DOM | Units | Dist |
|---|---|---|---|---|---|---|---|---|
| 2532 E 4th St Tulsa, OK | 2.0 | 2.0 | 1088 | $800 | $0.74 | 23d | 1 | 0.36mi |
| 2509 E 7th St Tulsa, OK | 3.0 | 2.0 | 1161 | $1,815 | $1.56 | 11d | 1 | 0.42mi |
| 2219 E 11th St Tulsa, OK | 1.0–3.0 | 1.0–3.0 | 1136 | $2,787 | $2.45 | 1d | 10 | 0.46mi |
| 2435 E 10th St Tulsa, OK | 3.0 | 1.0 | 1040 | $1,650 | $1.59 | 3d | 1 | 0.48mi |
| 2529 E Admiral Pl Unit A Tulsa, OK | 2.0 | 1.0 | 1100 | $1,295 | $1.18 | 23d | 1 | 0.55mi |
| 1122 S Xanthus Pl Tulsa, OK | 2.0 | 1.0 | 1000 | $1,245 | $1.25 | 3d | 1 | 0.56mi |
| 2808 E 1st Pl Unit P21-Q Tulsa, OK | 2.0 | 1.0 | 1025 | $1,250 | $1.22 | 23d | 1 | 0.71mi |
| 2319 E 13th St Tulsa, OK | 2.0 | 1.0 | 875 | $1,400 | $1.60 | 23d | 1 | 0.73mi |
| 223 S Evanston Ave Tulsa, OK | 3.0 | 2.0 | 1220 | $1,395 | $1.14 | 23d | 1 | 0.79mi |
| 720 N Columbia Ave Tulsa, OK | 3.0 | 1.0 | 1233 | $1,150 | $0.93 | 3d | 1 | 0.87mi |
| 624 S Peoria Ave Tulsa, OK | 3.0 | 1.0–2.5 | 1521 | $3,995 | $2.63 | 1d | 10 | 0.87mi |
| 1125 S Quincy Ave Unit 1127-1 Tulsa, OK | 2.0 | 1.0 | 740 | $950 | $1.28 | 3d | 1 | 0.88mi |
| 1201 S Rockford Ave Unit 11 Tulsa, OK | 2.0 | 1.5 | 920 | $885 | $0.96 | 23d | 1 | 0.88mi |
| 1201 S Rockford Ave Unit 7 Tulsa, OK | 2.0 | 1.5 | 920 | $875 | $0.95 | 3d | 1 | 0.89mi |
| 44 S Florence Ave Tulsa, OK | 2.0 | 1.0 | 1080 | $1,450 | $1.34 | 23d | 1 | 0.92mi |
| 1140 S College Ave Unit C Tulsa, OK | 2.0 | 1.5 | 840 | $1,650 | $1.96 | 23d | 1 | 1.00mi |
| 1115 S College Ave Unit 16 Tulsa, OK | 2.0 | 1.0 | 775 | $1,275 | $1.65 | 23d | 1 | 1.00mi |
| 1005 N Quincy Ave Unit A Tulsa, OK | 3.0 | 2.0 | 1303 | $1,450 | $1.11 | 2d | 1 | 1.11mi |
| 1025 N Quincy Ave Unit A Tulsa, OK | 3.0 | 2.0 | 1303 | $1,450 | $1.11 | 23d | 1 | 1.16mi |
| 1411 S Quaker Ave Tulsa, OK | 2.0 | 1.5–2.5 | 1200 | $2,049 | $1.71 | 14d | 2 | 1.17mi |
| 1428 S Quaker Ave Tulsa, OK | 2.0 | 1.0 | 850 | $1,225 | $1.44 | 3d | 1 | 1.21mi |
| 1338 S Florence Ave Unit 1 Tulsa, OK | 2.0 | 1.0 | 1200 | $1,450 | $1.21 | 3d | 1 | 1.22mi |
| 2508 E 17th St Tulsa, OK | 2.0 | 1.0 | 1180 | $1,600 | $1.36 | 14d | 1 | 1.23mi |
| 3238 E Easton St Tulsa, OK | 2.0 | 1.0 | 800 | $1,150 | $1.44 | 3d | 1 | 1.25mi |
| 3328 E 7th St Tulsa, OK | 2.0 | 1.0 | 1008 | $1,525 | $1.51 | 15d | 1 | 1.25mi |
| 1736 S Xanthus Ave Tulsa, OK | 2.0 | 1.0 | 1328 | $1,450 | $1.09 | 3d | 1 | 1.27mi |
| 723 N Gary Pl Tulsa, OK | 2.0 | 1.0 | 1213 | $1,200 | $0.99 | 23d | 1 | 1.29mi |
| 211 S Greenwood Ave Tulsa, OK | 1.0–2.0 | 1.0–2.0 | 933 | $2,344 | $2.51 | 1d | 3 | 1.29mi |
| 1214 S Elgin Ave Unit 5 Tulsa, OK | 2.0 | 1.0 | 1200 | $1,450 | $1.21 | 23d | 1 | 1.34mi |
| 401 S Elgin Ave Tulsa, OK | 1.0–2.0 | 1.0–2.0 | 770 | $1,499 | $1.95 | 23d | 3 | 1.37mi |
| 1008 E King Pl Tulsa, OK | 3.0 | 1.0 | 1284 | $1,295 | $1.01 | 1d | 1 | 1.37mi |
| 505 E 2nd St S Tulsa, OK | 2.0 | 2.0 | 1087 | $2,180 | $2.01 | 2d | 1 | 1.38mi |
| 1036 N Madison Ave Tulsa, OK | 2.0 | 1.0 | 800 | $1,100 | $1.38 | 23d | 1 | 1.41mi |
| 415 E 2nd St S Tulsa, OK | 1.0–2.0 | 1.0–2.0 | 807 | $2,180 | $2.70 | 1d | 28 | 1.45mi |
| 1307 S Indianapolis Ave Tulsa, OK | 2.0 | 1.0 | 1108 | $1,990 | $1.80 | 1d | 1 | 1.45mi |
| 537 S Marion Ave Tulsa, OK | 2.0 | 1.0 | 933 | $1,325 | $1.42 | 3d | 1 | 1.50mi |
Listing history 11 events
-
2026-05-19$65,000 Active
-
2014-09-19soldstatus $62,000
-
2014-03-06soldstatus $24,500 197-char remark
Show marketing remark (197 chars)
HUD#422-287352 BACK ON THE MARKET Classic bungalow with large rooms, vinyl siding and nice yard in Kendall Whittier urban renewal area. Needs a little refresh and a new family. As-Is, 203K eligible
-
2013-09-18$29,600 197-char remark
Show marketing remark (197 chars)
HUD#422-287352 BACK ON THE MARKET Classic bungalow with large rooms, vinyl siding and nice yard in Kendall Whittier urban renewal area. Needs a little refresh and a new family. As-Is, 203K eligible
-
2008-08-11soldstatus $65,500
-
2006-07-13soldstatus $60,000
-
2006-07-11soldstatus $59,900 244-char remark
Show marketing remark (244 chars)
Fresh new listing in Kendall-Whittier! 3+ bedroom, new C. H. & A, new carpet, movin ready! One year home warranty. Wonderful new kitchen with lots of space, ceramic tile, huge utility room. Back-yard is like a secret garden. All for 59,900!
-
2006-06-22historical 244-char remark
Show marketing remark (244 chars)
Fresh new listing in Kendall-Whittier! 3+ bedroom, new C. H. & A, new carpet, movin ready! One year home warranty. Wonderful new kitchen with lots of space, ceramic tile, huge utility room. Back-yard is like a secret garden. All for 59,900!
-
2006-06-02$59,900 244-char remark
Show marketing remark (244 chars)
Fresh new listing in Kendall-Whittier! 3+ bedroom, new C. H. & A, new carpet, movin ready! One year home warranty. Wonderful new kitchen with lots of space, ceramic tile, huge utility room. Back-yard is like a secret garden. All for 59,900!
-
2004-06-03historical
-
2003-11-10$59,500
ⓘ Source: listings_history table (triggers on properties + properties_extension) + one-shot
backfill from property_details.listing_events for pre-trigger history.
Tax reassessment forecast OK · Resets to sale price
- Current annual tax
- $1,183 · $99/mo
- Projected year-2 tax
- $1,183 · $99/mo
- Expected delta
- $0/yr ($0/mo · 0.0%)
ⓘ Screening estimate from a state-policy table — verify with the county assessor before closing.
Climate risk First Street
- Flood 1/10 Low FEMA zone X (unshaded) · 0% chance over 30 yrs
- Wildfire 1/10 Low
- Heat 6/10 Major 7 d/yr ≥110°F today · 18 d/yr by 30 yrs out
- Wind 2/10 Low 4% chance of damaging wind over 30 yrs
- Air quality 2/10 Low 2 unhealthy d/yr today · 2 by 30 yrs out
Nearby sold comps map
Loading sold comps map…
Walkable amenities ~0.75 mi
Loading nearby amenities…
Taxation est. · year 1
- Rental income
- $19,355
- − Mortgage interest
- −$3,641
- − Property taxes
- −$1,183
- − Insurance
- −$325
- − Repairs & maintenance
- −$1,548
- − Management
- −$1,548
- − Depreciation
- −$1,891
- Taxable income
- $9,218
- Est. tax owed @ 24.0%
- −$2,212
- After-tax cash flow
- $7,480/yr
For passive investors: Depreciation is non-cash, so a rental often shows a tax loss while cash-flowing — sheltering income. Rental losses are passive: they offset passive income freely, and up to $25,000/yr can offset ordinary (W-2) income if you actively participate and your MAGI is under $100k (phasing out to $0 by $150k); unused losses carry forward. On sale, claimed depreciation is recaptured at up to 25%, and gains may owe capital-gains tax (a 1031 exchange can defer both). Figures are a year-1 estimate at your 24.0% rate — not tax advice; consult a CPA.
Schools (NCES district)
- District
- Tulsa
- NCES district ID
- 4030240
- Math proficiency
- 7% ▼ -9.00%
- Reading proficiency
- 12% ▼ -7.00%
- Median HH income
- $37,895
- Composite
- 8.04/100
- National rank
- #9919
- State rank
- #250 of 270 in OK
Livability — Tulsa
- Score
- 75/100
- State rank
- #13
- US rank
- #4058
Category grades
Schools grade is shown separately in the Schools card above.
Census & demographics
- Census place
- Tulsa, OK
- County
- Tulsa County · 640,811 people
- City population
- 389,418
- Metro
- Tulsa, OK
- Population (ZIP)
- 12,806
- Household income
- $54,691
- Rent vs Own
- Severe rent burden
- 700.0
Population outlook (Tulsa County) Hauer SSP2
- Today (2025)
- 723,846 people
- By 2030
- 766,033 · +5.8%
- By 2040
- 851,386 · +17.6%
- By 2050
- 938,389 · +29.6%
- By 2075
- 1,166,011 · +61.1%
- By 2100
- 1,350,277 · +86.5%
Race, ethnicity, and origin ACS 2023
- Neighborhood character
- Diverse neighborhood (Simpson 0.57)
- Race & ethnicity
- White 64% Hispanic / Latino 14% Two or more races 12% Black 7% Native American 5% Asian 4%
- Hispanic origin (detail)
- Mexican 11%
- Common ancestry
- Lithuanian 2% Slovak 2% Italian 2%
- Foreign-born
- 12% · Canada, China, South Korea
- Languages at home
- 81% English-only · Spanish 12% Arabic 2% Other Asian/Pacific 1%
Political lean MEDSL · Tulsa
- 2024 margin
- R (+15.2) · D 41.3% · R 56.5% · Other 2.2%
- 2008→2024 swing
- +9.2pp toward D · 2008: -24.5pp · 2024: -15.2pp
- All cycles
- 2024: R+15.2 2020: R+15.6 2016: R+22.9 2012: R+27.4 2008: R+24.5
Not yet ingested
- Civics
- —
Market trends
- HPI YoY
- ▼ -322.78%
- Current HPI
- 306.7856
- Rent YoY
- ▲ 5.80%
- Metro
- Tulsa, OK
- State GDP YoY
- ▲ 1.55%
- F500 in state
- 6
Industry mix (Fortune 500 HQ in OK)
| Industry | F500 HQs | Revenue |
|---|---|---|
| Energy | 3 | $48B |
|
||
Price history
+9.2% since first listed11 events — show timeline
- 2026-05-19 Listed $65,000 MLS Technology, Inc.
- 2014-09-19 Sold (Public Records) $62,000 Public Records
- 2014-03-06 Sold (MLS) $24,500 MLS Technology, Inc.
- 2013-09-18 Listed $29,600 MLS Technology, Inc.
- 2008-08-11 Sold (Public Records) $65,500 Public Records
- 2006-07-13 Sold (Public Records) $60,000 Public Records
- 2006-07-11 Sold (MLS) $59,900 MLS Technology, Inc.
- 2006-06-22 Listing Removed — MLS Technology, Inc.
- 2006-06-02 Listed $59,900 MLS Technology, Inc.
- 2004-06-03 Listing Removed — MLS Technology, Inc.
- 2003-11-10 Listed $59,500 MLS Technology, Inc.
Property tax history
+1.9%/yrLatest (2025): $1,183 · +8.6% YoY. Source: county tax records.
Cash-flow waterfall
monthlySold comps — $/sqft
last 12 mo · ≤1 miLoading sold comps…