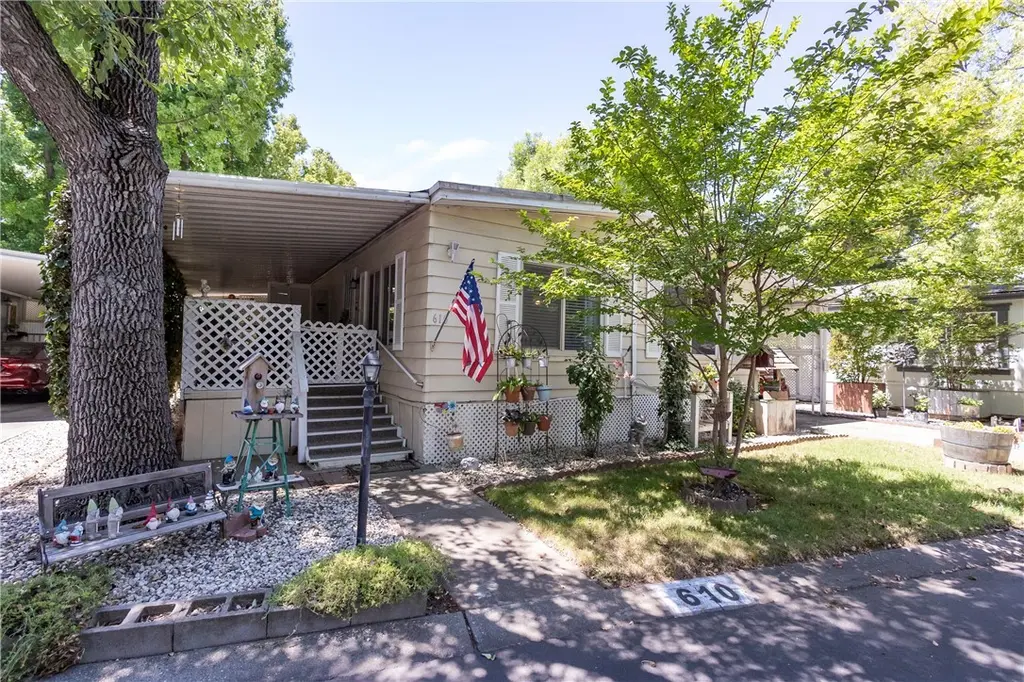
567 E Lassen #610 · Chico, CA
Flood risk 6/10 · Moderate
- FEMA flood zone
- X (shaded)
- Chance of flooding over 30 yrs
- 0.65%
- Est. flood insurance / yr
- $507 – $1,088
Fire risk 7/10 · Major
- Est. fire insurance / yr
- $659 – $1,223
Heat risk 8/10 · Major
- Hot days now (above 105°F)
- 5 days/yr
- Hot days in 30 yrs
- 12 days/yr
Wind risk 1/10 · Minimal
- Chance of severe wind over 30 yrs
- —
Air-quality risk 10/10 · Severe
- Unhealthy air days now
- 35 days/yr
- Unhealthy air days in 30 yrs
- 40 days/yr
Risk factors via First Street. Map © Google.
Why this score? — see what drove the B+ grade
The composite is a weighted blend of 9 inputs, each scored 0–100. Each bar is that input's sub-score; the figure is the points it added to the 100-point composite (weight × sub-score).
- Cash flow +30.0/30.0
- ARV discount +15.0/15.0
- 1% rule +10.0/10.0
- DSCR +10.0/10.0
- Schools +4.6/10.0
- Livability +3.6/5.0
- Rent growth +2.9/5.0
- Condition / age +2.8/5.0
- Appreciation +0.0/10.0
$58,000
🖨 Deal sheet 📄 Offer letter ✓ Due diligence
Listing remarks
This mobile has an unusually large private lot for privacy and gardening. 2 Bedroom 2 bath in the Senior Park, Almond Grove Mobile Home Park. Beautifully remodeled kitchen, many upgrades over the years. Wall texturing, painting, and good upkeep. Spacious shaded front porch, generous carport. Shop Shed for storage. Washer and Dryer Included. Park has a pool and is very reasonable rent. The mature landscaping on this mobile allows for a lot of shade during our Chico Summers.
Key facts
- Generous carport
- Large lot
- Pool
Tags
Property features AI
Finance
- Other: Park name: Almond Grove; Body type: Double (multi-section/mobile)
- Financial info: Land lease amount $680 (land lease applies); Rent includes trash and water
- HOA & community: Senior community; Community features include gutters, curbs, and biking; Land lease in place
Exterior
- Parking: Attached carport; Has parking; Located in Almond Grove mobile park; access via paved city streets
- Security: Doors swing inward for accessibility
- Utilities: Electricity on property and connected; Public/district water; Public sewer; Cable connected
- Home design: Single-story mobile home (Glenbrook model); Mobile home remains on site; Tie down foundation; Entry level 1
- Construction: Aluminum construction materials; Tie down foundation
- Exterior features: Aluminum siding and aluminum skirt; Awning; Covered front porch and additional porch/deck; One shed on the property; Treed, rectangular lot
Interior
- Kitchen: Electric oven; Dishwasher; Water heater unit
- Bedrooms: All bedrooms on the main floor; Main floor bedroom
- Flooring: Vinyl flooring; Carpet
- Bathrooms: 2 full bathrooms; Bathtub and walk-in shower; Vanity area
- Heating & cooling: Central heating (furnace); Central cooling
- Interior features: Ceiling fan; Carbon monoxide detector(s) and fire/smoke detection system; Entry at street level; Single-level living
- Laundry & utility: Dedicated laundry room; Washer included; Dryer included; Workshop space
Neighborhood map
What this means for you Summary
Snapshot
- This is a 2-bed/2.0-bath manufactured listed at $58k. Condition is rated average.
Deal economics
- At list price, monthly cash flow is $949 ($11k/yr) — positive.
- The deal already cash-flows at list — no discount required.
- Meets the 1% rule at list price ($2k rent vs $58k).
- Cap rate 25.9% vs local median 2.6% in Chico — top-decile yield for the area; either an underpriced asset or a hidden risk that comps aren't pricing in. Stress-test before assuming the spread holds.
Location & tenants
- Location reads 72/100 on livability (#195 in CA) — a middle-class / working-renter tenant base. Strengths: amenities A+, commute A+, health & safety A-; Watch: employment C-, crime F, cost of living F.
- Chico Unified (urban): math 40% / reading 70% proficiency, ranked #117 of 517 in CA (top 23%) — acceptable for families but not a draw, mixed tenant base, ~2y average lease.
- Market conditions: Rents rising (+1.7%/yr); 151 active listings in the ZIP; 30 comparable units currently listed for rent nearby; rentals at typical pace (median 21d on market — plan ~3-4 weeks tenant-placement turnaround); 40% of comp listings sitting > 30 days — soft ceiling on asking rent; solid renter incomes; 946 units permitted in Butte County in 2024 (254 in 5+ unit buildings).
Forward outlook
- Local home prices are declining (-3.0%/yr); year-one equity from $401 of loan paydown is wiped out by about $2k of value loss. Plan a longer hold.
- Butte County population projected at +10% by 2050 — modest demand growth; plan on rents tracking national, not racing it.
- At projected returns (-3.0% appreciation + 1.7% rent growth), your $16k cash investment doubles in ~2 years — after that, you're playing with house money.
Negotiation context
- Only 10 days on market — expect competitive offers; lowballing is unlikely to land.
Risks & watch-outs
- Climate carrying-cost: major flood risk; major wildfire risk; extreme-heat days projected 5→12/yr by 2055 (HVAC capex compounding) — expect insurance premiums to compound above CPI over the hold.
Questions for the listing agent
- Built in 1973 — when were the roof, HVAC, electrical panel, plumbing, and water heater last replaced?
- Is there a deadline driving the sale (1031 exchange, divorce, estate, relocation)? That informs how much negotiation room exists.
- Schools are B-rated — typically a magnet for longer-tenancy family renters. What's the average tenant stay here, and is there a school-zone premium baked into asking?
- Crime grade is F in this area — have there been break-ins, vandalism, or insurance claims at this property in the last 3 years? What carrier currently insures it and at what premium?
- What's the average days-on-market for RENTAL listings here right now (not sales)? A rising rental-DOM trend means longer vacancies and softer asking-rent achievability than the comps imply.
- What's the recent tenant-quality profile in this submarket — average credit score on applications, eviction rate, late-payment / NSF rate, and stable-employment percentage? A property-management company in the area should have these aggregated.
- How much new for-sale + rental construction is in the pipeline within 1–3 miles? Heavy new supply typically softens prices + rents 12–24 months out; constrained supply supports both.
Investment metrics
- 1% rule
- 2.95% ✓
- Cap rate
- 25.93%
- Cash-on-cash
- 70.13%
- DSCR
- 4.12
- GRM
- 2.8
CMA / ARV
- ARV (on-the-fly)
- $74,250
- Comps found
- 12
Show comp detail 12 sales within ~0.75 mi
| Address | Dist | Beds/Ba | Sqft | Sold | Price | $/sf | Match |
|---|---|---|---|---|---|---|---|
| 701 E Lassen Ave #108 | 0.32mi | 3/2.0 (+1) | 1,440 (+5%) | 2mo | $20,000 | $14 | 71 |
| 701 E Lassen Ave #279 | 0.52mi | 2/2.0 | 1,400 (+2%) | 6mo | $75,000 | $54 | 68 |
| 701 E Lassen Ave #210 | 0.45mi | 2/2.0 | 1,440 (+5%) | 8mo | $43,500 | $30 | 64 |
| 701 E Lassen Ave #26 | 0.33mi | 2/1.0 | 1,296 (-6%) | 9mo | $37,000 | $29 | 63 |
| 123 Henshaw Ave #616 | 0.66mi | 3/2.0 (+1) | 1,368 (-0%) | 1mo | $50,000 | $37 | 63 |
| 123 Henshaw Ave #706 | 0.68mi | 3/2.0 (+1) | 1,344 (-2%) | 0mo | $88,000 | $65 | 59 |
| 701 E Lassen Ave #272 | 0.51mi | 3/2.0 (+1) | 1,287 (-6%) | 7mo | $63,000 | $49 | 55 |
| 123 Henshaw Ave #518 | 0.63mi | 3/2.0 (+1) | 1,383 (+1%) | 12mo | $155,000 | $112 | 55 |
| 123 Henshaw #605 | 0.67mi | 3/2.0 (+1) | 1,440 (+5%) | 3mo | $138,000 | $96 | 53 |
| 701 E Lassen Ave #232 | 0.52mi | 3/2.0 (+1) | 1,536 (+12%) | 3mo | $82,500 | $54 | 49 |
| 123 Henshaw #406 | 0.60mi | 3/2.0 (+1) | 1,248 (-9%) | 5mo | $66,000 | $53 | 47 |
| 123 Henshaw Ave #205 | 0.57mi | 3/2.0 (+1) | 1,198 (-13%) | 2mo | $89,000 | $74 | 45 |
Match score weights: distance 35% · size 25% · config 20% · recency 20%. Top-matched comps best support the ARV.
Projected returns pro-forma
-3.0% appreciation · 1.7% rent growth · sell at horizon
- IRR
- 68.2%
- Equity multiple
- 4.01×
- Total profit
- $48,866
- Equity at exit
- $8,648
- IRR
- 71.9%
- Equity multiple
- 7.88×
- Total profit
- $111,669
- Equity at exit
- $5,015
Cash invested: $16,240 (down + closing). Projections, not guarantees.
Landlord ↔ Tenant lean methodology
- Overall (STATE)
- 18 Strongly Tenant-Friendly
- State California
- 18 Strongly Tenant-Friendly · D+13
- County
- — inherits STATE
- City
- — inherits STATE
ZIP-level market 95973
- Rents YoY
- 1.7%
- Active inventory
- 151
- Price-to-rent
- 2.8×
Monthly cashflow live
- Estimated rent
- $1,709 high interval (Pro) →
- Mortgage (P&I)
- −$304
- Tax est. 1.5%
- −$72 /mo · $870/yr
- Insurance
- −$24
- HOA
- −$0
- Vacancy / Maint / Mgmt
- −$359
- Net cashflow
- $949
Break-even live
UW: 25.0% down · 7.5% · 30yr · 1.5% tax · 5.0% vac · 8.0% maint · 8.0% mgmt
Financing live
Cash to close
- Down payment
- $14,500
- Closing costs
- $1,740
- Reserves months
- —
- Total cash needed
- —
Loan-product check · same deal, 3 products live
Conventional
25% down · 7.5% · 30yr
- Down + closing
- —
- Monthly P&I
- —
- Monthly cashflow
- —
- DSCR
- —
- Eligible?
- —
Personal DTI + credit; lowest rate.
DSCR
20% down · 8.5% · 30yr
- Down + closing
- —
- Monthly P&I
- —
- Monthly cashflow
- —
- DSCR
- —
- Eligible?
- —
No personal income docs; deal must DSCR.
Hard money
10% down · 12.0% · 12mo
- Down + closing
- —
- Monthly P&I
- —
- Monthly cashflow
- —
- DSCR
- —
- Eligible?
- —
Short-term bridge; refi at stabilization.
Rent comps 30 comps
| Address | Beds | Baths | Sqft | Rent | $/sqft | DOM | Units | Dist |
|---|---|---|---|---|---|---|---|---|
| 583 Morgan Dr #2 Chico, CA | 3.0 | 2.0 | 1100 | $1,750 | $1.59 | 21d | 1 | 0.27mi |
| 2909 Godman Ave Unit 2909-2 Chico, CA | 3.0 | 2.0 | 1170 | $1,725 | $1.47 | 43d | 1 | 0.31mi |
| 490 Posada Way Chico, CA | 3.0 | 2.0 | 1200 | $2,000 | $1.67 | 13d | 1 | 0.33mi |
| 1 Mayfair Dr Chico, CA | 2.0 | 1.0 | 900 | $1,325 | $1.47 | 43d | 1 | 0.33mi |
| 599 East Ave Chico, CA | 3.0 | 1.0 | 989 | $1,750 | $1.77 | 21d | 1 | 0.44mi |
| 2485 Pillsbury Rd Unit 2485-03 Chico, CA | 2.0 | 2.0 | 950 | $1,595 | $1.68 | 13d | 1 | 0.50mi |
| 194 E Shasta Ave Unit 3B Chico, CA | 2.0 | 1.0 | 875 | $1,900 | $2.17 | 43d | 1 | 0.51mi |
| 390 Rio Lindo Ave Chico, CA | 1.0–2.0 | 1.0 | 727 | $1,550 | $2.13 | 13d | 6 | 0.60mi |
| 64 Tara Ter Unit 64-2 Chico, CA | 2.0 | 1.5 | 1048 | $1,625 | $1.55 | 43d | 1 | 0.61mi |
| 29 Cameo Dr #2 Chico, CA | 2.0 | 1.0 | 928 | $1,400 | $1.51 | 43d | 1 | 0.73mi |
| 251 Rio Lindo Ave Chico, CA | 2.0 | 1.0 | 1100 | $1,400 | $1.27 | 43d | 1 | 0.74mi |
| 2780 Pillsbury Rd Chico, CA | 2.0 | 1.0 | 905 | $1,345 | $1.49 | 43d | 2 | 0.75mi |
| 1080 E Lassen Ave Chico, CA | 1.0–2.0 | 1.0–2.0 | 802 | $1,650 | $2.06 | 13d | 10 | 0.76mi |
| 259 Rio Lindo Ave Unit 259-16 Chico, CA | 2.0 | 2.0 | 1426 | $1,595 | $1.12 | 43d | 1 | 0.80mi |
| 225 Mission Serra Ter Chico, CA | 2.0 | 2.0 | 1358 | $2,000 | $1.47 | 13d | 1 | 0.89mi |
| 400 Mission Ranch Blvd Chico, CA | 1.0–3.0 | 1.0–2.0 | 995 | $1,588 | $1.59 | 13d | 1 | 0.90mi |
| 2050 Laburnum Ave Chico, CA | 3.0 | 2.0 | 1455 | $1,795 | $1.23 | 13d | 1 | 1.05mi |
| 101 W Lindo Ave Unit Lindo Ave unit 101 2, Chico, CA | 2.0 | 1.0 | 950 | $1,650 | $1.74 | 43d | 1 | 1.06mi |
| 2619 Waverly Ct Chico, CA | 2.0 | 2.0 | 1225 | $2,400 | $1.96 | 21d | 1 | 1.07mi |
| 298 E 9th Ave Chico, CA | 2.0 | 1.0 | 947 | $2,195 | $2.32 | 13d | 1 | 1.22mi |
| 1836 Laburnum Ave Chico, CA | 2.0 | 1.0 | 905 | $1,450 | $1.60 | 13d | 2 | 1.27mi |
| 711 W East Ave Apt 2 Chico, CA | 2.0 | 1.0 | 900 | $1,300 | $1.44 | 13d | 1 | 1.28mi |
| 2739 Ceres Ave Chico, CA | 3.0 | 2.0 | 1100 | $2,100 | $1.91 | 43d | 1 | 1.29mi |
| 711 W East Ave Unit 08 Chico, CA | 2.0 | 1.0 | 900 | $1,300 | $1.44 | 43d | 1 | 1.31mi |
| 1717 E Eaton Rd Chico, CA | 2.0 | 1.5 | 1100 | $1,550 | $1.41 | 43d | 1 | 1.36mi |
| 1749 Eaton Rd Chico, CA | 2.0–3.0 | 1.5–2.5 | 1104 | $1,595 | $1.44 | 13d | 1 | 1.40mi |
| 1740 Arcadian Ave Unit 1740-104 Chico, CA | 2.0 | 2.0 | 1218 | $2,095 | $1.72 | 21d | 1 | 1.42mi |
| 100 Penzance Ave Chico, CA | 1.0–2.0 | 1.0–2.0 | 890 | $1,710 | $1.92 | 13d | 26 | 1.47mi |
| 266 E 6th Ave Chico, CA | 3.0 | 2.0 | 1200 | $1,995 | $1.66 | 21d | 1 | 1.47mi |
| 1618 Sunset Ave Chico, CA | 3.0 | 1.0 | 1362 | $1,700 | $1.25 | 13d | 1 | 1.47mi |
Listing history 10 events
-
2026-06-19days on market $58,000 Active 10 DOM
-
2026-06-18days on market $58,000 Active 9 DOM
-
2026-06-17days on market $58,000 Active 8 DOM
-
2026-06-16days on market $58,000 Active 7 DOM
-
2026-06-15days on market $58,000 Active 6 DOM
-
2026-06-14days on market $58,000 Active 4 DOM
-
2026-06-13remarks 477-char remark
-
2026-06-13days on market $58,000 Active 3 DOM
-
2026-06-10remarks 411-char remark
-
2026-06-10$58,000 Active 1 DOM
ⓘ Source: listings_history table (triggers on properties + properties_extension) + one-shot
backfill from property_details.listing_events for pre-trigger history.
Climate risk First Street
- Flood 6/10 Major FEMA zone X (shaded) · 65% chance over 30 yrs
- Wildfire 7/10 Severe
- Heat 8/10 Severe 5 d/yr ≥105°F today · 12 d/yr by 30 yrs out
- Wind 1/10 Low
- Air quality 10/10 Extreme 35 unhealthy d/yr today · 40 by 30 yrs out
Nearby sold comps map
Loading sold comps map…
Walkable amenities ~0.75 mi
Loading nearby amenities…
Taxation est. · year 1
- Rental income
- $20,504
- − Mortgage interest
- −$3,249
- − Property taxes
- −$870
- − Insurance
- −$290
- − Repairs & maintenance
- −$1,640
- − Management
- −$1,640
- − Depreciation
- −$1,687
- Taxable income
- $11,128
- Est. tax owed @ 24.0%
- −$2,671
- After-tax cash flow
- $8,718/yr
For passive investors: Depreciation is non-cash, so a rental often shows a tax loss while cash-flowing — sheltering income. Rental losses are passive: they offset passive income freely, and up to $25,000/yr can offset ordinary (W-2) income if you actively participate and your MAGI is under $100k (phasing out to $0 by $150k); unused losses carry forward. On sale, claimed depreciation is recaptured at up to 25%, and gains may owe capital-gains tax (a 1031 exchange can defer both). Figures are a year-1 estimate at your 24.0% rate — not tax advice; consult a CPA.
Condition & rehab AI · 12 photos
This mobile home is in average condition with some cosmetic updates needed. It has a spacious layout and mature landscaping, making it a good investment opportunity.
Repairs flagged
- Minor front porch lattice — slight wear
- Minor mobile home siding — some wear
Value-add opportunities
- Both paint interior walls — enhances curb appeal and interior aesthetics
- Both replace carpet with hardwood — increases both resale and rental value
- Both update kitchen cabinets — modernizes kitchen and increases value
- Both install new windows — improves energy efficiency and curb appeal
Renovation cost estimate screening
| Repair item | Severity | Est. cost |
|---|---|---|
| front porch lattice · slight wear | Minor | $500–3,000 |
| mobile home siding · some wear | Minor | $500–3,000 |
| Total estimated repair cost · 2 items | $1,000–6,000 |
Value-add ROI direction
- Both paint interior walls — enhances curb appeal and interior aesthetics ↑
- Both replace carpet with hardwood — increases both resale and rental value ↑
- Both update kitchen cabinets — modernizes kitchen and increases value ↑
- Both install new windows — improves energy efficiency and curb appeal ↑
ⓘ Cost ranges are severity-bucket heuristics (US national rule-of-thumb). Get contractor quotes + a written scope before underwriting a rehab budget.
Schools (NCES district)
- District
- Chico Unified
- NCES district ID
- 0608370
- Math proficiency
- 40% ▼ -2.00%
- Reading proficiency
- 70% ▲ 14.00%
- Median HH income
- $46,223
- Composite
- 46.45/100
- National rank
- #2443
- State rank
- #117 of 517 in CA
Livability — Chico
- Score
- 72/100
- State rank
- #195
- US rank
- #6332
Category grades
Schools grade is shown separately in the Schools card above.
Census & demographics
- Census place
- Chico, CA
- County
- Butte County · 175,030 people
- City population
- 117,007
- Metro
- Chico, CA
- Population (ZIP)
- 39,031
- Household income
- $92,813
- Rent vs Own
- Severe rent burden
- 1230.0
Population outlook (Butte County) Hauer SSP2
- Today (2025)
- 237,527 people
- By 2030
- 243,804 · +2.6%
- By 2040
- 253,899 · +6.9%
- By 2050
- 262,561 · +10.5%
- By 2075
- 283,709 · +19.4%
- By 2100
- 282,689 · +19.0%
Race, ethnicity, and origin ACS 2023
- Neighborhood character
- Predominantly White (71%)
- Race & ethnicity
- White 71% Hispanic / Latino 19% Two or more races 10% Asian 5% Native American 1%
- Hispanic origin (detail)
- Mexican 15%
- Common ancestry
- Slovak 4% Italian 4% Russian 3%
- Foreign-born
- 8% · Canada, China
- Languages at home
- 84% English-only · Spanish 11% Other Asian/Pacific 2% Chinese 1%
Political lean MEDSL · Butte
- 2024 margin
- Toss-up / Even · D 46.8% · R 49.9% · Other 3.3%
- 2008→2024 swing
- -5.5pp toward R · 2008: 2.4pp · 2024: -3.1pp
- All cycles
- 2024: R+3.1 2020: D+1.7 2016: R+4.0 2012: R+3.9 2008: D+2.4
Not yet ingested
- Civics
- —
Market trends
- HPI YoY
- ▼ -182.94%
- Current HPI
- 259.9774
- Rent YoY
- ▲ 1.70%
- Metro
- Chico, CA
- State GDP YoY
- ▲ 3.21%
- F500 in state
- 116
Industry mix (Fortune 500 HQ in CA)
| Industry | F500 HQs | Revenue |
|---|---|---|
| Technology | 27 | $1,492B |
|
||
| Financial Services | 3 | $174B |
|
||
| Retail | 3 | $44B |
|
||
| Insurance | 3 | $26B |
|
||
| Media / Entertainment | 2 | $115B |
|
||
| Pharmaceuticals / Biotech | 2 | $62B |
|
||
Price history
1 event — show timeline
- 2026-06-09 Listed $58,000 CRMLS
Cash-flow waterfall
monthlySold comps — $/sqft
last 12 mo · ≤1 miLoading sold comps…