 Multi-family
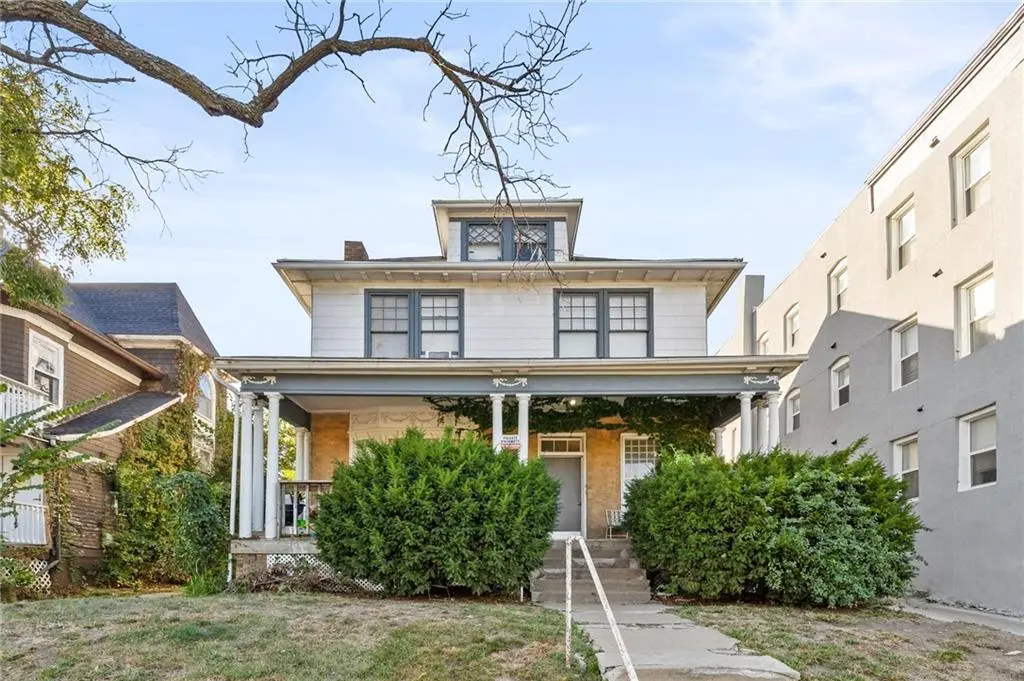
3826 Warwick Blvd · Kansas City, MO
Flood risk 1/10 · Minimal
- FEMA flood zone
- X (unshaded)
- Chance of flooding over 30 yrs
- 0.0%
- Est. flood insurance / yr
- $473 – $860
Fire risk 1/10 · Minimal
- Est. fire insurance / yr
- $1,054 – $1,958
Heat risk 4/10 · Minor
- Hot days now (above 106°F)
- 7 days/yr
- Hot days in 30 yrs
- 17 days/yr
Wind risk 2/10 · Minimal
- Chance of severe wind over 30 yrs
- —
Air-quality risk 3/10 · Minor
- Unhealthy air days now
- 2 days/yr
- Unhealthy air days in 30 yrs
- 3 days/yr
Risk factors via First Street. Map © Google.
Why this score? — see what drove the C+ grade
The composite is a weighted blend of 9 inputs, each scored 0–100. Each bar is that input's sub-score; the figure is the points it added to the 100-point composite (weight × sub-score).
- Cash flow +24.9/30.0
- ARV discount +15.0/15.0
- DSCR +8.1/10.0
- 1% rule +5.2/10.0
- Livability +3.9/5.0
- Rent growth +3.4/5.0
- Condition / age +2.5/5.0
- Schools +1.5/10.0
- Appreciation +0.0/10.0
$375,000
🖨 Deal sheet 📄 Offer letter ✓ Due diligence
Multi-family units
County records classify this as Multi-Family (2-4 Unit). Listing-text estimate: 1 unit. estimate disagrees with records
Listing remarks MLS
3826 Warwick Blvd is a well-located, three-unit multifamily asset in the heart of Midtown Kansas City. Positioned just off Main Street and within steps of the new streetcar extension, Gillham Park, and the Gillham Cycle Track, the property offers immediate income and long-term upside. Each of the three 2-bedroom, 1-bath units is fully leased and well maintained, offering a low-barrier entry point for both investors and owner-occupants seeking to establish a foothold in one of Kansas City’s most dynamic urban corridors. With market rents trending higher and walkable amenities at the doorstep, 3826 Warwick presents a compelling opportunity in a fast-appreciating submarket.
Key facts
- Fully leased
- Multifamily asset
- Gillham park
Tags
Neighborhood map
What this means for you Summary
Snapshot
- This is a 6-bed/3.0-bath multifamily listed at $375k.
Deal economics
- At list price, monthly cash flow is $806 ($10k/yr) — positive.
- The deal already cash-flows at list — no discount required.
- Meets the 1% rule at list price ($4k rent vs $375k).
- Recommended offer: $330k (12.0% below list) — sets the bar for market timing.
- Cap rate 8.9% vs local median 3.9% in Kansas City — top-decile yield for the area; either an underpriced asset or a hidden risk that comps aren't pricing in. Stress-test before assuming the spread holds.
Location & tenants
- Location reads 78/100 on livability (#28 in MO, #2,671 nationally) — a middle-class / working-renter tenant base. Strengths: amenities A+, commute A+, cost of living A+; Watch: schools C-, crime F.
- Kansas City 33 (urban): math 12% / reading 24% proficiency, ranked #308 of 324 in MO (top 95%) — low school quality limits family demand, transient renter base, plan for 1-2y turnover; 75% free/reduced lunch — lower-income household profile, screen leases tightly.
- Market conditions: Rents rising (+3.4%/yr); 162 active listings in the ZIP; 7 comparable units currently listed for rent nearby; rentals lingering (median 44d on market — plan ~5-8 weeks vacancy on turnover, expect pricing pressure); 71% of comp listings sitting > 30 days — soft ceiling on asking rent; 4,002 units permitted in Jackson County in 2024 (2,271 in 5+ unit buildings).
- At $3,843/mo this rent would consume 75% of the median local household income ($62k/yr) (locally 1606% of renters already pay >50% of income on rent) — very limited rent-growth headroom before tenants either downsize or default.
Forward outlook
- Local home prices are declining (-3.0%/yr); year-one equity from $3k of loan paydown is wiped out by about $11k of value loss. Plan a longer hold.
- Jackson County population projected at +4% by 2050 — modest demand growth; plan on rents tracking national, not racing it.
Negotiation context
- It's been on market 237 days — a 12% lower offer ($330k) is reasonable based on typical stale-listing flexibility.
- 3 sale attempts since 20y ago with the ask held roughly flat each time — persistent listings suggest the price (not the market) is what's stuck; bring a comps-based counter.
- Current owner paid $274k; 37% above their basis — modest negotiation headroom, anchor on the comps not their cost.
Risks & watch-outs
- Watch-outs: built in 1895 — expect roof / HVAC / electrical / plumbing capex.
Questions for the listing agent
- It's been on market 237 days. Have you received any prior offers? Is the seller open to a 12% concession, seller financing, or rate buy-down credit?
- Built in 1895 — when were the roof, HVAC, electrical panel, plumbing, and water heater last replaced?
- Why hasn't it sold? Are there any deal-killer items the seller is aware of (foundation, flood, title, zoning, code violations)?
- Is there a deadline driving the sale (1031 exchange, divorce, estate, relocation)? That informs how much negotiation room exists.
- Crime grade is F in this area — have there been break-ins, vandalism, or insurance claims at this property in the last 3 years? What carrier currently insures it and at what premium?
- What's the average days-on-market for RENTAL listings here right now (not sales)? A rising rental-DOM trend means longer vacancies and softer asking-rent achievability than the comps imply.
- What's the recent tenant-quality profile in this submarket — average credit score on applications, eviction rate, late-payment / NSF rate, and stable-employment percentage? A property-management company in the area should have these aggregated.
- How much new apartment / multifamily construction is in the pipeline within 1–3 miles? Heavy new supply (>2% of stock underway) typically softens rents 12–24 months out; light construction supports rent growth.
Investment metrics
- 1% rule
- 1.02% ✓
- Cap rate
- 8.87%
- Cash-on-cash
- 9.21%
- DSCR
- 1.41
- GRM
- 8.1
CMA / ARV
- ARV (median comp)
- $744,501
- List price
- $375,000
- Delta
- -49.63%
- Verdict
- UNDERPRICED
- Comps
- 20 within 1.0 mi
Projected returns pro-forma
-3.0% appreciation · 3.42% rent growth · sell at horizon
- IRR
- -2.0%
- Equity multiple
- 0.92×
- Total profit
- $-7,980
- Equity at exit
- $55,914
- IRR
- 8.1%
- Equity multiple
- 1.62×
- Total profit
- $65,216
- Equity at exit
- $32,423
Cash invested: $105,000 (down + closing). Projections, not guarantees.
Landlord ↔ Tenant lean methodology
- Overall (STATE)
- 81 Strongly Landlord-Friendly
- State Missouri
- 81 Strongly Landlord-Friendly · R+10
- County
- — inherits STATE
- City
- — inherits STATE
ZIP-level market 64111
- Rents YoY
- 3.4%
- Active inventory
- 162
- Price-to-rent
- 24.4×
Monthly cashflow live
- Estimated rent
- $3,843 high interval (Pro) →
- Mortgage (P&I)
- −$1,967
- Tax from tax record
- −$107 /mo · $1,289/yr
- Insurance
- −$156
- HOA
- −$0
- Vacancy / Maint / Mgmt
- −$807
- Net cashflow
- $806
Break-even live
3-unit breakdown (identical units grouped — click to expand)
| Units | Beds | Baths | Est. rent |
|---|---|---|---|
| 3× units | 2 | 1 | $3,843 |
| #1 | 2 | 1 | $1,281 |
| #2 | 2 | 1 | $1,281 |
| #3 | 2 | 1 | $1,281 |
| Total (3 units) | $3,843 | ||
UW: 25.0% down · 7.5% · 30yr · 1.5% tax · 5.0% vac · 8.0% maint · 8.0% mgmt
Financing live
Cash to close
- Down payment
- $93,750
- Closing costs
- $11,250
- Reserves months
- —
- Total cash needed
- —
Loan-product check · same deal, 3 products live
Conventional
25% down · 7.5% · 30yr
- Down + closing
- —
- Monthly P&I
- —
- Monthly cashflow
- —
- DSCR
- —
- Eligible?
- —
Personal DTI + credit; lowest rate.
DSCR
20% down · 8.5% · 30yr
- Down + closing
- —
- Monthly P&I
- —
- Monthly cashflow
- —
- DSCR
- —
- Eligible?
- —
No personal income docs; deal must DSCR.
Hard money
10% down · 12.0% · 12mo
- Down + closing
- —
- Monthly P&I
- —
- Monthly cashflow
- —
- DSCR
- —
- Eligible?
- —
Short-term bridge; refi at stabilization.
Rent comps 7 comps
| Address | Beds | Baths | Sqft | Rent | $/sqft | DOM | Units | Dist |
|---|---|---|---|---|---|---|---|---|
| 3839 Harrison Blvd Kansas City, MO | 5.0 | 2.5 | 2709 | $2,950 | $1.09 | 43d | 1 | 0.60mi |
| 3327 Wyandotte St Kansas City, MO | 5.0 | 2.5 | 2902 | $2,495 | $0.86 | 43d | 1 | 0.70mi |
| 3517 Jefferson St Kansas City, MO | 5.0 | 3.5 | 3200 | $3,600 | $1.12 | 16d | 1 | 0.71mi |
| 4440 Troost Ave Kansas City, MO | 5.0 | 2.0 | 2400 | $2,250 | $0.94 | 43d | 1 | 0.98mi |
| 4444 Troost Ave Kansas City, MO | 5.0 | 2.0 | 2400 | $2,250 | $0.94 | 43d | 1 | 0.98mi |
| 908 E 31st St Kansas City, MO | 5.0 | 1.5 | 2100 | $1,800 | $0.86 | 43d | 1 | 1.11mi |
| 912 E 31st St Kansas City, MO | 5.0 | 1.5 | 2200 | $1,800 | $0.82 | 16d | 1 | 1.11mi |
Listing history 21 events
-
2026-06-18days on market $375,000 Active 237 DOM
-
2026-06-17days on market $375,000 Active 236 DOM
-
2026-06-16days on market $375,000 Active 235 DOM
-
2026-06-15days on market $375,000 Active 234 DOM
-
2026-06-13days on market $375,000 Active 232 DOM
-
2026-06-09days on market $375,000 Active 228 DOM
-
2026-06-08days on market $375,000 Active 227 DOM
-
2026-06-07days on market $375,000 Active 226 DOM
-
2026-06-05days on market $375,000 Active 223 DOM
-
2026-06-03days on market $375,000 Active 222 DOM
-
2026-06-02days on market $375,000 Active 221 DOM
-
2026-06-01days on market $375,000 Active 220 DOM
-
2026-05-31days on market $375,000 Active 219 DOM
-
2025-10-24$375,000 Active 685-char remark
Show marketing remark (685 chars)
3826 Warwick Blvd is a well-located, three-unit multifamily asset in the heart of Midtown Kansas City. Positioned just off Main Street and within steps of the new streetcar extension, Gillham Park, and the Gillham Cycle Track, the property offers immediate income and long-term upside. Each of the three 2-bedroom, 1-bath units is fully leased and well maintained, offering a low-barrier entry point for both investors and owner-occupants seeking to establish a foothold in one of Kansas City’s most dynamic urban corridors. With market rents trending higher and walkable amenities at the doorstep, 3826 Warwick presents a compelling opportunity in a fast-appreciating submarket.
-
2009-01-23soldstatus 204-char remark
Show marketing remark (204 chars)
REO, SPECIASL ADDENDUM APPLIES AND WILL BE PROVIDED UPON ACCEPTANCE OF OFFER. $1000. MINIMUM EMD. PROPERTY TO BE SOLD IN IT'S PRESENT "AS IS" CONDITION. PLEASE ALLOW A COUPLE DAYS ON ALL OFFERS.
-
2008-12-06$42,900 204-char remark
Show marketing remark (204 chars)
REO, SPECIASL ADDENDUM APPLIES AND WILL BE PROVIDED UPON ACCEPTANCE OF OFFER. $1000. MINIMUM EMD. PROPERTY TO BE SOLD IN IT'S PRESENT "AS IS" CONDITION. PLEASE ALLOW A COUPLE DAYS ON ALL OFFERS.
-
2008-10-08soldstatus $273,549
-
2006-09-19soldstatus
-
2006-09-18soldstatus
-
2006-08-04$89,900
-
1994-04-06soldstatus
ⓘ Source: listings_history table (triggers on properties + properties_extension) + one-shot
backfill from property_details.listing_events for pre-trigger history.
Tax reassessment forecast MO · Resets to sale price
- Current annual tax
- $1,289 · $107/mo
- Projected year-2 tax
- $3,638 · $303/mo
- Expected delta
- +$2,348/yr (+$196/mo · 182.2%)
ⓘ Screening estimate from a state-policy table — verify with the county assessor before closing.
Climate risk First Street
- Flood 1/10 Low FEMA zone X (unshaded) · 0% chance over 30 yrs
- Wildfire 1/10 Low
- Heat 4/10 Moderate 7 d/yr ≥106°F today · 17 d/yr by 30 yrs out
- Wind 2/10 Low
- Air quality 3/10 Moderate 2 unhealthy d/yr today · 3 by 30 yrs out
Nearby sold comps map
Loading sold comps map…
Walkable amenities ~0.75 mi
Loading nearby amenities…
Taxation est. · year 1
- Rental income
- $46,116
- − Mortgage interest
- −$21,006
- − Property taxes
- −$1,289
- − Insurance
- −$1,875
- − Repairs & maintenance
- −$3,689
- − Management
- −$3,689
- − Depreciation
- −$10,909
- Taxable income
- $3,659
- Est. tax owed @ 24.0%
- −$878
- After-tax cash flow
- $8,791/yr
For passive investors: Depreciation is non-cash, so a rental often shows a tax loss while cash-flowing — sheltering income. Rental losses are passive: they offset passive income freely, and up to $25,000/yr can offset ordinary (W-2) income if you actively participate and your MAGI is under $100k (phasing out to $0 by $150k); unused losses carry forward. On sale, claimed depreciation is recaptured at up to 25%, and gains may owe capital-gains tax (a 1031 exchange can defer both). Figures are a year-1 estimate at your 24.0% rate — not tax advice; consult a CPA.
Schools (NCES district)
- District
- Kansas City 33
- NCES district ID
- 2916400
- Math proficiency
- 12% ▼ -8.00%
- Reading proficiency
- 24% ▬ 0.00%
- Median HH income
- $35,227
- Composite
- 14.8/100
- National rank
- #9387
- State rank
- #308 of 324 in MO
Livability — Kansas City
- Score
- 78/100
- State rank
- #28
- US rank
- #2671
Category grades
Schools grade is shown separately in the Schools card above.
Census & demographics
- Census place
- Kansas City, MO
- County
- Jackson County · 687,798 people
- City population
- 439,467
- Metro
- Kansas City, MO-KS
- Population (ZIP)
- 16,887
- Household income
- $61,729
- Rent vs Own
- Severe rent burden
- 1606.0
Population outlook (Jackson County) Hauer SSP2
- Today (2025)
- 719,589 people
- By 2030
- 731,456 · +1.6%
- By 2040
- 746,689 · +3.8%
- By 2050
- 749,289 · +4.1%
- By 2075
- 736,227 · +2.3%
- By 2100
- 668,210 · -7.1%
Race, ethnicity, and origin ACS 2023
- Neighborhood character
- Predominantly White (70%)
- Race & ethnicity
- White 70% Hispanic / Latino 10% Black 10% Two or more races 9% Asian 3%
- Hispanic origin (detail)
- Mexican 8%
- Common ancestry
- Lithuanian 3% Slovak 2% Serbian 2%
- Foreign-born
- 6% · Canada, China
- Languages at home
- 90% English-only · Spanish 5% Other Asian/Pacific 1% Chinese 1%
Political lean MEDSL · Jackson
- 2024 margin
- D (+19.3) · D 58.9% · R 39.5% · Other 1.6%
- 2008→2024 swing
- -6.1pp toward R · 2008: 25.4pp · 2024: 19.3pp
- All cycles
- 2024: D+19.3 2020: D+22.0 2016: D+16.6 2012: D+19.0 2008: D+25.4
Not yet ingested
- Civics
- —
Market trends
- HPI YoY
- ▼ -341.84%
- Current HPI
- 282.068
- Rent YoY
- ▲ 3.42%
- Metro
- Kansas City, MO-KS
- State GDP YoY
- ▲ 1.84%
- F500 in state
- 20
Industry mix (Fortune 500 HQ in MO)
| Industry | F500 HQs | Revenue |
|---|---|---|
| Healthcare | 1 | $163B |
|
||
| Insurance | 1 | $21B |
|
||
| Industrial Technology | 1 | $17B |
|
||
| Retail | 1 | $16B |
|
||
| Industrial Distribution | 1 | $10B |
|
||
| Utilities | 1 | $9B |
|
||
Price history
+317.1% since first listed8 events — show timeline
- 2025-10-24 Listed $375,000 Heartland MLS as Distributed by MLS Grid
- 2009-01-23 Sold (MLS) — Heartland MLS as Distributed by MLS Grid
- 2008-12-06 Listed $42,900 Heartland MLS as Distributed by MLS Grid
- 2008-10-08 Sold (Public Records) $273,549 Public Records
- 2006-09-19 Sold (MLS) — Heartland MLS as Distributed by MLS Grid
- 2006-09-18 Sold (Public Records) — Public Records
- 2006-08-04 Listed $89,900 Heartland MLS as Distributed by MLS Grid
- 1994-04-06 Sold (Public Records) — Public Records
Property tax history
-0.5%/yrLatest (2015): $1,289 · -0.5% YoY. Source: county tax records.
Cash-flow waterfall
monthlySold comps — $/sqft
last 12 mo · ≤1 miLoading sold comps…