4010 Harrisburg Cv · San Antonio, TX
Flood risk No data
- FEMA flood zone
- —
- Chance of flooding over 30 yrs
- —
- Est. flood insurance / yr
- —
Fire risk No data
- Est. fire insurance / yr
- —
Heat risk No data
- Hot days now (above threshold)
- —
- Hot days in 30 yrs
- —
Wind risk No data
- Chance of severe wind over 30 yrs
- —
Air-quality risk No data
- Unhealthy air days now
- —
- Unhealthy air days in 30 yrs
- —
Risk factors via First Street. Map © Google.
Why this score? — see what drove the D+ grade
The composite is a weighted blend of 9 inputs, each scored 0–100. Each bar is that input's sub-score; the figure is the points it added to the 100-point composite (weight × sub-score).
- ARV discount +15.0/15.0
- Cash flow +10.0/30.0
- Appreciation +4.8/10.0
- Livability +4.0/5.0
- Condition / age +4.0/5.0
- 1% rule +3.0/10.0
- DSCR +2.8/10.0
- Rent growth +2.5/5.0
- Schools +1.9/10.0
$202,499
🖨 Deal sheet 📄 Offer letter ✓ Due diligence
Listing remarks
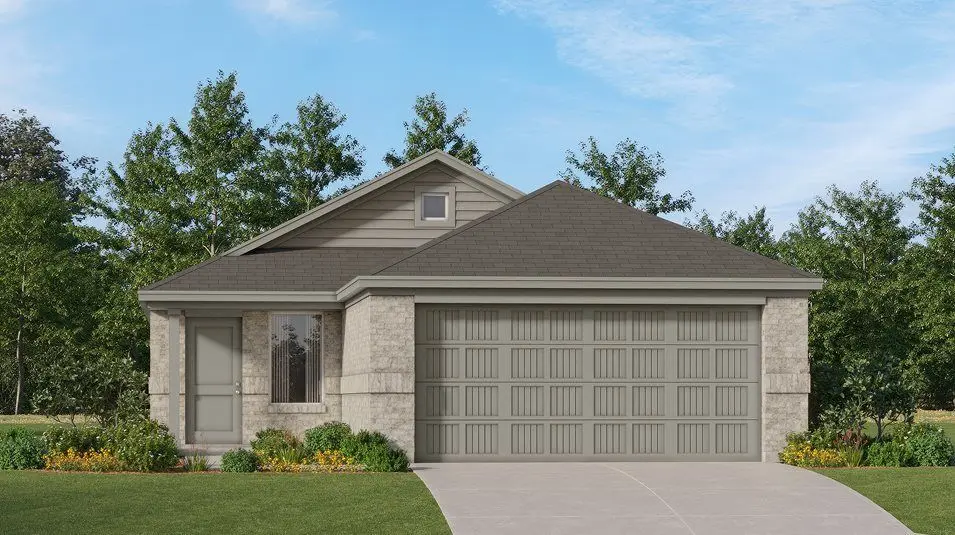
This single-level home showcases a spacious open floorplan shared between the kitchen, dining area and family room for easy entertaining during gatherings. An owner's suite enjoys a private location in a rear corner of the home, complemented by an en-suite bathroom and walk-in closet. There are two secondary bedrooms along the side of the home, which are comfortable spaces for household members and overnight guests.
Key facts
- Walk-in closet
- Open floorplan
- Secondary bedrooms
Tags
Property features AI
Exterior
- Parking: 2 total parking spaces; 2-car garage
- Home design: Single-family home; Kitson plan
- Exterior features: Living area approximately 1,402
Interior
- Bedrooms: 3 bedrooms
- Bathrooms: 2 full bathrooms
- Interior features: Spec new construction (Kitson plan)
Neighborhood map
What this means for you Summary
Snapshot
- This is a 3-bed/2.0-bath single-family listed at $202k. Condition is rated good.
Deal economics
- At list price, monthly cash flow is $-124 ($-1k/yr) — negative.
- To cash-flow at today's rent, offer at most $185k (8.9% below list).
- To meet the 1% rule (rent ≥ 1% of price), the offer needs to be $161k (20.3% below list).
- Recommended offer: $161k (20.3% below list) — sets the bar for 1% rule.
- Cap rate 5.6% vs local median 3.8% in San Antonio — top-decile yield for the area; either an underpriced asset or a hidden risk that comps aren't pricing in. Stress-test before assuming the spread holds.
Location & tenants
- Location reads 80/100 on livability (#31 in TX, #1,616 nationally) — a professional / high-income tenant draw. Strengths: amenities A+, commute A+, cost of living A+; Watch: schools C-, crime F.
- East Central ISD (rural): math 16% / reading 25% proficiency, ranked #758 of 826 in TX (top 92%) — low school quality limits family demand, transient renter base, plan for 1-2y turnover; 61% free/reduced lunch — lower-income household profile, screen leases tightly.
- Market conditions: 152 active listings in the ZIP; 26 comparable units currently listed for rent nearby; rentals at typical pace (median 24d on market — plan ~3-4 weeks tenant-placement turnaround); 8,308 units permitted in Bexar County in 2024 (2,506 in 5+ unit buildings).
- This rent runs 35% of the median local income ($55k/yr) — at the standard rent-burdened threshold; future hikes will face affordability resistance.
Forward outlook
- In year one you build about $491 of equity ($1k loan paydown + $-909 appreciation (-0.5% local appreciation)).
- Bexar County population projected at +50% by 2050 — long-run rental-demand tailwind backs the buy-and-hold thesis.
Negotiation context
- Only 12 days on market — expect competitive offers; lowballing is unlikely to land.
Questions for the listing agent
- What do current leases actually rent for vs. the listed asking? Can we see a recent rent roll and the last 12 months of T-12 income?
- Is there a deadline driving the sale (1031 exchange, divorce, estate, relocation)? That informs how much negotiation room exists.
- Crime grade is F in this area — have there been break-ins, vandalism, or insurance claims at this property in the last 3 years? What carrier currently insures it and at what premium?
- The area grade is low — what's the realistic commute time and amenity access for the typical tenant pool here? Any planned neighborhood developments (good or bad) we should know about?
- What's the average days-on-market for RENTAL listings here right now (not sales)? A rising rental-DOM trend means longer vacancies and softer asking-rent achievability than the comps imply.
- What's the recent tenant-quality profile in this submarket — average credit score on applications, eviction rate, late-payment / NSF rate, and stable-employment percentage? A property-management company in the area should have these aggregated.
- How much new for-sale + rental construction is in the pipeline within 1–3 miles? Heavy new supply typically softens prices + rents 12–24 months out; constrained supply supports both.
Investment metrics
- 1% rule
- 0.80% ✗
- Cap rate
- 5.56%
- Cash-on-cash
- -2.62%
- DSCR
- 0.88
- GRM
- 10.5
CMA / ARV
- ARV (on-the-fly)
- $253,762
- Comps found
- 12
Show comp detail 12 sales within ~0.75 mi
| Address | Dist | Beds/Ba | Sqft | Sold | Price | $/sf | Match |
|---|---|---|---|---|---|---|---|
| 4619 Christopher St | 0.50mi | 3/2.0 | 1,396 (-0%) | 4mo | $278,095 | $199 | 73 |
| 6326 Marco Plns | 0.47mi | 3/2.0 | 1,450 (+3%) | 1mo | $215,000 | $148 | 72 |
| 7319 Nicholas Blf | 0.29mi | 3/2.0 | 1,535 (+10%) | 3mo | $180,000 | $117 | 68 |
| 4642 Christopher St | 0.47mi | 3/2.0 | 1,396 (-0%) | 12mo | $267,999 | $192 | 67 |
| 7251 Meadow Acres | 0.59mi | 3/2.0 | 1,440 (+3%) | 2mo | $219,900 | $153 | 66 |
| 4406 Meadowland | 0.63mi | 3/2.0 | 1,450 (+3%) | 2mo | $184,900 | $128 | 63 |
| 4606 Christopher St | 0.46mi | 3/2.0 | 1,489 (+6%) | 14mo | $268,950 | $181 | 57 |
| 4630 Christopher St | 0.46mi | 3/2.0 | 1,489 (+6%) | 16mo | $275,950 | $185 | 55 |
| 4619 Daniel Crk | 0.45mi | 3/2.5 | 1,508 (+8%) | 15mo | $256,150 | $170 | 52 |
| 4050 Adair Blf | 0.75mi | 3/2.0 | 1,406 (+0%) | 16mo | $249,000 | $177 | 52 |
| 4614 Christopher St | 0.46mi | 3/2.0 | 1,535 (+10%) | 14mo | $285,950 | $186 | 51 |
| 4607 Christopher St | 0.49mi | 3/2.0 | 1,535 (+10%) | 16mo | $281,950 | $184 | 48 |
Match score weights: distance 35% · size 25% · config 20% · recency 20%. Top-matched comps best support the ARV.
Projected returns pro-forma
-0.45% appreciation · 3.0% rent growth · sell at horizon
- IRR
- -7.0%
- Equity multiple
- 0.68×
- Total profit
- $-18,031
- Equity at exit
- $54,293
- IRR
- -0.7%
- Equity multiple
- 0.93×
- Total profit
- $-3,891
- Equity at exit
- $61,767
Cash invested: $56,700 (down + closing). Projections, not guarantees.
Landlord ↔ Tenant lean methodology
- Overall (STATE)
- 87 Strongly Landlord-Friendly
- State Texas
- 87 Strongly Landlord-Friendly · R+5
- County
- — inherits STATE
- City
- — inherits STATE
ZIP-level market 78211
- Home prices YoY
- -0.2%
- Active inventory
- 152
- Price-to-rent
- 10.5×
Monthly cashflow live
- Estimated rent
- $1,615 high interval (Pro) →
- Mortgage (P&I)
- −$1,062
- Tax est. 1.5%
- −$253 /mo · $3,037/yr
- Insurance
- −$84
- HOA
- −$0
- Vacancy / Maint / Mgmt
- −$339
- Net cashflow
- $-124
Break-even live
UW: 25.0% down · 7.5% · 30yr · 1.5% tax · 5.0% vac · 8.0% maint · 8.0% mgmt
Financing live
Cash to close
- Down payment
- $50,625
- Closing costs
- $6,075
- Reserves months
- —
- Total cash needed
- —
Loan-product check · same deal, 3 products live
Conventional
25% down · 7.5% · 30yr
- Down + closing
- —
- Monthly P&I
- —
- Monthly cashflow
- —
- DSCR
- —
- Eligible?
- —
Personal DTI + credit; lowest rate.
DSCR
20% down · 8.5% · 30yr
- Down + closing
- —
- Monthly P&I
- —
- Monthly cashflow
- —
- DSCR
- —
- Eligible?
- —
No personal income docs; deal must DSCR.
Hard money
10% down · 12.0% · 12mo
- Down + closing
- —
- Monthly P&I
- —
- Monthly cashflow
- —
- DSCR
- —
- Eligible?
- —
Short-term bridge; refi at stabilization.
Rent comps 26 comps
| Address | Beds | Baths | Sqft | Rent | $/sqft | DOM | Units | Dist |
|---|---|---|---|---|---|---|---|---|
| 6818 Fort Bnd San Antonio, TX | 3.0 | 2.0 | 1866 | $1,895 | $1.02 | 23d | 1 | 0.19mi |
| 4534 Zoe Pass San Antonio, TX | 4.0 | 2.0 | 1492 | $1,625 | $1.09 | 20d | 1 | 0.37mi |
| 4534 Zoe Pass San Antonio, TX | 4.0 | 2.0 | 1492 | $1,625 | $1.09 | 23d | 1 | 0.37mi |
| 4407 Grassland Pass San Antonio, TX | 4.0 | 2.0 | 1500 | $1,597 | $1.06 | 4d | 1 | 0.43mi |
| 4442 Grassland Pass San Antonio, TX | 4.0 | 2.0 | 1492 | $1,685 | $1.13 | 4d | 1 | 0.44mi |
| 6334 Marco Plns San Antonio, TX | 4.0 | 2.0 | 1635 | $1,695 | $1.04 | 4d | 1 | 0.45mi |
| 4443 Glades Way San Antonio, TX | 3.0 | 2.0 | 1450 | $1,395 | $0.96 | 43d | 1 | 0.54mi |
| 4518 Emma Way San Antonio, TX | 4.0 | 2.0 | 1635 | $1,540 | $0.94 | 43d | 1 | 0.56mi |
| 7246 Meadow Acres San Antonio, TX | 3.0 | 2.0 | 1450 | $1,470 | $1.01 | 23d | 1 | 0.60mi |
| 7722 Blue Gulf Dr San Antonio, TX | 3.0 | 2.0 | 1464 | $1,575 | $1.08 | 23d | 1 | 0.64mi |
| 3903 SE Military Dr San Antonio, TX | 1.0–3.0 | 1.0–2.0 | 942 | $1,364 | $1.45 | 21d | 10 | 0.66mi |
| 7814 Annex St San Antonio, TX | 3.0 | 2.0 | 1459 | $1,600 | $1.10 | 23d | 1 | 0.75mi |
| 4011 Anton Dr San Antonio, TX | 3.0 | 2.0 | 1269 | $1,500 | $1.18 | 43d | 1 | 0.90mi |
| 4155 Freestone St San Antonio, TX | 4.0 | 2.0 | 1259 | $1,495 | $1.19 | 4d | 1 | 1.12mi |
| 4155 Freestone St San Antonio, TX | 4.0 | 2.0 | 1259 | $1,495 | $1.19 | 23d | 1 | 1.12mi |
| 7818 Shetland Dr Unit 102 San Antonio, TX | 3.0 | 2.5 | 1225 | $1,395 | $1.14 | 21d | 1 | 1.13mi |
| 7818 Shetland Dr San Antonio, TX | 3.0 | 2.5 | 1380 | $1,475 | $1.07 | 43d | 2 | 1.13mi |
| 7818 Shetland Dr San Antonio, TX | 3.0 | 2.5 | 1380 | $1,550 | $1.12 | 23d | 2 | 1.13mi |
| 7818 Shetland Dr Unit 101 San Antonio, TX | 3.0 | 2.5 | 1225 | $1,475 | $1.20 | 43d | 1 | 1.13mi |
| 3814 Gayle Ave San Antonio, TX | 4.0 | 2.0 | 1686 | $2,100 | $1.25 | 17d | 1 | 1.15mi |
| 4103 Freestone St San Antonio, TX | 4.0 | 2.0 | 1195 | $1,800 | $1.51 | 23d | 1 | 1.19mi |
| 3526 Manoway Bay San Antonio, TX | 3.0 | 2.0 | 1459 | $1,700 | $1.17 | 21d | 1 | 1.24mi |
| 3618 Booker Trl San Antonio, TX | 3.0 | 2.0 | 1217 | $1,475 | $1.21 | 43d | 1 | 1.24mi |
| 3514 Booker Trl San Antonio, TX | 4.0 | 2.0 | 1667 | $4,000 | $2.40 | 1d | 1 | 1.25mi |
| 7035 Pickwell Dr San Antonio, TX | 1.0–3.0 | 1.0–2.0 | 953 | $1,769 | $1.86 | 3d | 32 | 1.31mi |
| 4430 Valleyfield Dr San Antonio, TX | 2.0 | 1.5 | 1444 | $1,150 | $0.80 | 43d | 1 | 1.37mi |
Listing history 10 events
-
2026-06-18days on market $202,499 Active 12 DOM
-
2026-06-17days on market $202,499 Active 11 DOM
-
2026-06-16days on market $202,499 Active 10 DOM
-
2026-06-15days on market $202,499 Active 9 DOM
-
2026-06-13pricedays on market $202,499 Active 7 DOM
-
2026-06-09days on market $201,499 Active 3 DOM
-
2026-06-08days on market $201,499 Active 2 DOM
-
2026-06-08price $201,499 Active 1 DOM
-
2026-06-07remarks 419-char remark
-
2026-06-07$221,499 Active 1 DOM
ⓘ Source: listings_history table (triggers on properties + properties_extension) + one-shot
backfill from property_details.listing_events for pre-trigger history.
Nearby sold comps map
Loading sold comps map…
Walkable amenities ~0.75 mi
Loading nearby amenities…
Taxation est. · year 1
- Rental income
- $19,374
- − Mortgage interest
- −$11,343
- − Property taxes
- −$3,037
- − Insurance
- −$1,012
- − Repairs & maintenance
- −$1,550
- − Management
- −$1,550
- − Depreciation
- −$5,891
- Taxable loss
- −$5,010
- Est. tax savings @ 24.0%
- +$1,202
- After-tax cash flow
- $-285/yr
For passive investors: Depreciation is non-cash, so a rental often shows a tax loss while cash-flowing — sheltering income. Rental losses are passive: they offset passive income freely, and up to $25,000/yr can offset ordinary (W-2) income if you actively participate and your MAGI is under $100k (phasing out to $0 by $150k); unused losses carry forward. On sale, claimed depreciation is recaptured at up to 25%, and gains may owe capital-gains tax (a 1031 exchange can defer both). Figures are a year-1 estimate at your 24.0% rate — not tax advice; consult a CPA.
Condition & rehab AI · 12 photos
This single-level home is in good condition with a modern and well-maintained interior and exterior. It has a spacious open floorplan and a private owner's suite. The home is ready for a new owner and can be further enhanced with minor updates to increase its value.
Value-add opportunities
- Both Painting the exterior and interior walls — Fresh paint can enhance curb appeal and interior aesthetics
- Both Updating the flooring in the living areas — New flooring can improve the overall look and feel of the home
- Both Upgrading the kitchen appliances — Modern appliances can increase the home's appeal and functionality
- Both Adding smart home features — Smart home features can increase the home's value and convenience
Renovation cost estimate screening
Value-add ROI direction
- Both Painting the exterior and interior walls — Fresh paint can enhance curb appeal and interior aesthetics ↑
- Both Updating the flooring in the living areas — New flooring can improve the overall look and feel of the home ↑
- Both Upgrading the kitchen appliances — Modern appliances can increase the home's appeal and functionality ↑
- Both Adding smart home features — Smart home features can increase the home's value and convenience ↑
ⓘ Cost ranges are severity-bucket heuristics (US national rule-of-thumb). Get contractor quotes + a written scope before underwriting a rehab budget.
Schools (NCES district)
- District
- East Central ISD
- NCES district ID
- 4817850
- Math proficiency
- 16% ▼ -12.00%
- Reading proficiency
- 25% ▼ -6.00%
- Median HH income
- $53,941
- Composite
- 18.67/100
- National rank
- #8887
- State rank
- #758 of 826 in TX
Livability — San Antonio
- Score
- 80/100
- State rank
- #31
- US rank
- #1616
Category grades
Schools grade is shown separately in the Schools card above.
Census & demographics
- Census place
- San Antonio, TX
- County
- Bexar County · 1,990,555 people
- City population
- 1,806,925
- Metro
- San Antonio-New Braunfels, TX
- Population (ZIP)
- 30,857
- Household income
- $55,436
- Rent vs Own
- Severe rent burden
- 729.0
Population outlook (Bexar County) Hauer SSP2
- Today (2025)
- 2,336,851 people
- By 2030
- 2,560,728 · +9.6%
- By 2040
- 3,020,569 · +29.3%
- By 2050
- 3,493,522 · +49.5%
- By 2075
- 4,668,459 · +99.8%
- By 2100
- 5,533,242 · +136.8%
Race, ethnicity, and origin ACS 2023
- Neighborhood character
- Predominantly Hispanic (93%)
- Race & ethnicity
- Hispanic / Latino 93% Two or more races 30% White 5% Black 1% Native American 1%
- Hispanic origin (detail)
- Mexican 76%
- Foreign-born
- 18% · Canada
- Languages at home
- 35% English-only · Spanish 65%
Political lean MEDSL · Bexar
- 2024 margin
- Lean D (+9.8) · D 54.3% · R 44.6% · Other 1.1%
- 2008→2024 swing
- +4.2pp toward D · 2008: 5.6pp · 2024: 9.8pp
- All cycles
- 2024: D+9.8 2020: D+18.2 2016: D+13.5 2012: D+4.6 2008: D+5.6
Not yet ingested
- Civics
- —
Market trends
- HPI YoY
- ▼ -0.45%
- Current HPI
- 241.1709
- Rent YoY
- —
- Metro
- San Antonio-New Braunfels, TX
- State GDP YoY
- ▲ 3.95%
- F500 in state
- 110
Industry mix (Fortune 500 HQ in TX)
| Industry | F500 HQs | Revenue |
|---|---|---|
| Energy | 16 | $1,198B |
|
||
| Technology | 5 | $198B |
|
||
| Engineering / Construction | 4 | $72B |
|
||
| Energy Services | 3 | $60B |
|
||
| Utilities | 3 | $41B |
|
||
| Healthcare | 2 | $330B |
|
||
Cash-flow waterfall
monthlySold comps — $/sqft
last 12 mo · ≤1 miLoading sold comps…