10527 Meadow Saffron Dr · Houston, TX
Flood risk 5/10 · Moderate
- FEMA flood zone
- X (unshaded)
- Chance of flooding over 30 yrs
- 0.66%
- Est. flood insurance / yr
- $507 – $1,088
Fire risk 4/10 · Minor
- Est. fire insurance / yr
- $1,222 – $2,270
Heat risk 9/10 · Severe
- Hot days now (above 110°F)
- 7 days/yr
- Hot days in 30 yrs
- 22 days/yr
Wind risk 9/10 · Severe
- Chance of severe wind over 30 yrs
- 99.0%
Air-quality risk 3/10 · Minor
- Unhealthy air days now
- 3 days/yr
- Unhealthy air days in 30 yrs
- 3 days/yr
Risk factors via First Street. Map © Google.
Why this score? — see what drove the D grade
The composite is a weighted blend of 9 inputs, each scored 0–100. Each bar is that input's sub-score; the figure is the points it added to the 100-point composite (weight × sub-score).
- ARV discount +9.8/15.0
- Appreciation +9.3/10.0
- Cash flow +5.6/30.0
- Condition / age +4.0/5.0
- Livability +3.7/5.0
- 1% rule +2.9/10.0
- Schools +2.7/10.0
- Rent growth +2.6/5.0
- DSCR +0.0/10.0
$228,899
🖨 Deal sheet (PDF) 📄 Offer letter ✓ Due diligence
Listing remarks MLS
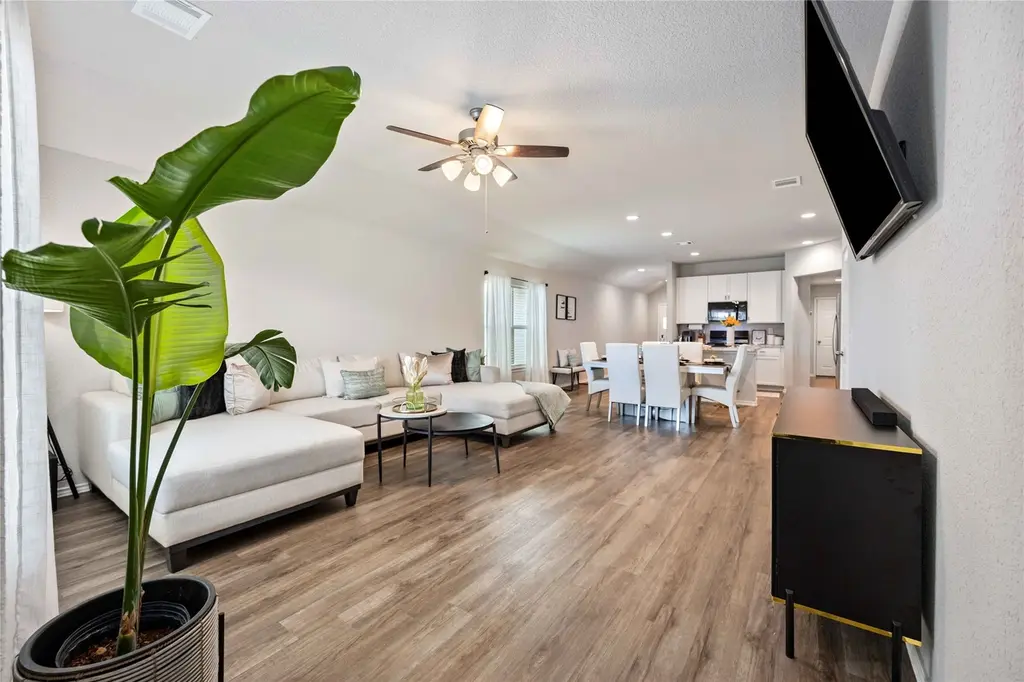
Welcome to the community of Wayside Village located in the vibrant Eastside of Houston. This home includes comfort and convenience with 3 bedrooms and 2 bathrooms. Just 20 minutes from Downtown Houston and the new East River Mixed-Use commercial and residential development. Offering a gourmet kitchen that is bathed in natural light—ideal for both morning coffee and culinary adventures. The open-concept living spaces are perfect for entertaining and everyday living, creating a seamless flow throughout the home. Each bedroom serves as a private retreat for relaxation. The outdoor patio is an inviting space for al fresco dining, social gatherings, or quiet stargazing evenings. Strategically situated with easy access to I-59, 610 Loop, and Beltway 8, this home positions you perfectly to take advantage of all that Houston has to offer. You're not just finding a place to live—you're finding a place to thrive. Schedule your showing today!
Key facts
- Gourmet kitchen
- Easy access to i-59
- Outdoor patio
Tags
Neighborhood map
What this means for you Summary
Snapshot
- This is a 3-bed/2.5-bath single-family listed at $229k. Condition is rated good.
Deal economics
- At list price, monthly cash flow is $-480 ($-6k/yr) — negative.
- To cash-flow at today's rent, offer at most $144k (37.1% below list).
- To meet the 1% rule (rent ≥ 1% of price), the offer needs to be $181k (20.9% below list).
- Recommended offer: $144k (37.1% below list) — sets the bar for cash-flow.
Location & tenants
- Location reads 74/100 on livability (#184 in TX, #4,771 nationally) — a middle-class / working-renter tenant base. Strengths: amenities A+, cost of living A+, housing A+; Watch: schools D, crime F.
- Houston ISD (urban): math 27% / reading 35% proficiency, ranked #593 of 826 in TX (top 72%) — families likely to look elsewhere, expect single-tenant / working-renter base with shorter leases; 71% free/reduced lunch — lower-income household profile, screen leases tightly.
- Market conditions: Rents flat; 376 active listings in the ZIP; 36 comparable units currently listed for rent nearby; rentals at typical pace (median 26d on market — plan ~3-4 weeks tenant-placement turnaround); 44% of comp listings sitting > 30 days — soft ceiling on asking rent; 29,883 units permitted in Harris County in 2024 (8,621 in 5+ unit buildings).
- At $1,810/mo this rent would consume 46% of the median local household income ($48k/yr) (locally 1297% of renters already pay >50% of income on rent) — very limited rent-growth headroom before tenants either downsize or default.
Forward outlook
- In year one you build about $21k of equity ($2k loan paydown + $20k appreciation (8.7% local appreciation)).
- Harris County population projected at +47% by 2050 — long-run rental-demand tailwind backs the buy-and-hold thesis.
- By year 2, paydown + projected appreciation supports a ~$34k cash-out refi (75% LTV) — recoverable capital for the next deal without selling this one.
Negotiation context
- It's been on market 67 days — a 6% lower offer ($215k) is reasonable based on typical stale-listing flexibility.
- 9 sale attempts since 2y ago with the ask held roughly flat each time — persistent listings suggest the price (not the market) is what's stuck; bring a comps-based counter.
Risks & watch-outs
- Watch-outs: property tax is 3.0% of price.
- Climate carrying-cost: moderate flood risk; severe wind risk, 99% chance of damaging wind over 30y; extreme-heat days projected 7→22/yr by 2055 (HVAC capex compounding) — expect insurance premiums to compound above CPI over the hold.
Questions for the listing agent
- What do current leases actually rent for vs. the listed asking? Can we see a recent rent roll and the last 12 months of T-12 income?
- It's been on market 67 days. Have you received any prior offers? Is the seller open to a 37% concession, seller financing, or rate buy-down credit?
- Property tax is high relative to price — has the assessment been appealed recently, and will the sale trigger a re-assessment?
- What does the HOA fee cover, when was the last increase, and are there any pending special assessments or reserve-fund shortfalls?
- Why hasn't it sold? Are there any deal-killer items the seller is aware of (foundation, flood, title, zoning, code violations)?
- Is there a deadline driving the sale (1031 exchange, divorce, estate, relocation)? That informs how much negotiation room exists.
- Schools are D-rated, which usually means shorter tenancies and higher turnover. Who's the typical renter profile here, and what's been the actual vacancy rate?
- Crime grade is F in this area — have there been break-ins, vandalism, or insurance claims at this property in the last 3 years? What carrier currently insures it and at what premium?
- The area grade is low — what's the realistic commute time and amenity access for the typical tenant pool here? Any planned neighborhood developments (good or bad) we should know about?
- What's the average days-on-market for RENTAL listings here right now (not sales)? A rising rental-DOM trend means longer vacancies and softer asking-rent achievability than the comps imply.
- What's the recent tenant-quality profile in this submarket — average credit score on applications, eviction rate, late-payment / NSF rate, and stable-employment percentage? A property-management company in the area should have these aggregated.
- How much new for-sale + rental construction is in the pipeline within 1–3 miles? Heavy new supply typically softens prices + rents 12–24 months out; constrained supply supports both.
Investment metrics
- 1% rule
- 0.79% ✗
- Cap rate
- 3.78%
- Cash-on-cash
- -8.99%
- DSCR
- 0.60
- GRM
- 10.5
CMA / ARV
- ARV (median comp)
- $241,341
- List price
- $228,899
- Delta
- -5.16%
- Verdict
- FAIR
- Comps
- 20 within 1.0 mi
Show comp detail 12 sales within ~0.75 mi
| Address | Dist | Beds/Ba | Sqft | Sold | Price | $/sf | Match |
|---|---|---|---|---|---|---|---|
| 10315 Vinca Minor Ln | 0.16mi | 3/2.0 | 1,412 (+0%) | 1mo | $276,240 | $196 | 88 |
| 7902 Elowen Grove Dr | 0.17mi | 3/2.0 | 1,412 (+0%) | 2mo | $277,290 | $196 | 88 |
| 7914 Cassie Pine Dr | 0.22mi | 3/2.0 | 1,401 (-0%) | 0mo | $274,290 | $196 | 87 |
| 7904 Cassie Pine Dr | 0.22mi | 3/2.0 | 1,412 (+0%) | 0mo | $281,040 | $199 | 87 |
| 7918 Cassie Pine Dr | 0.23mi | 3/2.0 | 1,412 (+0%) | 0mo | $278,290 | $197 | 86 |
| 10643 Red Orchid Dr | 0.19mi | 4/2.0 (+1) | 1,409 (+0%) | 2mo | $240,000 | $170 | 82 |
| 8206 Vanilla Orchid Dr | 0.28mi | 3/2.0 | 1,260 (-10%) | 0mo | $264,900 | $210 | 68 |
| 8124 Burnt Orchid Dr | 0.24mi | 3/2.0 | 1,571 (+12%) | 1mo | $279,900 | $178 | 67 |
| 8207 Burnt Orchid Dr | 0.26mi | 3/2.0 | 1,571 (+12%) | 1mo | $279,900 | $178 | 66 |
| 7705 Yoe St | 0.57mi | 4/2.0 (+1) | 1,388 (-1%) | 3mo | $90,000 | $65 | 62 |
| 7630 Yoe St | 0.63mi | 3/2.0 | 1,300 (-8%) | 2mo | $239,000 | $184 | 54 |
| 7706 Tully Ave | 0.41mi | 3/2.0 | 1,600 (+14%) | 2mo | $300,000 | $188 | 54 |
Match score weights: distance 35% · size 25% · config 20% · recency 20%. Top-matched comps best support the ARV.
Projected returns pro-forma
8.65% appreciation · 0.44% rent growth · sell at horizon
- IRR
- 14.0%
- Equity multiple
- 2.08×
- Total profit
- $68,975
- Equity at exit
- $184,098
- IRR
- 13.4%
- Equity multiple
- 4.36×
- Total profit
- $215,601
- Equity at exit
- $375,611
Cash invested: $64,092 (down + closing). Projections, not guarantees.
Landlord ↔ Tenant lean methodology
- Overall (STATE)
- 87 Strongly Landlord-Friendly
- State Texas
- 87 Strongly Landlord-Friendly · R+5
- County
- — inherits STATE
- City
- — inherits STATE
ZIP-level market 77016
- Home prices YoY
- 2.8%
- Rents YoY
- 0.4%
- Active inventory
- 376
- Price-to-rent
- 10.5×
Monthly cashflow live
- Estimated rent
- $1,810 high interval (Pro) →
- Mortgage (P&I)
- −$1,200
- Tax from tax record
- −$577 /mo · $6,920/yr
- Insurance
- −$95
- HOA
- −$38
- Vacancy / Maint / Mgmt
- −$380
- Net cashflow
- $-480
Break-even live
Sensitivity live
| Price | -10% $-351 | -5% $-415 | +0% $-480 | +5% $-545 | +10% $-610 |
|---|---|---|---|---|---|
| Rent | -10% $-623 | -5% $-552 | +0% $-480 | +5% $-409 | +10% $-337 |
| Rate | -1.0pp $-365 | -0.5pp $-422 | base $-480 | +0.5pp $-540 | +1.0pp $-600 |
UW: 25.0% down · 7.5% · 30yr · 1.5% tax · 5.0% vac · 8.0% maint · 8.0% mgmt
Financing live
Cash to close
- Down payment
- $57,225
- Closing costs
- $6,867
- Reserves months
- —
- Total cash needed
- —
Loan-product check · same deal, 3 products live
Conventional
25% down · 7.5% · 30yr
- Down + closing
- —
- Monthly P&I
- —
- Monthly cashflow
- —
- DSCR
- —
- Eligible?
- —
Personal DTI + credit; lowest rate.
DSCR
20% down · 8.5% · 30yr
- Down + closing
- —
- Monthly P&I
- —
- Monthly cashflow
- —
- DSCR
- —
- Eligible?
- —
No personal income docs; deal must DSCR.
Hard money
10% down · 12.0% · 12mo
- Down + closing
- —
- Monthly P&I
- —
- Monthly cashflow
- —
- DSCR
- —
- Eligible?
- —
Short-term bridge; refi at stabilization.
Rent comps 36 comps
| Address | Beds | Baths | Sqft | Rent | $/sqft | DOM | Units | Dist |
|---|---|---|---|---|---|---|---|---|
| 10474 Red Orchid Dr Houston, TX | 3.0 | 2.5 | 1553 | $1,875 | $1.21 | 25d | 1 | 0.12mi |
| 10708 Lavender Cotton Ln Houston, TX | 3.0 | 2.0 | 1406 | $2,150 | $1.53 | 45d | 1 | 0.17mi |
| 8003 Alpine Bearberry Dr Houston, TX | 3.0–4.0 | 2.0–2.5 | 1696 | $2,000 | $1.18 | 9d | 1 | 0.25mi |
| 7726 Spinet St Houston, TX | 4.0 | 2.0 | 1456 | $2,375 | $1.63 | 9d | 1 | 0.31mi |
| 10314 Woodwick St Unit 1283919P Houston, TX | 3.0 | 2.5 | 1496 | $3,865 | $2.58 | 0d | 1 | 0.33mi |
| 8214 Parker Rd Unit B Houston, TX | 3.0 | 2.0 | 1608 | $1,560 | $0.97 | 9d | 1 | 0.56mi |
| 8102 Rhobell St Unit A Houston, TX | 4.0 | 3.5 | 1567 | $1,750 | $1.12 | 45d | 1 | 0.59mi |
| 10750 Nyla Spring St Houston, TX | 3.0 | 2.0 | 1500 | $1,975 | $1.32 | 20d | 1 | 0.63mi |
| 8213 Bigwood St Unit A Houston, TX | 3.0 | 2.5 | 1150 | $1,595 | $1.39 | 45d | 1 | 0.74mi |
| 8314 Madera Rd Unit B Houston, TX | 3.0 | 2.5 | 1608 | $1,495 | $0.93 | 25d | 1 | 0.76mi |
| 6822 Leedale St Houston, TX | 3.0 | 1.0 | 978 | $1,500 | $1.53 | 45d | 1 | 0.77mi |
| 8122 Sterlingshire St Unit B Houston, TX | 3.0 | 2.0 | 1160 | $1,450 | $1.25 | 16d | 1 | 0.77mi |
| 8122 Sterlingshire St Unit A Houston, TX | 3.0 | 2.0 | 1160 | $1,525 | $1.31 | 16d | 1 | 0.77mi |
| 8302 Caddo Rd Houston, TX | 2.0 | 1.0 | 896 | $1,450 | $1.62 | 45d | 1 | 0.78mi |
| 8126 Sterlingshire St Unit B Houston, TX | 3.0 | 2.0 | 1150 | $1,350 | $1.17 | 25d | 1 | 0.78mi |
| 7325 Boggess Rd Houston, TX | 3.0 | 2.0 | 1568 | $1,850 | $1.18 | 18d | 1 | 0.78mi |
| 7325 Boggess Rd Houston, TX | 3.0 | 2.0 | 1568 | $1,850 | $1.18 | 45d | 1 | 0.78mi |
| 7314 Saunders Rd Houston, TX | 4.0 | 2.0 | 1339 | $1,723 | $1.29 | 15d | 1 | 0.86mi |
| 6823 Hanley Ln Houston, TX | 3.0 | 2.0 | 1303 | $1,610 | $1.24 | 6d | 1 | 0.87mi |
| 7223 Valmont Dr Houston, TX | 4.0 | 2.0 | 1546 | $1,595 | $1.03 | 45d | 1 | 0.93mi |
| 7252 Parker Rd Houston, TX | 3.0 | 1.0 | 916 | $1,650 | $1.80 | 45d | 1 | 0.95mi |
| 8235 Locksley Rd Unit A Houston, TX | 3.0 | 2.5 | 1608 | $1,525 | $0.95 | 9d | 1 | 0.98mi |
| 9550 N Wayside Dr Houston, TX | 1.0–3.0 | 1.0–2.0 | 896 | $1,399 | $1.56 | 2d | 5 | 1.02mi |
| 7176 Parker Rd Houston, TX | 4.0 | 2.0 | 1152 | $1,200 | $1.04 | 45d | 1 | 1.11mi |
| 9702 Hillis St Houston, TX | 3.0 | 2.0 | 1612 | $1,550 | $0.96 | 45d | 1 | 1.23mi |
| 8346 Tidwell Rd Unit B Houston, TX | 3.0 | 2.0 | 980 | $1,000 | $1.02 | 45d | 1 | 1.24mi |
| 8350 Tidwell Rd Unit A Houston, TX | 3.0 | 2.0 | 980 | $975 | $0.99 | 45d | 1 | 1.25mi |
| 10221 Bretton Dr Houston, TX | 3.0 | 1.0 | 1350 | $1,700 | $1.26 | 25d | 1 | 1.32mi |
| 7201 Hallshire Dr Unit 235 Houston, TX | 3.0 | 1.0 | 1100 | $850 | $0.77 | 45d | 1 | 1.33mi |
| 7201 Hallshire Dr Houston, TX | 2.0 | 1.0 | 985 | $740 | $0.75 | 45d | 1 | 1.33mi |
| 7201 Hallshire Dr Unit 222 Houston, TX | 2.0 | 1.0 | 985 | $700 | $0.71 | 45d | 1 | 1.34mi |
| 11235 Lemond Dr Houston, TX | 3.0 | 1.0 | 1368 | $1,450 | $1.06 | 23d | 1 | 1.34mi |
| 8006 Lynette St Houston, TX | 3.0 | 1.0 | 1400 | $1,475 | $1.05 | 25d | 1 | 1.40mi |
| 9410 Firnat St Unit A Houston, TX | 3.0 | 2.5 | 1500 | $1,900 | $1.27 | 0d | 1 | 1.47mi |
| 9410 Firnat St Unit B Houston, TX | 3.0 | 2.5 | 1500 | $1,900 | $1.27 | 45d | 1 | 1.47mi |
| 9700 Mesa Dr Houston, TX | 1.0–3.0 | 1.0–2.0 | 784 | $989 | $1.26 | 0d | 9 | 1.47mi |
HOA detail
- Monthly dues
- $38 · $456/yr
Listing history 29 events
-
2026-06-21days on market $228,899 Active 67 DOM
-
2026-06-18days on market $228,899 Active 64 DOM
-
2026-06-17days on market $228,899 Active 63 DOM
-
2026-06-16days on market $228,899 Active 62 DOM
-
2026-06-15days on market $228,899 Active 61 DOM
-
2026-06-13days on market $228,899 Active 59 DOM
-
2026-06-10days on market $228,899 Active 55 DOM
-
2026-06-08days on market $228,899 Active 54 DOM
-
2026-06-07days on market $228,899 Active 53 DOM
-
2026-06-04days on market $228,899 Active 50 DOM
-
2026-06-01days on market $228,899 Active 47 DOM
-
2026-05-31days on market $228,899 Active 46 DOM
-
2026-05-02status Active 957-char remark
Show marketing remark (957 chars)
Welcome to the community of Wayside Village located in the vibrant Eastside of Houston. This home includes comfort and convenience with 3 bedrooms and 2 bathrooms. Just 20 minutes from Downtown Houston and the new East River Mixed-Use commercial and residential development. Offering a gourmet kitchen that is bathed in natural light—ideal for both morning coffee and culinary adventures. The open-concept living spaces are perfect for entertaining and everyday living, creating a seamless flow throughout the home. Each bedroom serves as a private retreat for relaxation. The outdoor patio is an inviting space for al fresco dining, social gatherings, or quiet stargazing evenings. Strategically situated with easy access to I-59, 610 Loop, and Beltway 8, this home positions you perfectly to take advantage of all that Houston has to offer. You're not just finding a place to live—you're finding a place to thrive. Schedule your showing today!
-
2026-04-30historical 957-char remark
Show marketing remark (957 chars)
Welcome to the community of Wayside Village located in the vibrant Eastside of Houston. This home includes comfort and convenience with 3 bedrooms and 2 bathrooms. Just 20 minutes from Downtown Houston and the new East River Mixed-Use commercial and residential development. Offering a gourmet kitchen that is bathed in natural light—ideal for both morning coffee and culinary adventures. The open-concept living spaces are perfect for entertaining and everyday living, creating a seamless flow throughout the home. Each bedroom serves as a private retreat for relaxation. The outdoor patio is an inviting space for al fresco dining, social gatherings, or quiet stargazing evenings. Strategically situated with easy access to I-59, 610 Loop, and Beltway 8, this home positions you perfectly to take advantage of all that Houston has to offer. You're not just finding a place to live—you're finding a place to thrive. Schedule your showing today!
-
2026-04-14$228,899 Active 957-char remark
Show marketing remark (957 chars)
Welcome to the community of Wayside Village located in the vibrant Eastside of Houston. This home includes comfort and convenience with 3 bedrooms and 2 bathrooms. Just 20 minutes from Downtown Houston and the new East River Mixed-Use commercial and residential development. Offering a gourmet kitchen that is bathed in natural light—ideal for both morning coffee and culinary adventures. The open-concept living spaces are perfect for entertaining and everyday living, creating a seamless flow throughout the home. Each bedroom serves as a private retreat for relaxation. The outdoor patio is an inviting space for al fresco dining, social gatherings, or quiet stargazing evenings. Strategically situated with easy access to I-59, 610 Loop, and Beltway 8, this home positions you perfectly to take advantage of all that Houston has to offer. You're not just finding a place to live—you're finding a place to thrive. Schedule your showing today!
-
2026-04-13historical
-
2026-04-01$2,100
-
2026-03-31historical $2,100
-
2026-03-30$228,899 Active
-
2026-03-30historical
-
2026-03-17$2,100
-
2026-03-16$228,899 Active
-
2024-09-16historical
-
2024-09-14historical $2,400
-
2024-08-03price $2,400
-
2024-07-31$2,650
-
2024-07-23status Active
-
2024-07-11$260,000
-
2024-06-25historical
ⓘ Source: listings_history table (triggers on properties + properties_extension) + one-shot
backfill from property_details.listing_events for pre-trigger history.
Tax reassessment forecast TX · Resets to sale price
- Current annual tax
- $6,920 · $577/mo
- Projected year-2 tax
- $6,920 · $577/mo
- Expected delta
- $0/yr ($0/mo · 0.0%)
ⓘ Screening estimate from a state-policy table — verify with the county assessor before closing.
Climate risk First Street
- Flood 5/10 Major FEMA zone X (unshaded) · 66% chance over 30 yrs
- Wildfire 4/10 Moderate
- Heat 9/10 Extreme 7 d/yr ≥110°F today · 22 d/yr by 30 yrs out
- Wind 9/10 Extreme 99% chance of damaging wind over 30 yrs
- Air quality 3/10 Moderate 3 unhealthy d/yr today · 3 by 30 yrs out
Nearby sold comps map
Loading sold comps map…
Walkable amenities ~0.75 mi
Loading nearby amenities…
Taxation est. · year 1
- Rental income
- $21,724
- − Mortgage interest
- −$12,822
- − Property taxes
- −$6,920
- − Insurance
- −$1,144
- − Repairs & maintenance
- −$1,738
- − Management
- −$1,738
- − HOA
- −$456
- − Depreciation
- −$6,659
- Taxable loss
- −$9,753
- Est. tax savings @ 24.0%
- +$2,341
- After-tax cash flow
- $-3,422/yr
For passive investors: Depreciation is non-cash, so a rental often shows a tax loss while cash-flowing — sheltering income. Rental losses are passive: they offset passive income freely, and up to $25,000/yr can offset ordinary (W-2) income if you actively participate and your MAGI is under $100k (phasing out to $0 by $150k); unused losses carry forward. On sale, claimed depreciation is recaptured at up to 25%, and gains may owe capital-gains tax (a 1031 exchange can defer both). Figures are a year-1 estimate at your 24.0% rate — not tax advice; consult a CPA.
Condition & rehab AI · 12 photos
This home is in good condition with a modern and well-maintained interior and exterior. It has a good foundation and structure, and the HVAC system appears to be in good condition. The home is move-in ready and has a good resale and rental value. Consider painting the exterior and interior walls, landscaping improvements, updating light fixtures, adding smart home features, and upgrading the HVAC system to further increase its value.
Value-add opportunities
- Both Painting the exterior and interior walls — Fresh paint can enhance curb appeal and interior aesthetics.
- Both Landscaping improvements — A well-maintained yard can increase both resale and rental value.
- Both Updating light fixtures — Modern light fixtures can improve the home's curb appeal and interior aesthetics.
- Both Adding smart home features — Smart home features can increase the home's appeal and marketability.
- Both Upgrading the HVAC system — A more efficient HVAC system can improve comfort and energy efficiency, increasing both resale and rental value.
Renovation cost estimate screening
Value-add ROI direction
- Both Painting the exterior and interior walls — Fresh paint can enhance curb appeal and interior aesthetics. ↑
- Both Landscaping improvements — A well-maintained yard can increase both resale and rental value. ↑
- Both Updating light fixtures — Modern light fixtures can improve the home's curb appeal and interior aesthetics. ↑
- Both Adding smart home features — Smart home features can increase the home's appeal and marketability. ↑
- Both Upgrading the HVAC system — A more efficient HVAC system can improve comfort and energy efficiency, increasing both resale and rental value. ↑
ⓘ Cost ranges are severity-bucket heuristics (US national rule-of-thumb). Get contractor quotes + a written scope before underwriting a rehab budget.
Schools (NCES district)
- District
- Houston ISD
- NCES district ID
- 4823640
- Math proficiency
- 27% ▼ -18.00%
- Reading proficiency
- 35% ▼ -6.00%
- Median HH income
- $46,054
- Composite
- 26.63/100
- National rank
- #7173
- State rank
- #593 of 826 in TX
Livability — Houston
- Score
- 74/100
- State rank
- #184
- US rank
- #4771
Category grades
Schools grade is shown separately in the Schools card above.
Census & demographics
- Census place
- Houston, TX
- County
- Harris County · 4,702,590 people
- City population
- 3,226,434
- Metro
- Houston-The Woodlands-Sugar Land, TX
- Population (ZIP)
- 29,841
- Household income
- $47,677
- Rent vs Own
- Severe rent burden
- 1297.0
Population outlook (Harris County) Hauer SSP2
- Today (2025)
- 5,571,493 people
- By 2030
- 6,089,821 · +9.3%
- By 2040
- 7,142,806 · +28.2%
- By 2050
- 8,185,864 · +46.9%
- By 2075
- 10,574,329 · +89.8%
- By 2100
- 12,109,958 · +117.4%
Race, ethnicity, and origin ACS 2023
- Neighborhood character
- Majority Black (56%)
- Race & ethnicity
- Black 56% Hispanic / Latino 42% Two or more races 28%
- Hispanic origin (detail)
- Mexican 34%
- Foreign-born
- 18% · Canada
- Languages at home
- 61% English-only · Spanish 37%
Political lean MEDSL · Harris
- 2024 margin
- Lean D (+5.5) · D 52.0% · R 46.4% · Other 1.6%
- 2008→2024 swing
- +3.9pp toward D · 2008: 1.6pp · 2024: 5.5pp
- All cycles
- 2024: D+5.5 2020: D+13.3 2016: D+12.4 2012: D+0.1 2008: D+1.6
Not yet ingested
- Civics
- —
Market trends
- HPI YoY
- ▲ 8.65%
- Current HPI
- 315.6765
- Rent YoY
- ▲ 0.44%
- Metro
- Houston-The Woodlands-Sugar Land, TX
- State GDP YoY
- ▲ 3.95%
- F500 in state
- 110
Industry mix (Fortune 500 HQ in TX)
| Industry | F500 HQs | Revenue |
|---|---|---|
| Energy | 16 | $1,198B |
|
||
| Technology | 5 | $198B |
|
||
| Engineering / Construction | 4 | $72B |
|
||
| Energy Services | 3 | $60B |
|
||
| Utilities | 3 | $41B |
|
||
| Healthcare | 2 | $330B |
|
||
Price history
-12.0% since first listed17 events — show timeline
- 2026-05-02 Relisted — HARMLS
- 2026-04-30 Listing Removed — HARMLS
- 2026-04-14 Listed $228,899 HARMLS
- 2026-04-13 Listing Removed — HARMLS
- 2026-04-01 Listed for Rent $2,100 HARMLS
- 2026-03-31 Rental Removed $2,100 HARMLS
- 2026-03-30 Listing Removed — HARMLS
- 2026-03-30 Listed $228,899 HARMLS
- 2026-03-17 Listed for Rent $2,100 HARMLS
- 2026-03-16 Listed $228,899 HARMLS
- 2024-09-16 Listing Removed — HARMLS
- 2024-09-14 Rental Removed $2,400 HARMLS
- 2024-08-03 Price Changed $2,400 HARMLS
- 2024-07-31 Listed for Rent $2,650 HARMLS
- 2024-07-23 Relisted — HARMLS
- 2024-07-11 Listed $260,000 HARMLS
- 2024-06-25 Listing Removed — HARMLS
Property tax history
+204.3%/yrLatest (2025): $6,920 · +2.7% YoY. Source: county tax records.
Cash-flow waterfall
monthlySold comps — $/sqft
last 12 mo · ≤1 miLoading sold comps…