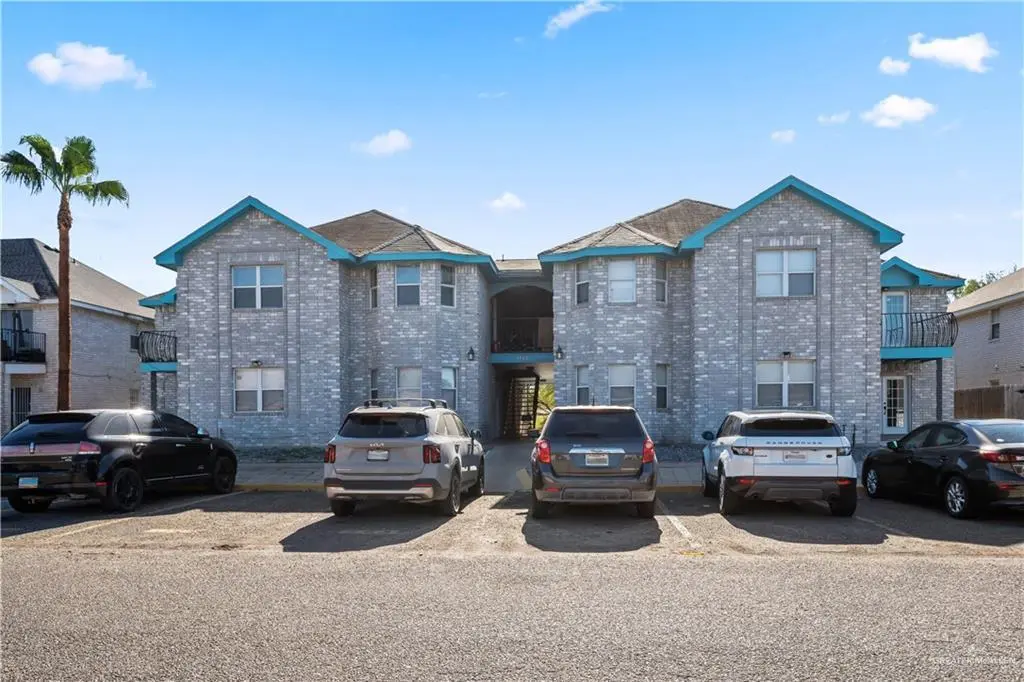
1802 Oasis Ave #207 · Mission, TX
Flood risk 1/10 · Minimal
- FEMA flood zone
- —
- Chance of flooding over 30 yrs
- 0.0%
- Est. flood insurance / yr
- —
Fire risk 5/10 · Moderate
- Est. fire insurance / yr
- $1,222 – $2,270
Heat risk 9/10 · Severe
- Hot days now (above 111°F)
- 7 days/yr
- Hot days in 30 yrs
- 22 days/yr
Wind risk 8/10 · Major
- Chance of severe wind over 30 yrs
- 94.0%
Air-quality risk 2/10 · Minimal
- Unhealthy air days now
- 1 days/yr
- Unhealthy air days in 30 yrs
- 2 days/yr
Risk factors via First Street. Map © Google.
Why this score? — see what drove the C+ grade
The composite is a weighted blend of 9 inputs, each scored 0–100. Each bar is that input's sub-score; the figure is the points it added to the 100-point composite (weight × sub-score).
- Cash flow +22.8/30.0
- ARV discount +15.0/15.0
- DSCR +7.3/10.0
- 1% rule +6.0/10.0
- Livability +3.8/5.0
- Condition / age +3.8/5.0
- Rent growth +2.7/5.0
- Schools +1.7/10.0
- Appreciation +0.0/10.0
$89,000
🖨 Deal sheet 📄 Offer letter ✓ Due diligence
Listing remarks MLS
Spacious 3 bedroom, 2 bathroom condo featuring an open living and dining area, functional kitchen, and well-sized bedrooms. Convenient layout with ample storage. Located in an established community with easy access to shopping, dining, and major roadways. Ideal for owner-occupants or investors.
Key facts
- Functional kitchen
- Ample storage
- Built 1998
Tags
Neighborhood map
What this means for you Summary
Snapshot
- This is a 2-bed/1.0-bath single-family listed at $89k. Condition is rated good.
Deal economics
- At list price, monthly cash flow is $155 ($2k/yr) — positive.
- The deal already cash-flows at list — no discount required.
- Meets the 1% rule at list price ($975 rent vs $89k).
- Recommended offer: $78k (12.0% below list) — sets the bar for market timing.
- Cap rate 8.4% vs local median 3.5% in Mission — top-decile yield for the area; either an underpriced asset or a hidden risk that comps aren't pricing in. Stress-test before assuming the spread holds.
Location & tenants
- Location reads 75/100 on livability (#148 in TX, #4,155 nationally) — a middle-class / working-renter tenant base. Strengths: cost of living A+, housing A+, health & safety A+; Watch: schools C-, amenities F, commute F.
- Mission CISD (urban): math 15% / reading 28% proficiency, ranked #775 of 826 in TX (top 94%) — low school quality limits family demand, transient renter base, plan for 1-2y turnover; 78% free/reduced lunch — lower-income household profile, screen leases tightly.
- Market conditions: Rents flat; 852 active listings in the ZIP; 11 comparable units currently listed for rent nearby; rentals at typical pace (median 24d on market — plan ~3-4 weeks tenant-placement turnaround); 45% of comp listings sitting > 30 days — soft ceiling on asking rent; 7,378 units permitted in Hidalgo County in 2024 (641 in 5+ unit buildings).
Forward outlook
- Local home prices are declining (-3.0%/yr); year-one equity from $615 of loan paydown is wiped out by about $3k of value loss. Plan a longer hold.
- Hidalgo County population projected at +28% by 2050 — long-run rental-demand tailwind backs the buy-and-hold thesis.
Negotiation context
- It's been on market 147 days — a 12% lower offer ($78k) is reasonable based on typical stale-listing flexibility.
- 5 sale attempts since 2y ago with the ask held roughly flat each time — persistent listings suggest the price (not the market) is what's stuck; bring a comps-based counter.
Risks & watch-outs
- Climate carrying-cost: severe wind risk, 94% chance of damaging wind over 30y; moderate wildfire risk; extreme-heat days projected 7→22/yr by 2055 (HVAC capex compounding) — expect insurance premiums to compound above CPI over the hold.
Questions for the listing agent
- It's been on market 147 days. Have you received any prior offers? Is the seller open to a 12% concession, seller financing, or rate buy-down credit?
- Why hasn't it sold? Are there any deal-killer items the seller is aware of (foundation, flood, title, zoning, code violations)?
- Is there a deadline driving the sale (1031 exchange, divorce, estate, relocation)? That informs how much negotiation room exists.
- What's the average days-on-market for RENTAL listings here right now (not sales)? A rising rental-DOM trend means longer vacancies and softer asking-rent achievability than the comps imply.
- What's the recent tenant-quality profile in this submarket — average credit score on applications, eviction rate, late-payment / NSF rate, and stable-employment percentage? A property-management company in the area should have these aggregated.
- How much new for-sale + rental construction is in the pipeline within 1–3 miles? Heavy new supply typically softens prices + rents 12–24 months out; constrained supply supports both.
Investment metrics
- 1% rule
- 1.10% ✓
- Cap rate
- 8.38%
- Cash-on-cash
- 7.47%
- DSCR
- 1.33
- GRM
- 7.6
CMA / ARV
- ARV (median comp)
- $141,183
- List price
- $89,000
- Delta
- -36.96%
- Verdict
- UNDERPRICED
- Comps
- 20 within 1.0 mi
Show comp detail 1 sale within ~0.75 mi
| Address | Dist | Beds/Ba | Sqft | Sold | Price | $/sf | Match |
|---|---|---|---|---|---|---|---|
| 2006 Lake Front Dr | 0.34mi | 2/2.0 | 904 (+1%) | 3mo | $167,000 | $185 | 76 |
Match score weights: distance 35% · size 25% · config 20% · recency 20%. Top-matched comps best support the ARV.
Projected returns pro-forma
-3.0% appreciation · 0.93% rent growth · sell at horizon
- IRR
- -7.2%
- Equity multiple
- 0.74×
- Total profit
- $-6,518
- Equity at exit
- $13,270
- IRR
- -0.5%
- Equity multiple
- 0.97×
- Total profit
- $-728
- Equity at exit
- $7,695
Cash invested: $24,920 (down + closing). Projections, not guarantees.
Landlord ↔ Tenant lean methodology
- Overall (STATE)
- 87 Strongly Landlord-Friendly
- State Texas
- 87 Strongly Landlord-Friendly · R+5
- County
- — inherits STATE
- City
- — inherits STATE
ZIP-level market 78572
- Home prices YoY
- -22.9%
- Rents YoY
- 0.9%
- Active inventory
- 852
- Price-to-rent
- 7.6×
Monthly cashflow live
- Estimated rent
- $975 high interval (Pro) →
- Mortgage (P&I)
- −$467
- Tax est. 1.5%
- −$111 /mo · $1,335/yr
- Insurance
- −$37
- HOA
- −$0
- Vacancy / Maint / Mgmt
- −$205
- Net cashflow
- $155
Break-even live
UW: 25.0% down · 7.5% · 30yr · 1.5% tax · 5.0% vac · 8.0% maint · 8.0% mgmt
Financing live
Cash to close
- Down payment
- $22,250
- Closing costs
- $2,670
- Reserves months
- —
- Total cash needed
- —
Loan-product check · same deal, 3 products live
Conventional
25% down · 7.5% · 30yr
- Down + closing
- —
- Monthly P&I
- —
- Monthly cashflow
- —
- DSCR
- —
- Eligible?
- —
Personal DTI + credit; lowest rate.
DSCR
20% down · 8.5% · 30yr
- Down + closing
- —
- Monthly P&I
- —
- Monthly cashflow
- —
- DSCR
- —
- Eligible?
- —
No personal income docs; deal must DSCR.
Hard money
10% down · 12.0% · 12mo
- Down + closing
- —
- Monthly P&I
- —
- Monthly cashflow
- —
- DSCR
- —
- Eligible?
- —
Short-term bridge; refi at stabilization.
Rent comps 11 comps
| Address | Beds | Baths | Sqft | Rent | $/sqft | DOM | Units | Dist |
|---|---|---|---|---|---|---|---|---|
| 1800 Oasis Dr Unit 101 Mission, TX | 2.0 | 1.0 | 905 | $725 | $0.80 | 23d | 1 | 0.00mi |
| 1804 Oasis Ave Mission, TX | 2.0 | 1.0 | 899 | $788 | $0.88 | 19d | 3 | 0.02mi |
| 1802 Oasis Dr Unit 202 Mission, TX | 2.0 | 1.0 | 893 | $850 | $0.95 | 43d | 1 | 0.02mi |
| 1525 Oasis Dr Unit 4 Mission, TX | 3.0 | 2.0 | 1100 | $825 | $0.75 | 14d | 1 | 0.12mi |
| 1605 W B St Mission, TX | 2.0 | 2.0 | 814 | $1,200 | $1.47 | 43d | 1 | 0.57mi |
| 1525 W B St Mission, TX | 2.0 | 2.0 | 852 | $1,350 | $1.58 | 19d | 1 | 0.57mi |
| 1513 W B St Mission, TX | 3.0 | 2.0 | 868 | $1,300 | $1.50 | 43d | 1 | 0.58mi |
| 1513 W B St Mission, TX | 3.0 | 2.0 | 868 | $1,300 | $1.50 | 14d | 1 | 0.58mi |
| 401 Bertha Ave Unit 3 Mission, TX | 2.0 | 2.0 | 1050 | $1,200 | $1.14 | 19d | 1 | 0.70mi |
| 401 Bertha Ave Unit 2 Mission, TX | 2.0 | 2.0 | 950 | $1,300 | $1.37 | 43d | 1 | 0.70mi |
| 1500 Industrial Way Unit A Mission, TX | 2.0 | 1.0 | 990 | $990 | $1.00 | 43d | 1 | 0.95mi |
Listing history 12 events
-
2026-06-02status $89,000 Pending 147 DOM
-
2026-06-01days on market $89,000 Active 147 DOM
-
2026-05-31days on market $89,000 Active 146 DOM
-
2026-05-31days on market $89,000 Active 145 DOM
-
2026-02-21historical $800
-
2026-01-05$89,000 Active 295-char remark
Show marketing remark (295 chars)
Spacious 3 bedroom, 2 bathroom condo featuring an open living and dining area, functional kitchen, and well-sized bedrooms. Convenient layout with ample storage. Located in an established community with easy access to shopping, dining, and major roadways. Ideal for owner-occupants or investors.
-
2025-10-25$800
-
2025-01-28$93,287 Active
-
2024-09-01historical $850
-
2024-09-01$850
-
2024-07-30historical $850
-
2024-07-19$850
ⓘ Source: listings_history table (triggers on properties + properties_extension) + one-shot
backfill from property_details.listing_events for pre-trigger history.
Climate risk First Street
- Flood 1/10 Low 0% chance over 30 yrs
- Wildfire 5/10 Major
- Heat 9/10 Extreme 7 d/yr ≥111°F today · 22 d/yr by 30 yrs out
- Wind 8/10 Severe 94% chance of damaging wind over 30 yrs
- Air quality 2/10 Low 1 unhealthy d/yr today · 2 by 30 yrs out
Nearby sold comps map
Loading sold comps map…
Walkable amenities ~0.75 mi
Loading nearby amenities…
Taxation est. · year 1
- Rental income
- $11,699
- − Mortgage interest
- −$4,985
- − Property taxes
- −$1,335
- − Insurance
- −$445
- − Repairs & maintenance
- −$936
- − Management
- −$936
- − Depreciation
- −$2,589
- Taxable income
- $472
- Est. tax owed @ 24.0%
- −$113
- After-tax cash flow
- $1,748/yr
For passive investors: Depreciation is non-cash, so a rental often shows a tax loss while cash-flowing — sheltering income. Rental losses are passive: they offset passive income freely, and up to $25,000/yr can offset ordinary (W-2) income if you actively participate and your MAGI is under $100k (phasing out to $0 by $150k); unused losses carry forward. On sale, claimed depreciation is recaptured at up to 25%, and gains may owe capital-gains tax (a 1031 exchange can defer both). Figures are a year-1 estimate at your 24.0% rate — not tax advice; consult a CPA.
Condition & rehab AI · 12 photos
This property is in good condition with a good condition score of 75. It is a well-maintained single-family home with a good layout and ample storage. The property is located in an established community with easy access to shopping, dining, and major roadways. Ideal for owner-occupants or investors.
Value-add opportunities
- Both Paint touch-ups — Enhances curb appeal and interior aesthetics
- Both New flooring in bathrooms — Improves functionality and appearance
- Both New kitchen appliances — Modernizes the space and adds value
- Both Landscaping improvements — Enhances curb appeal and property value
Renovation cost estimate screening
Value-add ROI direction
- Both Paint touch-ups — Enhances curb appeal and interior aesthetics ↑
- Both New flooring in bathrooms — Improves functionality and appearance ↑
- Both New kitchen appliances — Modernizes the space and adds value ↑
- Both Landscaping improvements — Enhances curb appeal and property value ↑
ⓘ Cost ranges are severity-bucket heuristics (US national rule-of-thumb). Get contractor quotes + a written scope before underwriting a rehab budget.
Schools (NCES district)
- District
- Mission CISD
- NCES district ID
- 4831040
- Math proficiency
- 15% ▼ -35.00%
- Reading proficiency
- 28% ▼ -15.00%
- Median HH income
- $32,855
- Composite
- 17.47/100
- National rank
- #9061
- State rank
- #775 of 826 in TX
Livability — Mission
- Score
- 75/100
- State rank
- #148
- US rank
- #4155
Category grades
Schools grade is shown separately in the Schools card above.
Census & demographics
- Census place
- Mission, TX
- County
- Hidalgo County · 623,128 people
- City population
- 78,024
- Metro
- McAllen-Edinburg-Mission, TX
- Population (ZIP)
- 78,024
- Household income
- $54,298
- Rent vs Own
- Severe rent burden
- 1714.0
Population outlook (Hidalgo County) Hauer SSP2
- Today (2025)
- 955,232 people
- By 2030
- 1,009,774 · +5.7%
- By 2040
- 1,120,332 · +17.3%
- By 2050
- 1,225,036 · +28.2%
- By 2075
- 1,439,189 · +50.7%
- By 2100
- 1,533,429 · +60.5%
Race, ethnicity, and origin ACS 2023
- Neighborhood character
- Predominantly Hispanic (85%)
- Race & ethnicity
- Hispanic / Latino 85% Two or more races 47% White 12% Asian 2%
- Hispanic origin (detail)
- Mexican 80%
- Common ancestry
- Slovak 1% Portuguese 0%
- Foreign-born
- 28% · Canada, South Korea
- Languages at home
- 22% English-only · Spanish 76%
Political lean MEDSL · Hidalgo
- 2024 margin
- Toss-up / Even · D 48.1% · R 51.0%
- 2008→2024 swing
- -41.6pp toward R · 2008: 38.7pp · 2024: -2.9pp
- All cycles
- 2024: R+2.9 2020: D+17.1 2016: D+40.5 2012: D+41.8 2008: D+38.7
Not yet ingested
- Civics
- —
Market trends
- HPI YoY
- ▼ -62.35%
- Current HPI
- 209.3573
- Rent YoY
- ▲ 0.93%
- Metro
- McAllen-Edinburg-Mission, TX
- State GDP YoY
- ▲ 3.95%
- F500 in state
- 110
Industry mix (Fortune 500 HQ in TX)
| Industry | F500 HQs | Revenue |
|---|---|---|
| Energy | 16 | $1,198B |
|
||
| Technology | 5 | $198B |
|
||
| Engineering / Construction | 4 | $72B |
|
||
| Energy Services | 3 | $60B |
|
||
| Utilities | 3 | $41B |
|
||
| Healthcare | 2 | $330B |
|
||
Price history
-4.6% since first listed8 events — show timeline
- 2026-02-21 Rental Removed $800 RENTEC
- 2026-01-05 Listed $89,000 MCALLENMLS
- 2025-10-25 Listed for Rent $800 RENTEC
- 2025-01-28 Listed $93,287 MCALLENMLS
- 2024-09-01 Rental Removed $850 RENTEC
- 2024-09-01 Listed for Rent $850 RENTEC
- 2024-07-30 Rental Removed $850 RENTEC
- 2024-07-19 Listed for Rent $850 RENTEC
Cash-flow waterfall
monthlySold comps — $/sqft
last 12 mo · ≤1 miLoading sold comps…