 Duplex
🌊 Lakefront
Duplex
🌊 Lakefront
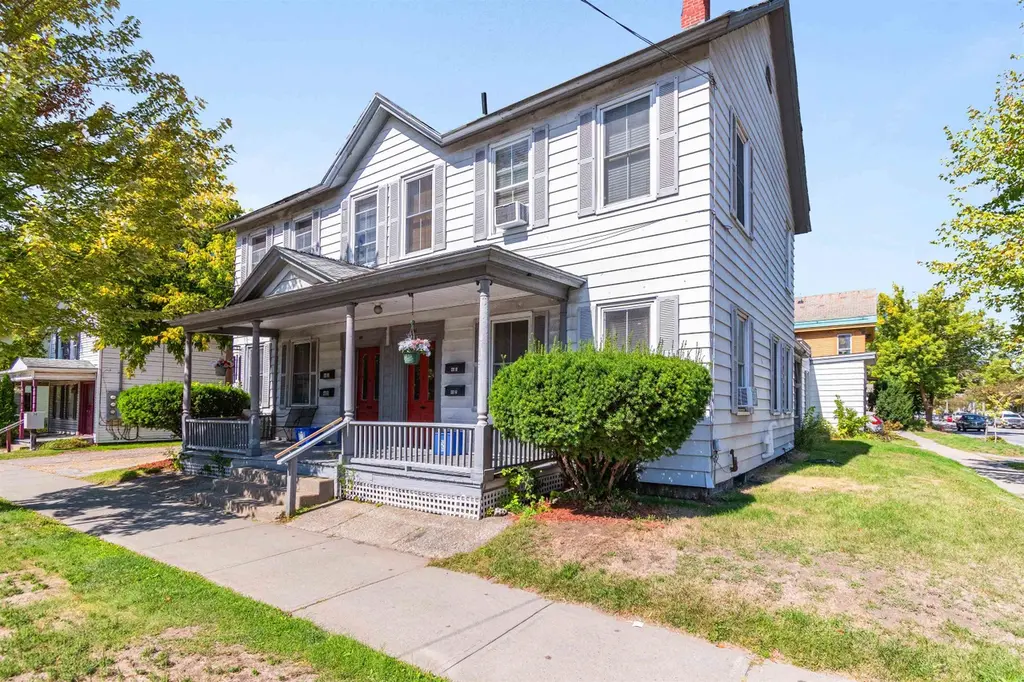
44-46 Sherman St · Burlington, VT
Flood risk 1/10 · Minimal
- FEMA flood zone
- X (unshaded)
- Chance of flooding over 30 yrs
- 0.0%
- Est. flood insurance / yr
- $473 – $860
Fire risk 1/10 · Minimal
- Est. fire insurance / yr
- $480 – $892
Heat risk 3/10 · Minor
- Hot days now (above 93°F)
- 7 days/yr
- Hot days in 30 yrs
- 15 days/yr
Wind risk 2/10 · Minimal
- Chance of severe wind over 30 yrs
- 1.0%
Air-quality risk 2/10 · Minimal
- Unhealthy air days now
- 1 days/yr
- Unhealthy air days in 30 yrs
- 1 days/yr
Risk factors via First Street. Map © Google.
Why this score? — see what drove the D+ grade
The composite is a weighted blend of 9 inputs, each scored 0–100. Each bar is that input's sub-score; the figure is the points it added to the 100-point composite (weight × sub-score).
- ARV discount +14.6/15.0
- Cash flow +13.2/30.0
- Schools +5.0/10.0
- DSCR +4.0/10.0
- 1% rule +3.7/10.0
- Livability +3.7/5.0
- Rent growth +2.6/5.0
- Condition / age +2.2/5.0
- Appreciation +0.0/10.0
$659,000
🖨 Deal sheet 📄 Offer letter ✓ Due diligence
Multi-family units
County records classify this as Multi-Family (2-4 Unit). Listing-text estimate: 2 units. confirmed
Listing remarks
INVESTOR'S DREAM: Lakefront Views & Prime Downtown Location! Seize a rare opportunity to own a highly desirable investment property located on a corner lot offering breathtaking, unobstructed views of majestic Lake Champlain and the towering New York Adirondack Mountains. This exceptional multi-unit property boasts a truly centralized location, putting your tenants in the heart of the action. Enjoy the ultimate convenience with public transportation, sidewalks, the scenic recreational path, and vibrant waterfront events literally outside your door. Easy access to the shopping, diverse dining options, the University of Vermont (UVM), and the UVM Medical Center. A healthy rental history
Key facts
- Centralized location
- Lakefront views
- Corner lot
Tags
Property features AI
Finance
- Other: Documents available: certificate of compliance, deed, property disclosure
- Financial info: Net income reported; Operating expenses include insurance, maintenance, snow removal, water/sewer, and other
Exterior
- Parking: Garage with capacity for 1 vehicle; Crushed stone driveway
- Utilities: Public water; Public sewer; Electric service with circuit breakers (Burlington Electric); On-site gas (gas underground) supplied by VT Gas; High-speed internet and fiber optic available; Trash service via owner-managed dumpster
- Home design: Apartment building; Existing structure; Built in 1899
- Construction: Wood frame construction; Slate roof; Built in 1899
- Exterior features: City lot on a corner location; Lake and water views (Lake Champlain); Landscaped grounds; Level lot with sidewalks and street lights; Near paths, shopping, public transportation, hospital, and schools
Interior
- Kitchen: Refrigerator included in units; Electric range present in at least one unit
- Bedrooms: Four 1-bedroom units (units on varying levels)
- Flooring: Combination of flooring types
- Bathrooms: Four full bathrooms (one in each unit)
- Heating & cooling: Natural gas heating; Floor furnaces; Hot water heating with radiators; No central cooling
- Interior features: Basement with interior access; Unfinished basement with dirt floor, interior stairs, and storage space; Ceiling fan(s); Porch; Smoke detectors
- Laundry & utility: Washer and dryer present in at least one unit; Water heaters are natural gas and owned
Neighborhood map
What this means for you Summary
Snapshot
- This is a 2 × 2-bed/1-bath units multifamily listed at $659k. Condition is rated fair.
Deal economics
- At list price, monthly cash flow is $-11 ($-131/yr) — negative. Per door: $-5/mo.
- To cash-flow at today's rent, offer at most $657k (0.2% below list).
- To meet the 1% rule (rent ≥ 1% of price), the offer needs to be $575k (12.7% below list).
- Recommended offer: $575k (12.7% below list) — sets the bar for 1% rule.
- Cap rate 6.3% vs local median 3.1% in Burlington — top-decile yield for the area; either an underpriced asset or a hidden risk that comps aren't pricing in. Stress-test before assuming the spread holds.
Location & tenants
- Location reads 74/100 on livability (#19 in VT, #4,619 nationally) — a middle-class / working-renter tenant base. Strengths: commute A+, health & safety A+, schools B; Watch: cost of living D, crime F, amenities F.
- Market conditions: Rents flat; 137 active listings in the ZIP; 898 units permitted in Chittenden County in 2024 (554 in 5+ unit buildings).
- At $5,751/mo this rent would consume 105% of the median local household income ($66k/yr) (locally 2757% of renters already pay >50% of income on rent) — very limited rent-growth headroom before tenants either downsize or default.
Forward outlook
- Local home prices are declining (-3.0%/yr); year-one equity from $5k of loan paydown is wiped out by about $20k of value loss. Plan a longer hold.
- Chittenden County population projected at +8% by 2050 — modest demand growth; plan on rents tracking national, not racing it.
Negotiation context
- It's been on market 21 days — a 2% lower offer ($649k) is reasonable based on typical stale-listing flexibility.
Risks & watch-outs
- Watch-outs: built in 1899 — expect roof / HVAC / electrical / plumbing capex.
Questions for the listing agent
- What do current leases actually rent for vs. the listed asking? Can we see a recent rent roll and the last 12 months of T-12 income?
- Can we see the unit-by-unit rent roll, current vacancy, and any below-market leases? What's the average tenancy length?
- What capital expenditures (roof, boiler, parking lot, exteriors) have been made in the last 5 years, and what's planned in the next 2?
- Have any recent inspections been done? Can we get a copy of the seller's disclosures and any deferred-maintenance estimates?
- Built in 1899 — when were the roof, HVAC, electrical panel, plumbing, and water heater last replaced?
- Is there a deadline driving the sale (1031 exchange, divorce, estate, relocation)? That informs how much negotiation room exists.
- Schools are B-rated — typically a magnet for longer-tenancy family renters. What's the average tenant stay here, and is there a school-zone premium baked into asking?
- Crime grade is F in this area — have there been break-ins, vandalism, or insurance claims at this property in the last 3 years? What carrier currently insures it and at what premium?
- The area grade is low — what's the realistic commute time and amenity access for the typical tenant pool here? Any planned neighborhood developments (good or bad) we should know about?
- This sits on a lake — are riparian / water-frontage rights deeded with the parcel? Any dock permits, shoreline easements, or HOA water-use restrictions?
- What's the documented flood / surge / shoreline-erosion history here (FEMA AND non-FEMA — e.g., storm surge, creek backup, septic-field saturation)?
- Any water-quality or seasonal algae-bloom issues that affect tenant satisfaction or short-term-rental demand?
- What's the average days-on-market for RENTAL listings here right now (not sales)? A rising rental-DOM trend means longer vacancies and softer asking-rent achievability than the comps imply.
- What's the recent tenant-quality profile in this submarket — average credit score on applications, eviction rate, late-payment / NSF rate, and stable-employment percentage? A property-management company in the area should have these aggregated.
- How much new apartment / multifamily construction is in the pipeline within 1–3 miles? Heavy new supply (>2% of stock underway) typically softens rents 12–24 months out; light construction supports rent growth.
Investment metrics
- 1% rule
- 0.87% ✗
- Cap rate
- 6.27%
- Cash-on-cash
- -0.07%
- DSCR
- 1.00
- GRM
- 9.5
CMA / ARV
- ARV (on-the-fly)
- $782,688
- Comps found
- 5
Show comp detail 5 sales within ~0.75 mi
| Address | Dist | Beds/Ba | Sqft | Sold | Price | $/sf | Match |
|---|---|---|---|---|---|---|---|
| 21-23 N Winooski Ave | 0.40mi | 5/5.0 (+1) | 2,956 (-1%) | 8mo | $849,000 | $287 | 64 |
| 101-103 North St | 0.17mi | 4/4.0 | 2,664 (-10%) | 15mo | $700,000 | $263 | 62 |
| 42 Elmwood Ave | 0.30mi | 4/3.0 | 2,695 (-9%) | 7mo | $749,000 | $278 | 61 |
| 167-169 N Union St | 0.52mi | 5/3.0 (+1) | 2,851 (-4%) | 13mo | $470,000 | $165 | 49 |
| 44 Isham St | 0.63mi | 5/3.0 (+1) | 2,605 (-12%) | 2mo | $590,000 | $226 | 39 |
Match score weights: distance 35% · size 25% · config 20% · recency 20%. Top-matched comps best support the ARV.
Projected returns pro-forma
-3.0% appreciation · 0.52% rent growth · sell at horizon
- IRR
- -19.2%
- Equity multiple
- 0.34×
- Total profit
- $-121,399
- Equity at exit
- $98,259
- IRR
- -18.0%
- Equity multiple
- 0.13×
- Total profit
- $-160,933
- Equity at exit
- $56,978
Cash invested: $184,520 (down + closing). Projections, not guarantees.
Landlord ↔ Tenant lean methodology
- Overall (STATE)
- 41 Moderately Tenant-Leaning
- State Vermont
- 41 Moderately Tenant-Leaning · D+15
- County
- — inherits STATE
- City
- — inherits STATE
ZIP-level market 05401
- Rents YoY
- 0.5%
- Active inventory
- 137
- Price-to-rent
- 19.1×
Monthly cashflow live
- Estimated rent
- $5,751 high interval (Pro) →
- Mortgage (P&I)
- −$3,456
- Tax est. 1.5%
- −$824 /mo · $9,885/yr
- Insurance
- −$275
- HOA
- −$0
- Vacancy / Maint / Mgmt
- −$1,208
- Net cashflow
- $-11
Break-even live
2-unit breakdown (identical units grouped — click to expand)
| Units | Beds | Baths | Est. rent |
|---|---|---|---|
| 2× units | 2 | 1 | $5,750 |
| #1 | 2 | 1 | $2,875 |
| #2 | 2 | 1 | $2,875 |
| Total (2 units) | $5,751 | ||
UW: 25.0% down · 7.5% · 30yr · 1.5% tax · 5.0% vac · 8.0% maint · 8.0% mgmt
Financing live
Cash to close
- Down payment
- $164,750
- Closing costs
- $19,770
- Reserves months
- —
- Total cash needed
- —
Loan-product check · same deal, 3 products live
Conventional
25% down · 7.5% · 30yr
- Down + closing
- —
- Monthly P&I
- —
- Monthly cashflow
- —
- DSCR
- —
- Eligible?
- —
Personal DTI + credit; lowest rate.
DSCR
20% down · 8.5% · 30yr
- Down + closing
- —
- Monthly P&I
- —
- Monthly cashflow
- —
- DSCR
- —
- Eligible?
- —
No personal income docs; deal must DSCR.
Hard money
10% down · 12.0% · 12mo
- Down + closing
- —
- Monthly P&I
- —
- Monthly cashflow
- —
- DSCR
- —
- Eligible?
- —
Short-term bridge; refi at stabilization.
Listing history 17 events
-
2026-06-19days on market $659,000 Active 21 DOM
-
2026-06-18days on market $659,000 Active 20 DOM
-
2026-06-17days on market $659,000 Active 19 DOM
-
2026-06-16days on market $659,000 Active 18 DOM
-
2026-06-15days on market $659,000 Active 17 DOM
-
2026-06-14days on market $659,000 Active 15 DOM
-
2026-06-13days on market $659,000 Active 14 DOM
-
2026-06-10days on market $659,000 Active 12 DOM
-
2026-06-09days on market $659,000 Active 11 DOM
-
2026-06-08days on market $659,000 Active 10 DOM
-
2026-06-07days on market $659,000 Active 9 DOM
-
2026-06-05days on market $659,000 Active 6 DOM
-
2026-06-03days on market $659,000 Active 5 DOM
-
2026-06-02days on market $659,000 Active 4 DOM
-
2026-06-01days on market $659,000 Active 3 DOM
-
2026-05-31days on market $659,000 Active 2 DOM
-
2026-05-29$659,000 Active
ⓘ Source: listings_history table (triggers on properties + properties_extension) + one-shot
backfill from property_details.listing_events for pre-trigger history.
Climate risk First Street
- Flood 1/10 Low FEMA zone X (unshaded) · 0% chance over 30 yrs
- Wildfire 1/10 Low
- Heat 3/10 Moderate 7 d/yr ≥93°F today · 15 d/yr by 30 yrs out
- Wind 2/10 Low 100% chance of damaging wind over 30 yrs
- Air quality 2/10 Low 1 unhealthy d/yr today · 1 by 30 yrs out
Nearby sold comps map
Loading sold comps map…
Walkable amenities ~0.75 mi
Loading nearby amenities…
Taxation est. · year 1
- Rental income
- $69,012
- − Mortgage interest
- −$36,914
- − Property taxes
- −$9,885
- − Insurance
- −$3,295
- − Repairs & maintenance
- −$5,521
- − Management
- −$5,521
- − Depreciation
- −$19,171
- Taxable loss
- −$11,295
- Est. tax savings @ 24.0%
- +$2,711
- After-tax cash flow
- $2,580/yr
For passive investors: Depreciation is non-cash, so a rental often shows a tax loss while cash-flowing — sheltering income. Rental losses are passive: they offset passive income freely, and up to $25,000/yr can offset ordinary (W-2) income if you actively participate and your MAGI is under $100k (phasing out to $0 by $150k); unused losses carry forward. On sale, claimed depreciation is recaptured at up to 25%, and gains may owe capital-gains tax (a 1031 exchange can defer both). Figures are a year-1 estimate at your 24.0% rate — not tax advice; consult a CPA.
Condition & rehab AI · 13 photos
This multi-family property requires moderate renovations to update the kitchen and exterior, and improve the landscaping. These updates will significantly increase its resale and rental value.
Repairs flagged
- Moderate Kitchen cabinets — The cabinets are dated and need updating.
- Moderate Bathroom fixtures — The fixtures appear outdated and need replacement.
- Moderate Exterior siding — The siding is weathered and may need repainting or replacement.
- Moderate Landscaping — The landscaping is overgrown and needs trimming and maintenance.
Value-add opportunities
- Both Updating the kitchen cabinets and fixtures — Updating the kitchen will improve both the resale and rental value.
- Both Painting the exterior siding — Painting the siding will improve the curb appeal and increase the property's value.
- Both Landscaping — A well-maintained landscape will enhance the property's curb appeal and attract more tenants.
Renovation cost estimate screening
| Repair item | Severity | Est. cost |
|---|---|---|
| Kitchen cabinets · The cabinets are dated and need updating. | Moderate | $3,000–15,000 |
| Bathroom fixtures · The fixtures appear outdated and need replacement. | Moderate | $3,000–15,000 |
| Exterior siding · The siding is weathered and may need repainting or replacement. | Moderate | $3,000–15,000 |
| Landscaping · The landscaping is overgrown and needs trimming and maintenance. | Moderate | $3,000–15,000 |
| Total estimated repair cost · 4 items | $12,000–60,000 |
Value-add ROI direction
- Both Updating the kitchen cabinets and fixtures — Updating the kitchen will improve both the resale and rental value. ↑
- Both Painting the exterior siding — Painting the siding will improve the curb appeal and increase the property's value. ↑
- Both Landscaping — A well-maintained landscape will enhance the property's curb appeal and attract more tenants. ↑
ⓘ Cost ranges are severity-bucket heuristics (US national rule-of-thumb). Get contractor quotes + a written scope before underwriting a rehab budget.
Schools (NCES district)
No district data.
Livability — Burlington
- Score
- 74/100
- State rank
- #19
- US rank
- #4619
Category grades
Schools grade is shown separately in the Schools card above.
Census & demographics
- Census place
- Burlington, VT
- County
- Chittenden County · 110,603 people
- City population
- 31,662
- Metro
- Burlington-South Burlington, VT
- Population (ZIP)
- 31,662
- Household income
- $65,657
- Rent vs Own
- Severe rent burden
- 2757.0
Population outlook (Chittenden County) Hauer SSP2
- Today (2025)
- 170,769 people
- By 2030
- 174,716 · +2.3%
- By 2040
- 180,337 · +5.6%
- By 2050
- 183,768 · +7.6%
- By 2075
- 194,646 · +14.0%
- By 2100
- 194,933 · +14.2%
Race, ethnicity, and origin ACS 2023
- Neighborhood character
- Predominantly White (84%)
- Race & ethnicity
- White 84% Two or more races 6% Asian 4% Black 4% Hispanic / Latino 4%
- Common ancestry
- Romanian 5% Lithuanian 5% Slovak 4%
- Foreign-born
- 7% · China, Canada, Vietnam
- Languages at home
- 90% English-only · Other Indo-European 2% French/Haitian/Cajun 2% Spanish 2%
Political lean MEDSL · Chittenden
- 2024 margin
- Solid D (+53.6) · D 75.4% · R 21.7% · Other 2.9%
- 2008→2024 swing
- +8.9pp toward D · 2008: 44.8pp · 2024: 53.6pp
- All cycles
- 2024: D+53.6 2020: D+54.5 2016: D+46.8 2012: D+41.9 2008: D+44.8
Not yet ingested
- Civics
- —
Market trends
- HPI YoY
- ▼ -316.87%
- Current HPI
- 352.2081
- Rent YoY
- ▲ 0.52%
- Metro
- Burlington-South Burlington, VT
- State GDP YoY
- —
- F500 in state
- 0
Price history
1 event — show timeline
- 2026-05-29 Listed $659,000 PrimeMLS
Cash-flow waterfall
monthlySold comps — $/sqft
last 12 mo · ≤1 miLoading sold comps…