 9-Plex
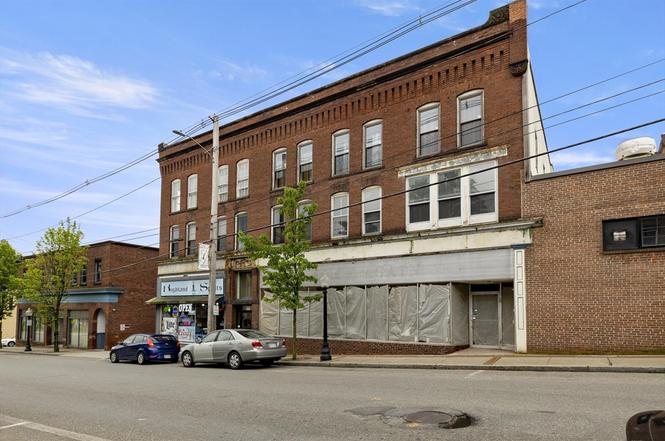
12-14 E Main St · Orange, MA
Flood risk No data
- FEMA flood zone
- —
- Chance of flooding over 30 yrs
- —
- Est. flood insurance / yr
- —
Fire risk No data
- Est. fire insurance / yr
- —
Heat risk No data
- Hot days now (above threshold)
- —
- Hot days in 30 yrs
- —
Wind risk No data
- Chance of severe wind over 30 yrs
- —
Air-quality risk No data
- Unhealthy air days now
- —
- Unhealthy air days in 30 yrs
- —
Risk factors via First Street. Map © Google.
Why this score? — see what drove the B- grade
The composite is a weighted blend of 9 inputs, each scored 0–100. Each bar is that input's sub-score; the figure is the points it added to the 100-point composite (weight × sub-score).
- Cash flow +30.0/30.0
- DSCR +10.0/10.0
- 1% rule +8.9/10.0
- ARV discount +7.5/15.0
- Livability +3.2/5.0
- Rent growth +2.5/5.0
- Schools +2.5/10.0
- Condition / age +2.5/5.0
- Appreciation +0.0/10.0
$1,400,000
🖨 Deal sheet (PDF) 📄 Offer letter ✓ Due diligence
Multi-family units
County records classify this as Multi-Family (5+ Unit). Listing-text estimate: 9 units. confirmed
5+ unit building — per-unit beds/baths from public records are typically unavailable; the breakdown below (if shown) is an estimate from the listing text.
Listing remarks MLS
This is a great mixed-use building housing 2 commercial units and 7 residential units, right in the center of Orange. Fully occupied at market rents. Rent includes heat and h/w for residential units, commercial pay their own. Residential are 6 2BR units and 1 1BR unit. Four of the 7 residential units have private covered porches. Two massive basements could hold potential for some additional income, with back-of-building access. Onsite coin-op laundry. Fire panel. Nicely maintained inside and out. A must-add for any investor looking to expand his/her Orange-area portfolio, or someone looking to start investing in this great community!
Key facts
- Residential units
- Mixed-use building
- Commercial units
Tags
Property features AI
Finance
- HOA & community: No senior community; Nearby amenities include public transportation, park, walk/jog trails, medical facility, laundromat, bike path, highway access, house of worship, public school
Exterior
- Parking: Off-street shared driveway parking; 10 parking spaces; Open parking available
- Utilities: Public water; Public sewer; Electric service for range and dryer
- Home design: 5–9 family building; 3 stories
- Construction: Brick construction; Brick/mortar foundation; Rubber roof; Approximate year built (public records)
- Exterior features: Covered patio/porch; City views; Cleared, level lot; Paved public road frontage on a publicly maintained road
Interior
- Flooring: Carpet; Laminate
- Bathrooms: 8 full bathrooms; 1 half bathroom
- Interior features: 26 total rooms; Full concrete basement
- Laundry & utility: Washer hookup; Electric dryer hookup; Electric range hookup
Neighborhood map
What this means for you Summary
Snapshot
- This is a 9 × 13-bed/?-bath units multifamily listed at $1.40M.
Deal economics
- At list price, monthly cash flow is $6k ($69k/yr) — positive. Per door: $638/mo.
- The deal already cash-flows at list — no discount required.
- Meets the 1% rule at list price ($20k rent vs $1.40M).
- Recommended offer: $1.23M (12.0% below list) — sets the bar for market timing.
- Cap rate 11.2% vs local median 4.2% in Orange — top-decile yield for the area; either an underpriced asset or a hidden risk that comps aren't pricing in. Stress-test before assuming the spread holds.
Location & tenants
- Location reads 63/100 on livability (#197 in MA) — a middle-class / working-renter tenant base. Strengths: housing A+, cost of living A-; Watch: employment C-, health & safety D, amenities F.
- Ralph C Mahar (town): math 24% / reading 35% proficiency, ranked #258 of 302 in MA (top 85%) — low school quality limits family demand, transient renter base, plan for 1-2y turnover.
- Zoned schools: Dexter Park (math 11% / reading 24%, grade F, #811 of 938 statewide, top 87%, 294 students, 0% FRL); Ralph C Mahar Regional (math 24% / reading 35%, grade F, #270 of 343 statewide, top 80%, 523 students, 0% FRL) — zoned schools average 0% FRL vs 41% district-wide (41 pts lower); this property's tenant base skews higher-income than the district average.
- Market conditions: 23 active listings in the ZIP; 89 units permitted in Franklin County in 2024 (22 in 5+ unit buildings).
Forward outlook
- Local home prices are declining (-3.0%/yr); year-one equity from $10k of loan paydown is wiped out by about $42k of value loss. Plan a longer hold.
- Franklin County population projected at -20% by 2050 — secular population decline; favor cash flow + early exit over multi-decade hold.
- At projected returns (-3.0% appreciation + 3.0% rent growth), your $392k cash investment doubles in ~7 years — after that, you're playing with house money.
Negotiation context
- It's been on market 200 days — a 12% lower offer ($1.23M) is reasonable based on typical stale-listing flexibility.
- 3 sale attempts since 23y ago with the ask held roughly flat each time — persistent listings suggest the price (not the market) is what's stuck; bring a comps-based counter.
- Current owner paid $800k; list at $1.40M implies a 75% gain — meaningful room to come down on a strong offer.
Risks & watch-outs
- Watch-outs: built in 1900 — expect roof / HVAC / electrical / plumbing capex.
Questions for the listing agent
- It's been on market 200 days. Have you received any prior offers? Is the seller open to a 12% concession, seller financing, or rate buy-down credit?
- Can we see the unit-by-unit rent roll, current vacancy, and any below-market leases? What's the average tenancy length?
- What capital expenditures (roof, boiler, parking lot, exteriors) have been made in the last 5 years, and what's planned in the next 2?
- Built in 1900 — when were the roof, HVAC, electrical panel, plumbing, and water heater last replaced?
- Why hasn't it sold? Are there any deal-killer items the seller is aware of (foundation, flood, title, zoning, code violations)?
- Is there a deadline driving the sale (1031 exchange, divorce, estate, relocation)? That informs how much negotiation room exists.
- Schools are F-rated, which usually means shorter tenancies and higher turnover. Who's the typical renter profile here, and what's been the actual vacancy rate?
- What's the average days-on-market for RENTAL listings here right now (not sales)? A rising rental-DOM trend means longer vacancies and softer asking-rent achievability than the comps imply.
- What's the recent tenant-quality profile in this submarket — average credit score on applications, eviction rate, late-payment / NSF rate, and stable-employment percentage? A property-management company in the area should have these aggregated.
- How much new apartment / multifamily construction is in the pipeline within 1–3 miles? Heavy new supply (>2% of stock underway) typically softens rents 12–24 months out; light construction supports rent growth.
Investment metrics
- 1% rule
- 1.39% ✓
- Cap rate
- 11.22%
- Cash-on-cash
- 17.58%
- DSCR
- 1.78
- GRM
- 6.0
CMA / ARV
No comps found within radius.
Projected returns pro-forma
-3.0% appreciation · 3.0% rent growth · sell at horizon
- IRR
- 9.0%
- Equity multiple
- 1.36×
- Total profit
- $139,281
- Equity at exit
- $208,745
- IRR
- 18.2%
- Equity multiple
- 2.51×
- Total profit
- $593,567
- Equity at exit
- $121,046
Cash invested: $392,000 (down + closing). Projections, not guarantees.
Landlord ↔ Tenant lean methodology
- Overall (STATE)
- 20 Strongly Tenant-Friendly
- State Massachusetts
- 20 Strongly Tenant-Friendly · D+15
- County
- — inherits STATE
- City
- — inherits STATE
ZIP-level market 01364
- Home prices YoY
- -19.2%
- Active inventory
- 23
- Price-to-rent
- 53.8×
Monthly cashflow live
- Estimated rent
- $19,518 medium interval (Pro) →
- Mortgage (P&I)
- −$7,342
- Tax est. 1.5%
- −$1,750 /mo · $21,000/yr
- Insurance
- −$583
- HOA
- −$0
- Vacancy / Maint / Mgmt
- −$4,099
- Net cashflow
- $5,744
Break-even live
Sensitivity live
| Price | -10% $6,712 | -5% $6,228 | +0% $5,744 | +5% $5,260 | +10% $4,777 |
|---|---|---|---|---|---|
| Rent | -10% $4,202 | -5% $4,973 | +0% $5,744 | +5% $6,515 | +10% $7,286 |
| Rate | -1.0pp $6,449 | -0.5pp $6,100 | base $5,744 | +0.5pp $5,381 | +1.0pp $5,012 |
9-unit breakdown (identical units grouped — click to expand)
| Units | Beds | Baths | Est. rent |
|---|---|---|---|
| 9× units | 13 | — | $19,521 |
| #1 | 13 | — | $2,169 |
| #2 | 13 | — | $2,169 |
| #3 | 13 | — | $2,169 |
| #4 | 13 | — | $2,169 |
| #5 | 13 | — | $2,169 |
| #6 | 13 | — | $2,169 |
| #7 | 13 | — | $2,169 |
| #8 | 13 | — | $2,169 |
| #9 | 13 | — | $2,169 |
| Total (9 units) | $19,518 | ||
UW: 25.0% down · 7.5% · 30yr · 1.5% tax · 5.0% vac · 8.0% maint · 8.0% mgmt
Financing live
Cash to close
- Down payment
- $350,000
- Closing costs
- $42,000
- Reserves months
- —
- Total cash needed
- —
Loan-product check · same deal, 3 products live
Conventional
25% down · 7.5% · 30yr
- Down + closing
- —
- Monthly P&I
- —
- Monthly cashflow
- —
- DSCR
- —
- Eligible?
- —
Personal DTI + credit; lowest rate.
DSCR
20% down · 8.5% · 30yr
- Down + closing
- —
- Monthly P&I
- —
- Monthly cashflow
- —
- DSCR
- —
- Eligible?
- —
No personal income docs; deal must DSCR.
Hard money
10% down · 12.0% · 12mo
- Down + closing
- —
- Monthly P&I
- —
- Monthly cashflow
- —
- DSCR
- —
- Eligible?
- —
Short-term bridge; refi at stabilization.
Listing history 25 events
-
2026-06-21days on market $1,400,000 Active 200 DOM
-
2026-06-21days on market $1,400,000 Active 199 DOM
-
2026-06-18days on market $1,400,000 Active 197 DOM
-
2026-06-17days on market $1,400,000 Active 196 DOM
-
2026-06-16days on market $1,400,000 Active 195 DOM
-
2026-06-15days on market $1,400,000 Active 194 DOM
-
2026-06-13days on market $1,400,000 Active 192 DOM
-
2026-06-12days on market $1,400,000 Active 191 DOM
-
2026-06-10days on market $1,400,000 Active 189 DOM
-
2026-06-09days on market $1,400,000 Active 188 DOM
-
2026-06-08days on market $1,400,000 Active 187 DOM
-
2026-06-07days on market $1,400,000 Active 186 DOM
-
2026-06-07days on market $1,400,000 Active 185 DOM
-
2026-06-03days on market $1,400,000 Active 182 DOM
-
2026-06-02days on market $1,400,000 Active 181 DOM
-
2026-06-01days on market $1,400,000 Active 180 DOM
-
2026-05-31days on market $1,400,000 Active 179 DOM
-
2026-05-30days on market $1,400,000 Active 178 DOM
-
2025-12-03$1,400,000 New
-
2024-05-16soldstatus $800,000 Sold 649-char remark
Show marketing remark (649 chars)
This is a great mixed-use building housing 2 commercial units and 7 residential units, right in the center of Orange. Fully occupied at market rents. Rent includes heat and h/w for residential units, commercial pay their own. Residential are 6 2BR units and 1 1BR unit. Four of the 7 residential units have private covered porches. Two massive basements could hold potential for some additional income, with back-of-building access. Onsite coin-op laundry. Fire panel. Nicely maintained inside and out. A must-add for any investor looking to expand his/her Orange-area portfolio, or someone looking to start investing in this great community!
-
2024-03-07status Under Agreement 649-char remark
Show marketing remark (649 chars)
This is a great mixed-use building housing 2 commercial units and 7 residential units, right in the center of Orange. Fully occupied at market rents. Rent includes heat and h/w for residential units, commercial pay their own. Residential are 6 2BR units and 1 1BR unit. Four of the 7 residential units have private covered porches. Two massive basements could hold potential for some additional income, with back-of-building access. Onsite coin-op laundry. Fire panel. Nicely maintained inside and out. A must-add for any investor looking to expand his/her Orange-area portfolio, or someone looking to start investing in this great community!
-
2024-03-01historical Contingent 649-char remark
Show marketing remark (649 chars)
This is a great mixed-use building housing 2 commercial units and 7 residential units, right in the center of Orange. Fully occupied at market rents. Rent includes heat and h/w for residential units, commercial pay their own. Residential are 6 2BR units and 1 1BR unit. Four of the 7 residential units have private covered porches. Two massive basements could hold potential for some additional income, with back-of-building access. Onsite coin-op laundry. Fire panel. Nicely maintained inside and out. A must-add for any investor looking to expand his/her Orange-area portfolio, or someone looking to start investing in this great community!
-
2024-02-19$769,000 New 649-char remark
Show marketing remark (649 chars)
This is a great mixed-use building housing 2 commercial units and 7 residential units, right in the center of Orange. Fully occupied at market rents. Rent includes heat and h/w for residential units, commercial pay their own. Residential are 6 2BR units and 1 1BR unit. Four of the 7 residential units have private covered porches. Two massive basements could hold potential for some additional income, with back-of-building access. Onsite coin-op laundry. Fire panel. Nicely maintained inside and out. A must-add for any investor looking to expand his/her Orange-area portfolio, or someone looking to start investing in this great community!
-
2004-01-13soldstatus $341,700 216-char remark
Show marketing remark (216 chars)
60+K GROSS, 34+K NET, GUTTED IN '86-GOVERNMENT REHAB COMPLETELY NEW FIRE CODE SHEET ROCK, PLUMBING, WIRING,HEAT,ROOF,WINDOWS. IN '02 NEW APPLIANCES, CARPET, AND PAINT. 2 STREET LEVEL RETAIL SPACES FULLY RENTED. GROSS
-
2003-04-21$349,900 216-char remark
Show marketing remark (216 chars)
60+K GROSS, 34+K NET, GUTTED IN '86-GOVERNMENT REHAB COMPLETELY NEW FIRE CODE SHEET ROCK, PLUMBING, WIRING,HEAT,ROOF,WINDOWS. IN '02 NEW APPLIANCES, CARPET, AND PAINT. 2 STREET LEVEL RETAIL SPACES FULLY RENTED. GROSS
ⓘ Source: listings_history table (triggers on properties + properties_extension) + one-shot
backfill from property_details.listing_events for pre-trigger history.
Nearby sold comps map
Loading sold comps map…
Walkable amenities ~0.75 mi
Loading nearby amenities…
Taxation est. · year 1
- Rental income
- $234,216
- − Mortgage interest
- −$78,422
- − Property taxes
- −$21,000
- − Insurance
- −$7,000
- − Repairs & maintenance
- −$18,737
- − Management
- −$18,737
- − Depreciation
- −$40,727
- Taxable income
- $49,592
- Est. tax owed @ 24.0%
- −$11,902
- After-tax cash flow
- $57,027/yr
For passive investors: Depreciation is non-cash, so a rental often shows a tax loss while cash-flowing — sheltering income. Rental losses are passive: they offset passive income freely, and up to $25,000/yr can offset ordinary (W-2) income if you actively participate and your MAGI is under $100k (phasing out to $0 by $150k); unused losses carry forward. On sale, claimed depreciation is recaptured at up to 25%, and gains may owe capital-gains tax (a 1031 exchange can defer both). Figures are a year-1 estimate at your 24.0% rate — not tax advice; consult a CPA.
Schools (NCES district)
- District
- Ralph C Mahar
- NCES district ID
- 2509900
- Math proficiency
- 24% ▼ -16.00%
- Reading proficiency
- 35% ▼ -12.00%
- Median HH income
- $42,609
- Composite
- 25.05/100
- National rank
- #7544
- State rank
- #258 of 302 in MA
Livability — Orange
- Score
- 63/100
- State rank
- #197
- US rank
- #15360
Category grades
Schools grade is shown separately in the Schools card above.
Census & demographics
- Census place
- Orange, MA
- City population
- 7,668
- Population (ZIP)
- 7,668
Population outlook (Franklin County) Hauer SSP2
- Today (2025)
- 68,566 people
- By 2030
- 66,543 · -3.0%
- By 2040
- 60,766 · -11.4%
- By 2050
- 54,971 · -19.8%
- By 2075
- 42,642 · -37.8%
- By 2100
- 31,861 · -53.5%
Race, ethnicity, and origin ACS 2023
- Neighborhood character
- Predominantly White (89%)
- Race & ethnicity
- White 89% Two or more races 7% Hispanic / Latino 7%
- Hispanic origin (detail)
- Puerto Rican 5%
- Common ancestry
- Lithuanian 12% Romanian 4% Italian 2%
- Foreign-born
- 4% · Canada, Jamaica
- Languages at home
- 94% English-only · Spanish 5%
Political lean MEDSL · Franklin
- 2024 margin
- Solid D (+37.8) · D 67.3% · R 29.6% · Other 3.1%
- 2008→2024 swing
- -9.9pp toward R · 2008: 47.7pp · 2024: 37.8pp
- All cycles
- 2024: D+37.8 2020: D+44.4 2016: D+37.0 2012: D+47.0 2008: D+47.7
Not yet ingested
- Civics
- —
Market trends
- HPI YoY
- ▼ -65.40%
- Current HPI
- 274.2531
- Rent YoY
- —
- Metro
- —
- State GDP YoY
- ▲ 2.28%
- F500 in state
- 38
Industry mix (Fortune 500 HQ in MA)
| Industry | F500 HQs | Revenue |
|---|---|---|
| Technology | 3 | $17B |
|
||
| Insurance | 2 | $84B |
|
||
| Retail | 2 | $76B |
|
||
| Life Sciences | 1 | $43B |
|
||
| Energy Technology | 1 | $31B |
|
||
| Aerospace / Defense | 1 | $18B |
|
||
Price history
+300.1% since first listed7 events — show timeline
- 2025-12-03 Listed $1,400,000 MLS PIN
- 2024-05-16 Sold (MLS) $800,000 MLS PIN
- 2024-03-07 Pending — MLS PIN
- 2024-03-01 Contingent — MLS PIN
- 2024-02-19 Listed $769,000 MLS PIN
- 2004-01-13 Sold (MLS) $341,700 MLS PIN
- 2003-04-21 Listed $349,900 MLS PIN
Cash-flow waterfall
monthlySold comps — $/sqft
last 12 mo · ≤1 miLoading sold comps…