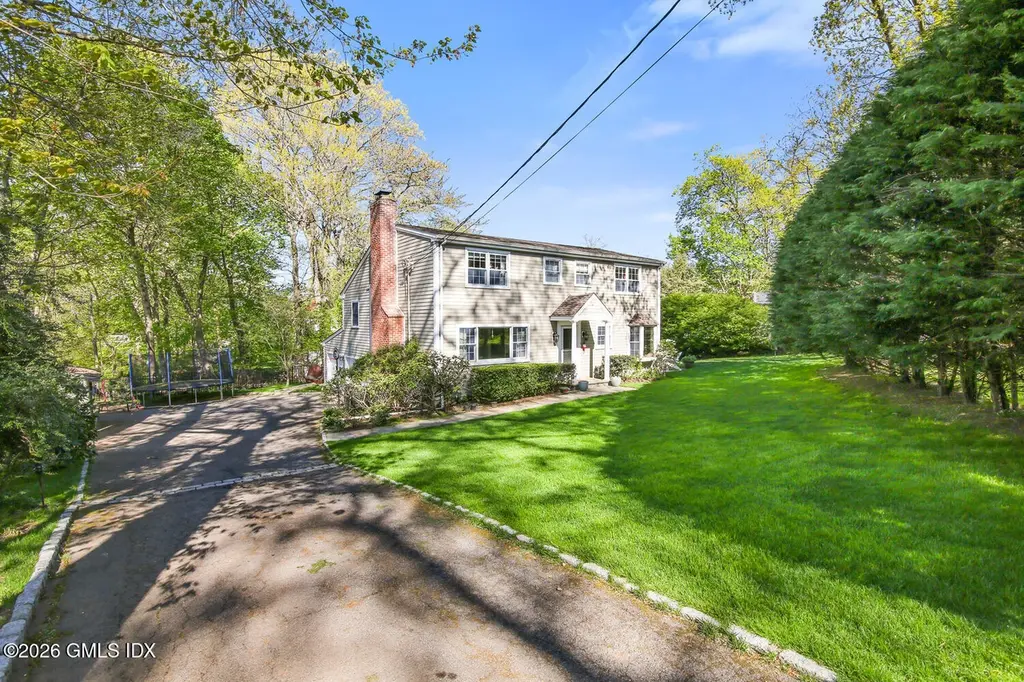
29 Coventry Ln · Riverside, CT
Flood risk 1/10 · Minimal
- FEMA flood zone
- X (unshaded)
- Chance of flooding over 30 yrs
- 0.0%
- Est. flood insurance / yr
- $473 – $860
Fire risk 1/10 · Minimal
- Est. fire insurance / yr
- $829 – $1,539
Heat risk 6/10 · Moderate
- Hot days now (above 98°F)
- 7 days/yr
- Hot days in 30 yrs
- 16 days/yr
Wind risk 6/10 · Moderate
- Chance of severe wind over 30 yrs
- 67.0%
Air-quality risk 6/10 · Moderate
- Unhealthy air days now
- 9 days/yr
- Unhealthy air days in 30 yrs
- 13 days/yr
Risk factors via First Street. Map © Google.
Why this score? — see what drove the C grade
The composite is a weighted blend of 9 inputs, each scored 0–100. Each bar is that input's sub-score; the figure is the points it added to the 100-point composite (weight × sub-score).
- ARV discount +15.0/15.0
- Cash flow +12.7/30.0
- Appreciation +8.6/10.0
- Schools +6.6/10.0
- DSCR +3.8/10.0
- Livability +3.8/5.0
- 1% rule +2.7/10.0
- Rent growth +2.5/5.0
- Condition / age +2.5/5.0
$2,100,000
🖨 Deal sheet (PDF) 📄 Offer letter ✓ Due diligence
Listing remarks
Located in one of Riverside's most desirable neighborhoods, this home offers both privacy and convenience. Sun-filled and with hardwood floors throughout, the house provides space and flow, featuring a living room with fireplace, dining room, and updated kitchen with granite countertops and stainless steel appliances. The primary bedroom with en-suite bathroom and multiple closets, along with four additional bedrooms and two baths, complete the upper level. A spacious family room opens to a private patio, ideal for indoor/outdoor living. The finished lower level offers additional flexibility with a playroom, full bath, and laundry room. Set on a beautifully landscaped lot, this home sits on
Key facts
- 0.34 acre lot
- 2 garage spots
- Built 1968
Neighborhood map
What this means for you Summary
Snapshot
- This is a 5-bed/4.0-bath single-family listed at $2.10M.
Deal economics
- At list price, monthly cash flow is $-241 ($-3k/yr) — negative.
- To cash-flow at today's rent, offer at most $2.06M (2.0% below list).
- To meet the 1% rule (rent ≥ 1% of price), the offer needs to be $1.61M (23.3% below list).
- Recommended offer: $1.61M (23.3% below list) — sets the bar for 1% rule.
- Cap rate 6.2% vs local median 3.6% in Riverside — top-decile yield for the area; either an underpriced asset or a hidden risk that comps aren't pricing in. Stress-test before assuming the spread holds.
Location & tenants
- Location reads 76/100 on livability (#60 in CT, #3,626 nationally) — a middle-class / working-renter tenant base. Strengths: crime A+, commute A+, employment A+; Watch: amenities F, cost of living F.
- Greenwich School District (suburban): math 64% / reading 73% proficiency, ranked #12 of 153 in CT (top 8%) — acceptable for families but not a draw, mixed tenant base, ~2y average lease; only 11% free/reduced lunch — higher-income household profile.
- Zoned schools: Riverside School (math 84% / reading 89%, grade A+, #4 of 553 statewide, top 1%, 435 students, 2% FRL); Eastern Middle School (math 75% / reading 81%, grade A+, #2 of 175 statewide, top 1%, 784 students, 6% FRL).
- Zoned-school proficiency averages 82% at this address vs 68% district-wide (+14 pts) — the actual schools serving this property are materially stronger than the Greenwich School District average implies; a family-tenant draw the district grade alone would hide.
- Market conditions: 45 active listings in the ZIP; 31 comparable units currently listed for rent nearby; rentals lingering (median 45d on market — plan ~5-8 weeks vacancy on turnover, expect pricing pressure); 52% of comp listings sitting > 30 days — soft ceiling on asking rent; 1,151 units permitted in Western Connecticut Planning Region in 2024 (714 in 5+ unit buildings).
Forward outlook
- In year one you build about $167k of equity ($15k loan paydown + $153k appreciation (7.3% local appreciation)).
- By year 2, paydown + projected appreciation supports a ~$268k cash-out refi (75% LTV) — recoverable capital for the next deal without selling this one.
Negotiation context
- Only 5 days on market — expect competitive offers; lowballing is unlikely to land.
- 6 sale attempts since 22y ago with the ask held roughly flat each time — persistent listings suggest the price (not the market) is what's stuck; bring a comps-based counter.
- Current owner paid $1.19M; list at $2.10M implies a 77% gain — meaningful room to come down on a strong offer.
Risks & watch-outs
- Climate carrying-cost: major wind risk, 67% chance of damaging wind over 30y; extreme-heat days projected 7→16/yr by 2055 (HVAC capex compounding) — expect insurance premiums to compound above CPI over the hold.
Questions for the listing agent
- What do current leases actually rent for vs. the listed asking? Can we see a recent rent roll and the last 12 months of T-12 income?
- Built in 1968 — when were the roof, HVAC, electrical panel, plumbing, and water heater last replaced?
- Is there a deadline driving the sale (1031 exchange, divorce, estate, relocation)? That informs how much negotiation room exists.
- Schools are A-rated — typically a magnet for longer-tenancy family renters. What's the average tenant stay here, and is there a school-zone premium baked into asking?
- What's the average days-on-market for RENTAL listings here right now (not sales)? A rising rental-DOM trend means longer vacancies and softer asking-rent achievability than the comps imply.
- What's the recent tenant-quality profile in this submarket — average credit score on applications, eviction rate, late-payment / NSF rate, and stable-employment percentage? A property-management company in the area should have these aggregated.
- How much new for-sale + rental construction is in the pipeline within 1–3 miles? Heavy new supply typically softens prices + rents 12–24 months out; constrained supply supports both.
Investment metrics
- 1% rule
- 0.77% ✗
- Cap rate
- 6.16%
- Cash-on-cash
- -0.49%
- DSCR
- 0.98
- GRM
- 10.9
CMA / ARV
- ARV (on-the-fly)
- $2,617,224
- Comps found
- 12
Show comp detail 12 sales within ~0.75 mi
| Address | Dist | Beds/Ba | Sqft | Sold | Price | $/sf | Match |
|---|---|---|---|---|---|---|---|
| 19 Coventry Ln | 0.07mi | 5/3.0 | 2,624 (+0%) | 18mo | $1,780,000 | $678 | 78 |
| 14 Tyler Ln | 0.19mi | 4/4.5 (-1) | 2,740 (+5%) | 14mo | $2,795,000 | $1,020 | 64 |
| 25 Summit Rd | 0.39mi | 4/3.0 (-1) | 2,489 (-5%) | 3mo | $2,510,000 | $1,008 | 62 |
| 39 Riverside Ave | 0.44mi | 5/4.5 | 2,775 (+6%) | 8mo | $1,995,000 | $719 | 60 |
| 37 Miltiades Ave | 0.48mi | 4/2.5 (-1) | 2,540 (-3%) | 4mo | $1,999,000 | $787 | 59 |
| 6 Miltiades Ave | 0.35mi | 5/3.5 | 2,508 (-4%) | 20mo | $2,550,000 | $1,017 | 58 |
| 153 Lockwood Rd | 0.74mi | 5/3.5 | 2,729 (+4%) | 1mo | $2,735,000 | $1,002 | 55 |
| 19 Bayside Ter | 0.40mi | 4/2.5 (-1) | 2,473 (-5%) | 14mo | $2,035,000 | $823 | 50 |
| 7 Shaw Pl | 0.46mi | 4/4.0 (-1) | 2,880 (+10%) | 9mo | $2,550,000 | $885 | 49 |
| 134 Lockwood Rd | 0.57mi | 4/3.5 (-1) | 2,879 (+10%) | 10mo | $3,150,000 | $1,094 | 41 |
| 143 Lockwood Rd | 0.66mi | 4/2.5 (-1) | 2,367 (-9%) | 6mo | $2,425,000 | $1,025 | 38 |
| 323 Riverside Ave | 0.51mi | 4/2.5 (-1) | 2,351 (-10%) | 19mo | $1,475,000 | $627 | 32 |
Match score weights: distance 35% · size 25% · config 20% · recency 20%. Top-matched comps best support the ARV.
Projected returns pro-forma
7.28% appreciation · 3.0% rent growth · sell at horizon
- IRR
- 18.0%
- Equity multiple
- 2.28×
- Total profit
- $754,091
- Equity at exit
- $1,494,430
- IRR
- 17.2%
- Equity multiple
- 4.74×
- Total profit
- $2,198,851
- Equity at exit
- $2,874,961
Cash invested: $588,000 (down + closing). Projections, not guarantees.
Landlord ↔ Tenant lean methodology
- Overall (STATE)
- 27 Tenant-Leaning
- State Connecticut
- 27 Tenant-Leaning · D+7
- County
- — inherits STATE
- City
- — inherits STATE
ZIP-level market 06878
- Home prices YoY
- 3.8%
- Active inventory
- 45
- Price-to-rent
- 10.9×
Monthly cashflow live
- Estimated rent
- $16,103 high interval (Pro) →
- Mortgage (P&I)
- −$11,013
- Tax from tax record
- −$1,074 /mo · $12,891/yr
- Insurance
- −$875
- HOA
- −$0
- Vacancy / Maint / Mgmt
- −$3,382
- Net cashflow
- $-241
Break-even live
Sensitivity live
| Price | -10% $948 | -5% $353 | +0% $-241 | +5% $-835 | +10% $-1,430 |
|---|---|---|---|---|---|
| Rent | -10% $-1,513 | -5% $-877 | +0% $-241 | +5% $395 | +10% $1,031 |
| Rate | -1.0pp $817 | -0.5pp $293 | base $-241 | +0.5pp $-785 | +1.0pp $-1,339 |
UW: 25.0% down · 7.5% · 30yr · 1.5% tax · 5.0% vac · 8.0% maint · 8.0% mgmt
Financing live
Cash to close
- Down payment
- $525,000
- Closing costs
- $63,000
- Reserves months
- —
- Total cash needed
- —
Loan-product check · same deal, 3 products live
Conventional
25% down · 7.5% · 30yr
- Down + closing
- —
- Monthly P&I
- —
- Monthly cashflow
- —
- DSCR
- —
- Eligible?
- —
Personal DTI + credit; lowest rate.
DSCR
20% down · 8.5% · 30yr
- Down + closing
- —
- Monthly P&I
- —
- Monthly cashflow
- —
- DSCR
- —
- Eligible?
- —
No personal income docs; deal must DSCR.
Hard money
10% down · 12.0% · 12mo
- Down + closing
- —
- Monthly P&I
- —
- Monthly cashflow
- —
- DSCR
- —
- Eligible?
- —
Short-term bridge; refi at stabilization.
Rent comps 31 comps
| Address | Beds | Baths | Sqft | Rent | $/sqft | DOM | Units | Dist |
|---|---|---|---|---|---|---|---|---|
| 21 Spring St Riverside, CT | 5.0 | 4.0 | 2924 | $18,000 | $6.16 | 45d | 1 | 0.33mi |
| 25 Buxton Ln Riverside, CT | 5.0 | 3.5 | 2780 | $12,995 | $4.67 | 25d | 1 | 0.45mi |
| 30 Bayside Ter Riverside, CT | 4.0 | 3.5 | 3730 | $25,000 | $6.70 | 45d | 1 | 0.45mi |
| 24 Juniper Ln Riverside, CT | 4.0 | 3.5 | 2843 | $14,000 | $4.92 | 4d | 1 | 0.47mi |
| 14 Shoalpoint Ln Riverside, CT | 4.0 | 2.5 | 2340 | $14,000 | $5.98 | 25d | 1 | 0.49mi |
| 10 Durkin Pl Riverside, CT | 5.0 | 4.5 | 3245 | $17,500 | $5.39 | 45d | 1 | 0.67mi |
| 8 Potter Dr Old Greenwich, CT | 4.0 | 3.0 | 1979 | $10,500 | $5.31 | 45d | 1 | 0.71mi |
| 1 Cary Rd Riverside, CT | 4.0 | 3.5 | 3300 | $13,500 | $4.09 | 45d | 1 | 0.77mi |
| 9 Grimes Rd Old Greenwich, CT | 5.0 | 3.5 | 2799 | $22,500 | $8.04 | 45d | 1 | 0.82mi |
| 1 Ernel Dr Riverside, CT | 5.0 | 3.5 | 2517 | $13,000 | $5.16 | 22d | 1 | 0.89mi |
| 15 Shorelands Pl Old Greenwich, CT | 4.0 | 3.5 | 3271 | $19,000 | $5.81 | 22d | 1 | 0.90mi |
| 15 Shorelands Pl Old Greenwich, CT | 4.0 | 3.5 | 3271 | $19,000 | $5.81 | 20d | 1 | 0.90mi |
| 314 Sound Beach Ave Old Greenwich, CT | 4.0 | 2.5 | 3007 | $15,500 | $5.15 | 45d | 1 | 0.91mi |
| 13 Lockwood Ave Old Greenwich, CT | 5.0 | 3.5 | 3275 | $22,000 | $6.72 | 45d | 1 | 1.00mi |
| 71 S Park Ave Old Greenwich, CT | 4.0 | 2.5 | 3723 | $17,500 | $4.70 | 45d | 1 | 1.04mi |
| 9 Valleywood Rd Cos Cob, CT | 5.0 | 3.0 | 2348 | $13,500 | $5.75 | 45d | 1 | 1.14mi |
| 8 Perry Pl Riverside, CT | 4.0 | 3.0 | 2556 | $11,500 | $4.50 | 22d | 1 | 1.14mi |
| 60 Lockwood Ave Old Greenwich, CT | 5.0 | 3.5 | 2987 | $17,500 | $5.86 | 4d | 1 | 1.18mi |
| 41 Grove St Cos Cob, CT | 5.0 | 3.5 | 2787 | $12,000 | $4.31 | 45d | 1 | 1.19mi |
| 28 Pleasant St Cos Cob, CT | 4.0 | 2.5 | 2140 | $6,250 | $2.92 | 13d | 1 | 1.25mi |
| 17 Nawthorne Rd Old Greenwich, CT | 4.0 | 2.5 | 3132 | $25,000 | $7.98 | 45d | 1 | 1.29mi |
| 11 Roosevelt Ave Old Greenwich, CT | 5.0 | 2.5 | 3430 | $21,000 | $6.12 | 45d | 1 | 1.30mi |
| 11 Roosevelt Ave Old Greenwich, CT | 5.0 | 2.5 | 3430 | $18,000 | $5.25 | 4d | 1 | 1.30mi |
| 34 Hassake Rd Old Greenwich, CT | 4.0 | 3.5 | 2943 | $16,000 | $5.44 | 45d | 1 | 1.34mi |
| 11 Annjim Dr Greenwich, CT | 5.0 | 4.0 | 2417 | $19,500 | $8.07 | 15d | 1 | 1.35mi |
| 11 Osee Pl Cos Cob, CT | 5.0 | 4.0 | 3112 | $12,000 | $3.86 | 45d | 1 | 1.36mi |
| 147 Shore Rd Old Greenwich, CT | 4.0 | 3.5 | 3372 | $15,500 | $4.60 | 45d | 1 | 1.37mi |
| 15 Lancer Rd Riverside, CT | 4.0 | 2.5 | 3031 | $8,889 | $2.93 | 25d | 1 | 1.43mi |
| 17 Ballwood Rd Old Greenwich, CT | 4.0 | 2.0 | 2067 | $10,500 | $5.08 | 22d | 1 | 1.47mi |
| 14 Rainbow Dr Riverside, CT | 5.0 | 3.5 | 3510 | $16,000 | $4.56 | 25d | 1 | 1.48mi |
| 1 Crawford Ter Riverside, CT | 4.0 | 4.0 | 2819 | $18,000 | $6.39 | 22d | 1 | 1.49mi |
Listing history 14 events
-
2026-04-08status Pending
-
2026-04-03$2,100,000 Active
-
2026-03-30historical $2,100,000
-
2021-06-14historical Cancelled
-
2021-06-11historical
-
2021-05-09$1,945,000 Active
-
2021-05-06$1,945,000 Active
-
2015-11-02historical
-
2015-10-30historical
-
2015-06-02$1,645,000
-
2015-04-14$1,645,000
-
2005-01-13soldstatus $1,189,000
-
2005-01-12soldstatus $1,189,000
-
2004-12-01$1,195,000
ⓘ Source: listings_history table (triggers on properties + properties_extension) + one-shot
backfill from property_details.listing_events for pre-trigger history.
Tax reassessment forecast CT · Partial reset (capped growth)
- Current annual tax
- $12,891 · $1,074/mo
- Projected year-2 tax
- $28,916 · $2,410/mo
- Expected delta
- +$16,024/yr (+$1,335/mo · 124.3%)
ⓘ Screening estimate from a state-policy table — verify with the county assessor before closing.
Climate risk First Street
- Flood 1/10 Low FEMA zone X (unshaded) · 0% chance over 30 yrs
- Wildfire 1/10 Low
- Heat 6/10 Major 7 d/yr ≥98°F today · 16 d/yr by 30 yrs out
- Wind 6/10 Major 67% chance of damaging wind over 30 yrs
- Air quality 6/10 Major 9 unhealthy d/yr today · 13 by 30 yrs out
Nearby sold comps map
Loading sold comps map…
Walkable amenities ~0.75 mi
Loading nearby amenities…
Taxation est. · year 1
- Rental income
- $193,230
- − Mortgage interest
- −$117,633
- − Property taxes
- −$12,891
- − Insurance
- −$10,500
- − Repairs & maintenance
- −$15,458
- − Management
- −$15,458
- − Depreciation
- −$61,091
- Taxable loss
- −$39,801
- Est. tax savings @ 24.0%
- +$9,552
- After-tax cash flow
- $6,662/yr
For passive investors: Depreciation is non-cash, so a rental often shows a tax loss while cash-flowing — sheltering income. Rental losses are passive: they offset passive income freely, and up to $25,000/yr can offset ordinary (W-2) income if you actively participate and your MAGI is under $100k (phasing out to $0 by $150k); unused losses carry forward. On sale, claimed depreciation is recaptured at up to 25%, and gains may owe capital-gains tax (a 1031 exchange can defer both). Figures are a year-1 estimate at your 24.0% rate — not tax advice; consult a CPA.
Schools (NCES district)
- District
- Greenwich School District
- NCES district ID
- 0901710
- Math proficiency
- 64% ▼ -7.00%
- Reading proficiency
- 73% ▼ -5.00%
- Median HH income
- $129,257
- Composite
- 65.67/100
- National rank
- #461
- State rank
- #12 of 153 in CT
Livability — Riverside
- Score
- 76/100
- State rank
- #60
- US rank
- #3626
Category grades
Schools grade is shown separately in the Schools card above.
Census & demographics
- Census place
- Riverside, CT
- City population
- 8,446
- Population (ZIP)
- 8,446
Population outlook (Western Connecticut County) Hauer SSP2
- By 2040
- 685,031
Race, ethnicity, and origin ACS 2023
- Neighborhood character
- Diverse neighborhood (Simpson 0.57)
- Race & ethnicity
- White 62% Hispanic / Latino 16% Asian 13% Two or more races 12% Black 3% Native American 2%
- Hispanic origin (detail)
- Mexican 4% Salvadoran 5%
- Common ancestry
- Slovak 3% Italian 3% Lithuanian 3%
- Foreign-born
- 31% · Canada, Dominican Republic, China
- Languages at home
- 64% English-only · Spanish 16% Russian/Polish/Slavic 5% Other Indo-European 3%
Political lean MEDSL · Western Connecticut
- 2024 margin
- D (+19.1) · D 58.8% · R 39.7% · Other 1.6%
- All cycles
- 2024: D+19.1
Not yet ingested
- Civics
- —
Market trends
- HPI YoY
- ▲ 7.28%
- Current HPI
- 198.3808
- Rent YoY
- —
- Metro
- —
- State GDP YoY
- ▲ 1.06%
- F500 in state
- 38
Industry mix (Fortune 500 HQ in CT)
| Industry | F500 HQs | Revenue |
|---|---|---|
| Industrial Machinery | 4 | $38B |
|
||
| Insurance | 3 | $71B |
|
||
| Financial Services | 2 | $25B |
|
||
| Transportation / Logistics | 2 | $18B |
|
||
| Healthcare | 1 | $247B |
|
||
| Telecommunications | 1 | $55B |
|
||
Price history
+75.7% since first listed14 events — show timeline
- 2026-04-08 Pending — GMLS
- 2026-04-03 Listed $2,100,000 GMLS
- 2026-03-30 Coming Soon $2,100,000 GMLS
- 2021-06-14 Delisted — GMLS
- 2021-06-11 Listing Removed — Smart MLS
- 2021-05-09 Listed $1,945,000 Smart MLS
- 2021-05-06 Listed $1,945,000 GMLS
- 2015-11-02 Delisted — GMLS
- 2015-10-30 Listing Removed — Smart MLS
- 2015-06-02 Listed $1,645,000 Smart MLS
- 2015-04-14 Listed $1,645,000 GMLS
- 2005-01-13 Sold (Public Records) $1,189,000 Public Records
- 2005-01-12 Sold (MLS) $1,189,000 GMLS
- 2004-12-01 Listed $1,195,000 GMLS
Property tax history
+4.5%/yrLatest (2023): $12,891 · +0.9% YoY. Source: county tax records.
Cash-flow waterfall
monthlySold comps — $/sqft
last 12 mo · ≤1 miLoading sold comps…