 5-Plex
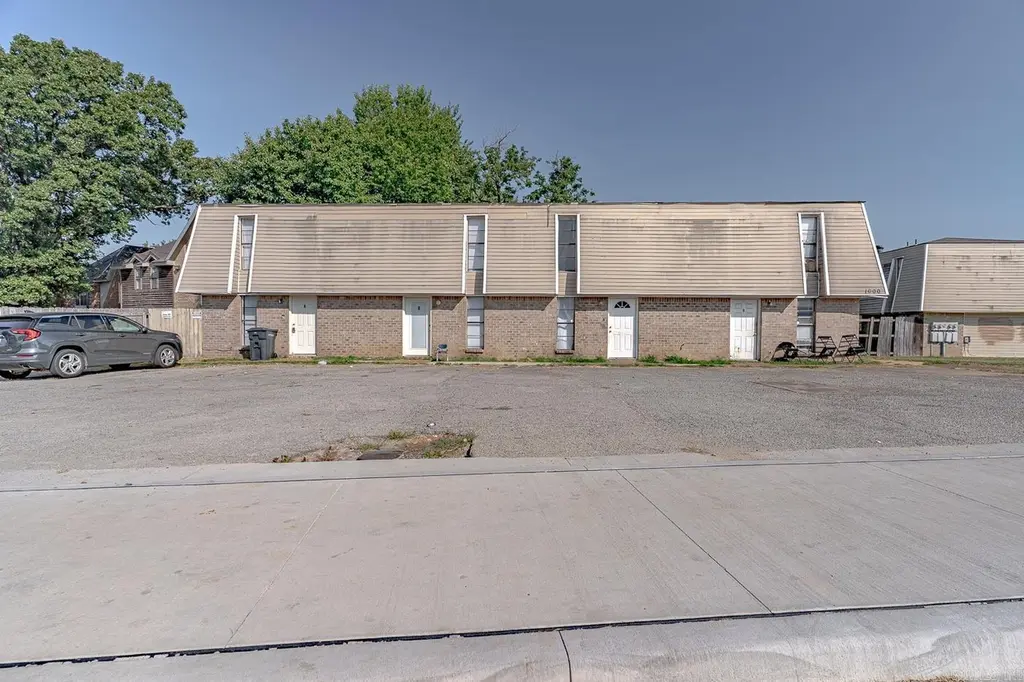
1900 Cedar Heights Dr · Jonesboro, AR
Flood risk 1/10 · Minimal
- FEMA flood zone
- X
- Chance of flooding over 30 yrs
- 0.0%
- Est. flood insurance / yr
- $507 – $1,088
Fire risk 4/10 · Minor
- Est. fire insurance / yr
- $1,499 – $2,785
Heat risk 6/10 · Moderate
- Hot days now (above 108°F)
- 7 days/yr
- Hot days in 30 yrs
- 22 days/yr
Wind risk 3/10 · Minor
- Chance of severe wind over 30 yrs
- 6.0%
Air-quality risk 1/10 · Minimal
- Unhealthy air days now
- 0 days/yr
- Unhealthy air days in 30 yrs
- 0 days/yr
Risk factors via First Street. Map © Google.
Why this score? — see what drove the B- grade
The composite is a weighted blend of 9 inputs, each scored 0–100. Each bar is that input's sub-score; the figure is the points it added to the 100-point composite (weight × sub-score).
- Cash flow +30.0/30.0
- 1% rule +10.0/10.0
- DSCR +10.0/10.0
- ARV discount +7.5/15.0
- Rent growth +3.4/5.0
- Livability +3.2/5.0
- Schools +2.3/10.0
- Condition / age +2.2/5.0
- Appreciation +0.0/10.0
$399,900
🖨 Deal sheet 📄 Offer letter ✓ Due diligence
Multi-family units
County records classify this as Multi-Family (2-4 Unit). Listing-text estimate: 5 units. estimate disagrees with records
Listing remarks
Welcome to the Multifamily Market 1900 Cedar Heights Dr and 405 Melrose St of the Cedar Heights 1st Addition in Jonesboro, Arkansas, within the Jonesboro School District. Opportunity Knocks! This prime piece of rental property offers 2 fourplexes totaling 8 income-producing units. The exteriors are wrapped in brick and vinyl, topped with 3-tab shingles, and accented by a parking lot, mature shade trees, and a small patio at each unit. The interior of each unit includes 2 bedrooms, 1.5 bathrooms, a living room and kitchen, and washer and dryer hookups. Each unit contains a refrigerator and stove and tenants pay electric. Occupied units are rented at $650 per month. Conveniently located near
Key facts
- Mature shade trees
- Conveniently located
- 0.44 acre lot
Tags
Property features AI
Finance
- Other: Approximate building size 6,716 sq ft; Approximate lot size 0.44 acres (tax records); Will not subdivide
- Financial info: Potential financing available: Cash or in-house financing; Taxes, insurance, and utilities are included in expenses; Tenants are responsible for cable and electric; Minimum and maximum 2-bedroom rent listed at $650 per unit
Exterior
- Parking: Assigned garage parking
- Utilities: Municipal electric; Public water; Public sewer
- Home design: Multifamily building (8-unit); R-1 zoning
- Construction: Slab foundation
- Exterior features: Brick and metal/vinyl siding exterior; Rolled roof; Paved road access; Property is level and located in a subdivision; Inside city limits
Interior
- Kitchen: Built-in stove in units
- Bedrooms: Eight 2-bedroom units
- Flooring: Laminate flooring; Tile flooring
- Bathrooms: Each unit has 1.5 baths
- Heating & cooling: Central electric heating; Central electric cooling
- Interior features: Washer and dryer connections in units; All units share common features
- Laundry & utility: Washer connection; Dryer connection (electric)
Neighborhood map
What this means for you Summary
Snapshot
- This is a 5 × 2-bed/?-bath units multifamily listed at $400k. Condition is rated fair.
Deal economics
- At list price, monthly cash flow is $2k ($27k/yr) — positive. Per door: $444/mo.
- The deal already cash-flows at list — no discount required.
- Meets the 1% rule at list price ($6k rent vs $400k).
- Recommended offer: $376k (6.0% below list) — sets the bar for market timing.
- Cap rate 13.0% vs local median 4.4% in Jonesboro — top-decile yield for the area; either an underpriced asset or a hidden risk that comps aren't pricing in. Stress-test before assuming the spread holds.
Location & tenants
- Location reads 65/100 on livability (#145 in AR) — a middle-class / working-renter tenant base. Strengths: cost of living A+, housing A+, health & safety A+; Watch: crime F, amenities F, commute F.
- Jonesboro School District (urban): math 28% / reading 28% proficiency, ranked #169 of 238 in AR (top 71%) — low school quality limits family demand, transient renter base, plan for 1-2y turnover; 67% free/reduced lunch — lower-income household profile, screen leases tightly.
- Zoned schools: The Academies At Jonesboro High School (math 16% / reading 27%, grade F, #225 of 292 statewide, top 78%, 1,386 students, 100% FRL) — zoned schools average 100% FRL vs 67% district-wide (33 pts higher); higher-poverty schools than district average — tighter screening recommended.
- Market conditions: Rents rising (+3.6%/yr); 295 active listings in the ZIP; 926 units permitted in Craighead County in 2024 (69 in 5+ unit buildings).
- At $6,309/mo this rent would consume 167% of the median local household income ($45k/yr) (locally 2606% of renters already pay >50% of income on rent) — very limited rent-growth headroom before tenants either downsize or default.
Forward outlook
- Local home prices are declining (-3.0%/yr); year-one equity from $3k of loan paydown is wiped out by about $12k of value loss. Plan a longer hold.
- Craighead County population projected at +38% by 2050 — long-run rental-demand tailwind backs the buy-and-hold thesis.
- At projected returns (-3.0% appreciation + 3.6% rent growth), your $112k cash investment doubles in ~5 years — after that, you're playing with house money.
Negotiation context
- It's been on market 62 days — a 6% lower offer ($376k) is reasonable based on typical stale-listing flexibility.
- 4 sale attempts since 7y ago with the ask held roughly flat each time — persistent listings suggest the price (not the market) is what's stuck; bring a comps-based counter.
Risks & watch-outs
- Climate carrying-cost: extreme-heat days projected 7→22/yr by 2055 (HVAC capex compounding) — expect insurance premiums to compound above CPI over the hold.
Questions for the listing agent
- It's been on market 62 days. Have you received any prior offers? Is the seller open to a 6% concession, seller financing, or rate buy-down credit?
- Can we see the unit-by-unit rent roll, current vacancy, and any below-market leases? What's the average tenancy length?
- What capital expenditures (roof, boiler, parking lot, exteriors) have been made in the last 5 years, and what's planned in the next 2?
- Have any recent inspections been done? Can we get a copy of the seller's disclosures and any deferred-maintenance estimates?
- Why hasn't it sold? Are there any deal-killer items the seller is aware of (foundation, flood, title, zoning, code violations)?
- Is there a deadline driving the sale (1031 exchange, divorce, estate, relocation)? That informs how much negotiation room exists.
- Schools are D-rated, which usually means shorter tenancies and higher turnover. Who's the typical renter profile here, and what's been the actual vacancy rate?
- Crime grade is F in this area — have there been break-ins, vandalism, or insurance claims at this property in the last 3 years? What carrier currently insures it and at what premium?
- What's the average days-on-market for RENTAL listings here right now (not sales)? A rising rental-DOM trend means longer vacancies and softer asking-rent achievability than the comps imply.
- What's the recent tenant-quality profile in this submarket — average credit score on applications, eviction rate, late-payment / NSF rate, and stable-employment percentage? A property-management company in the area should have these aggregated.
- How much new apartment / multifamily construction is in the pipeline within 1–3 miles? Heavy new supply (>2% of stock underway) typically softens rents 12–24 months out; light construction supports rent growth.
Investment metrics
- 1% rule
- 1.58% ✓
- Cap rate
- 12.96%
- Cash-on-cash
- 23.80%
- DSCR
- 2.06
- GRM
- 5.3
CMA / ARV
No comps found within radius.
Projected returns pro-forma
-3.0% appreciation · 3.64% rent growth · sell at horizon
- IRR
- 17.7%
- Equity multiple
- 1.72×
- Total profit
- $80,807
- Equity at exit
- $59,626
- IRR
- 26.6%
- Equity multiple
- 3.41×
- Total profit
- $269,855
- Equity at exit
- $34,576
Cash invested: $111,972 (down + closing). Projections, not guarantees.
Landlord ↔ Tenant lean methodology
- Overall (STATE)
- 92 Strongly Landlord-Friendly
- State Arkansas
- 92 Strongly Landlord-Friendly · R+14
- County
- — inherits STATE
- City
- — inherits STATE
ZIP-level market 72401
- Home prices YoY
- -34.2%
- Rents YoY
- 3.6%
- Active inventory
- 295
- Price-to-rent
- 26.4×
Monthly cashflow live
- Estimated rent
- $6,309 medium interval (Pro) →
- Mortgage (P&I)
- −$2,097
- Tax est. 1.5%
- −$500 /mo · $5,998/yr
- Insurance
- −$167
- HOA
- −$0
- Vacancy / Maint / Mgmt
- −$1,325
- Net cashflow
- $2,220
Break-even live
5-unit breakdown (identical units grouped — click to expand)
| Units | Beds | Baths | Est. rent |
|---|---|---|---|
| 5× units | 2 | — | $6,310 |
| #1 | 2 | — | $1,262 |
| #2 | 2 | — | $1,262 |
| #3 | 2 | — | $1,262 |
| #4 | 2 | — | $1,262 |
| #5 | 2 | — | $1,262 |
| Total (5 units) | $6,309 | ||
UW: 25.0% down · 7.5% · 30yr · 1.5% tax · 5.0% vac · 8.0% maint · 8.0% mgmt
Financing live
Cash to close
- Down payment
- $99,975
- Closing costs
- $11,997
- Reserves months
- —
- Total cash needed
- —
Loan-product check · same deal, 3 products live
Conventional
25% down · 7.5% · 30yr
- Down + closing
- —
- Monthly P&I
- —
- Monthly cashflow
- —
- DSCR
- —
- Eligible?
- —
Personal DTI + credit; lowest rate.
DSCR
20% down · 8.5% · 30yr
- Down + closing
- —
- Monthly P&I
- —
- Monthly cashflow
- —
- DSCR
- —
- Eligible?
- —
No personal income docs; deal must DSCR.
Hard money
10% down · 12.0% · 12mo
- Down + closing
- —
- Monthly P&I
- —
- Monthly cashflow
- —
- DSCR
- —
- Eligible?
- —
Short-term bridge; refi at stabilization.
Listing history 23 events
-
2026-06-19days on market $399,900 Active 62 DOM
-
2026-06-18days on market $399,900 Active 61 DOM
-
2026-06-17days on market $399,900 Active 60 DOM
-
2026-06-16days on market $399,900 Active 59 DOM
-
2026-06-15days on market $399,900 Active 58 DOM
-
2026-06-14days on market $399,900 Active 56 DOM
-
2026-06-13days on market $399,900 Active 55 DOM
-
2026-06-10days on market $399,900 Active 53 DOM
-
2026-06-09days on market $399,900 Active 52 DOM
-
2026-06-08days on market $399,900 Active 51 DOM
-
2026-06-07days on market $399,900 Active 50 DOM
-
2026-06-05days on market $399,900 Active 47 DOM
-
2026-06-02days on market $399,900 Active 45 DOM
-
2026-06-01days on market $399,900 Active 44 DOM
-
2026-05-31days on market $399,900 Active 43 DOM
-
2026-05-30days on market $399,900 Active 42 DOM
-
2026-04-18$399,900 New Listing
-
2026-03-03historical
-
2025-10-25price $249,900
-
2025-10-24price $249,900
-
2025-09-11$259,900 Active
-
2025-09-10$259,900 New Listing
-
2019-02-18$160,000
ⓘ Source: listings_history table (triggers on properties + properties_extension) + one-shot
backfill from property_details.listing_events for pre-trigger history.
Climate risk First Street
- Flood 1/10 Low FEMA zone X · 0% chance over 30 yrs
- Wildfire 4/10 Moderate
- Heat 6/10 Major 7 d/yr ≥108°F today · 22 d/yr by 30 yrs out
- Wind 3/10 Moderate 6% chance of damaging wind over 30 yrs
- Air quality 1/10 Low 0 unhealthy d/yr today · 0 by 30 yrs out
Nearby sold comps map
Loading sold comps map…
Walkable amenities ~0.75 mi
Loading nearby amenities…
Taxation est. · year 1
- Rental income
- $75,708
- − Mortgage interest
- −$22,401
- − Property taxes
- −$5,998
- − Insurance
- −$2,000
- − Repairs & maintenance
- −$6,057
- − Management
- −$6,057
- − Depreciation
- −$11,633
- Taxable income
- $21,563
- Est. tax owed @ 24.0%
- −$5,175
- After-tax cash flow
- $21,471/yr
For passive investors: Depreciation is non-cash, so a rental often shows a tax loss while cash-flowing — sheltering income. Rental losses are passive: they offset passive income freely, and up to $25,000/yr can offset ordinary (W-2) income if you actively participate and your MAGI is under $100k (phasing out to $0 by $150k); unused losses carry forward. On sale, claimed depreciation is recaptured at up to 25%, and gains may owe capital-gains tax (a 1031 exchange can defer both). Figures are a year-1 estimate at your 24.0% rate — not tax advice; consult a CPA.
Condition & rehab AI · 12 photos
This multifamily property requires moderate rehabilitation to improve its condition and increase its value. Key areas for improvement include the exterior, roof, and flooring.
Repairs flagged
- Major siding — Severe weathering
- Major roof — 3-tab shingles, potential leaks
- Major flooring — Tile flooring, dull and stained
Value-add opportunities
- Both paint and update exterior — Enhances curb appeal and interior aesthetics
- Both replace flooring — Improves living space and rental appeal
- Both update bathrooms — Enhances living space and rental appeal
Renovation cost estimate screening
| Repair item | Severity | Est. cost |
|---|---|---|
| siding · Severe weathering | Major | $15,000–50,000 |
| roof · 3-tab shingles, potential leaks | Major | $15,000–50,000 |
| flooring · Tile flooring, dull and stained | Major | $15,000–50,000 |
| Total estimated repair cost · 3 items | $45,000–150,000 |
Value-add ROI direction
- Both paint and update exterior — Enhances curb appeal and interior aesthetics ↑
- Both replace flooring — Improves living space and rental appeal ↑
- Both update bathrooms — Enhances living space and rental appeal ↑
ⓘ Cost ranges are severity-bucket heuristics (US national rule-of-thumb). Get contractor quotes + a written scope before underwriting a rehab budget.
Schools (NCES district)
- District
- Jonesboro School District
- NCES district ID
- 0508280
- Math proficiency
- 28% ▼ -9.00%
- Reading proficiency
- 28% ▼ -8.00%
- Median HH income
- $34,347
- Composite
- 23.06/100
- National rank
- #7967
- State rank
- #169 of 238 in AR
Livability — Jonesboro
- Score
- 65/100
- State rank
- #145
- US rank
- #12692
Category grades
Schools grade is shown separately in the Schools card above.
Census & demographics
- Census place
- Jonesboro, AR
- County
- Craighead County · 97,185 people
- City population
- 91,245
- Metro
- Jonesboro, AR
- Population (ZIP)
- 42,602
- Household income
- $45,329
- Rent vs Own
- Severe rent burden
- 2606.0
Population outlook (Craighead County) Hauer SSP2
- Today (2025)
- 122,235 people
- By 2030
- 131,338 · +7.4%
- By 2040
- 149,862 · +22.6%
- By 2050
- 168,034 · +37.5%
- By 2075
- 208,094 · +70.2%
- By 2100
- 233,251 · +90.8%
Race, ethnicity, and origin ACS 2023
- Neighborhood character
- Diverse neighborhood (Simpson 0.56)
- Race & ethnicity
- White 60% Black 26% Hispanic / Latino 9% Two or more races 7%
- Hispanic origin (detail)
- Mexican 8%
- Common ancestry
- Slovak 2% Italian 1% Lithuanian 1%
- Foreign-born
- 4% · Canada
- Languages at home
- 92% English-only · Spanish 7%
Political lean MEDSL · Craighead
- 2024 margin
- Solid R (+37.4) · D 30.1% · R 67.5% · Other 2.4%
- 2008→2024 swing
- -12.9pp toward R · 2008: -24.5pp · 2024: -37.4pp
- All cycles
- 2024: R+37.4 2020: R+35.4 2016: R+35.2 2012: R+31.1 2008: R+24.5
Not yet ingested
- Civics
- —
Market trends
- HPI YoY
- ▼ -108.25%
- Current HPI
- 208.2079
- Rent YoY
- ▲ 3.64%
- Metro
- Jonesboro, AR
- State GDP YoY
- ▲ 3.80%
- F500 in state
- 10
Industry mix (Fortune 500 HQ in AR)
| Industry | F500 HQs | Revenue |
|---|---|---|
| Retail | 1 | $681B |
|
||
| Food / Agriculture | 1 | $53B |
|
||
| Retail / Energy | 1 | $22B |
|
||
| Transportation / Logistics | 1 | $12B |
|
||
| Energy | 1 | $4B |
|
||
Price history
+149.9% since first listed7 events — show timeline
- 2026-04-18 Listed $399,900 CARMLS
- 2026-03-03 Listing Removed — CARMLS
- 2025-10-25 Price Changed $249,900 CARMLS
- 2025-10-24 Price Changed $249,900 NEABOR MLS
- 2025-09-11 Listed $259,900 NEABOR MLS
- 2025-09-10 Listed $259,900 CARMLS
- 2019-02-18 Listed $160,000 NEABOR MLS
Cash-flow waterfall
monthlySold comps — $/sqft
last 12 mo · ≤1 miLoading sold comps…