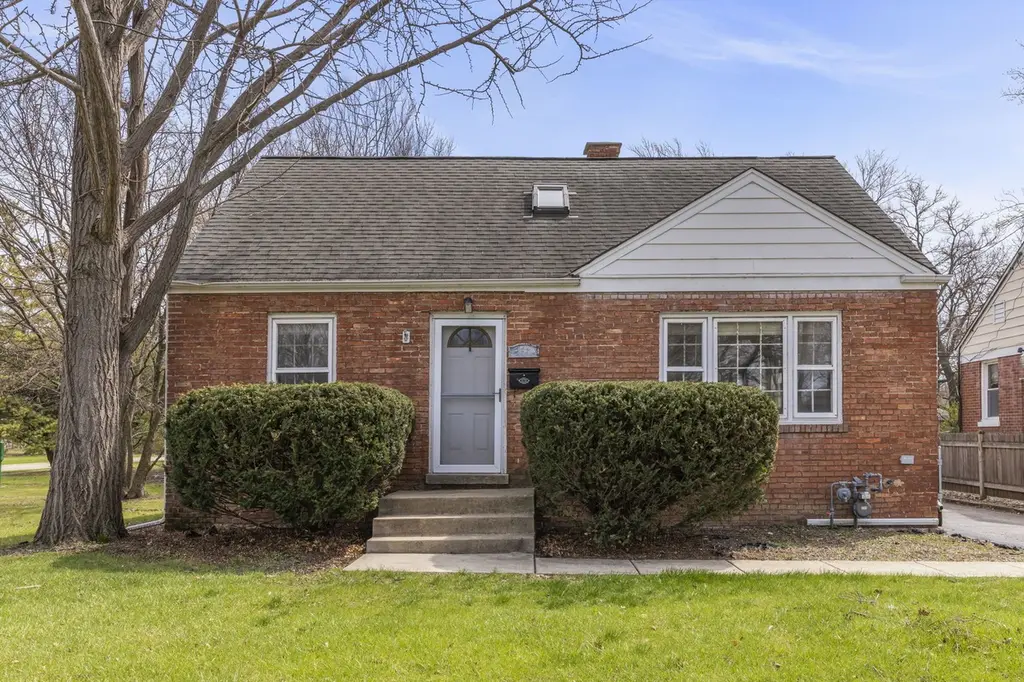
261 Melrose Ave · Elmhurst, IL
Flood risk 1/10 · Minimal
- FEMA flood zone
- X (unshaded)
- Chance of flooding over 30 yrs
- 0.0%
- Est. flood insurance / yr
- $507 – $1,088
Fire risk 1/10 · Minimal
- Est. fire insurance / yr
- $804 – $1,492
Heat risk 2/10 · Minimal
- Hot days now (above 100°F)
- 7 days/yr
- Hot days in 30 yrs
- 13 days/yr
Wind risk 2/10 · Minimal
- Chance of severe wind over 30 yrs
- 0.0%
Air-quality risk 4/10 · Minor
- Unhealthy air days now
- 6 days/yr
- Unhealthy air days in 30 yrs
- 7 days/yr
Risk factors via First Street. Map © Google.
Why this score? — see what drove the D+ grade
The composite is a weighted blend of 9 inputs, each scored 0–100. Each bar is that input's sub-score; the figure is the points it added to the 100-point composite (weight × sub-score).
- Cash flow +13.4/30.0
- ARV discount +13.1/15.0
- Livability +4.4/5.0
- Schools +4.2/10.0
- DSCR +4.0/10.0
- 1% rule +3.7/10.0
- Rent growth +3.5/5.0
- Condition / age +2.5/5.0
- Appreciation +0.0/10.0
$375,000
🖨 Deal sheet 📄 Offer letter ✓ Due diligence
Listing remarks MLS
Build your dream home or renovate this solid starter on a quiet, low-traffic cul-de-sac surrounded by friendly neighbors. Located in the highly sought-after Field Elementary (new state-of-the-art school) and Sandburg Middle School districts. Endless potential to expand or create a custom home, or rehab the existing brick home into a charming 3-bedroom residence. Prime location-just 1 mile to downtown Elmhurst and the train, and only 1 block to Field Elementary. Incredible opportunity at an attractive price in a strong, established neighborhood. Love Elmhurst * Love Local
Key facts
- Updated bath
- Large patio
- Deck
Tags
Property features AI
Finance
- Other: Parcel number 0336402014
- HOA & community: No master association fee required
Exterior
- Parking: Detached garage on asphalt; About 2.5 garage/total parking spaces
- Security: CO detectors
- Utilities: Water from Lake Michigan; Public sewer and storm sewer; Electric with circuit breakers
- Home design: Detached single-family home; 1.5-story layout; Fee simple ownership; Built approximately 71–80 years ago; Vinyl siding and brick exterior
- Construction: Vinyl siding and brick construction; Built before 1978
- Exterior features: Lot approximately 50 x 125; Lot less than 0.25 acre; Curbs, sidewalks, street lights, paved streets; Commuter bus and train access; close to interstate
Interior
- Kitchen: Eating area with breakfast bar and space for table; Range; Microwave; Dishwasher; Refrigerator; Vinyl flooring in kitchen
- Bedrooms: Master bedroom on second level (hardwood floors); Two main-level bedrooms, approx. 13 x 13 and 13 x 10 (hardwood floors)
- Flooring: Hardwood throughout main living areas; Vinyl in kitchen
- Bathrooms: One full bathroom on first floor
- Heating & cooling: Natural gas forced air heating; Central air conditioning
- Interior features: First-floor bedroom; First-floor full bathroom; Combined dining and living room; Unfinished full basement; Six total rooms; CO detectors; Ceiling fan(s)
- Laundry & utility: Interior laundry room
Neighborhood map
What this means for you Summary
Snapshot
- This is a 3-bed/1.0-bath single-family listed at $375k.
Deal economics
- At list price, monthly cash flow is $9 ($104/yr) — positive.
- The deal already cash-flows at list — no discount required.
- To meet the 1% rule (rent ≥ 1% of price), the offer needs to be $326k (13.2% below list).
- Recommended offer: $326k (13.2% below list) — sets the bar for 1% rule.
- Cap rate 6.3% vs local median 2.4% in Elmhurst — top-decile yield for the area; either an underpriced asset or a hidden risk that comps aren't pricing in. Stress-test before assuming the spread holds.
Location & tenants
- Location reads 87/100 on livability (#11 in IL, #268 nationally) — a professional / high-income tenant draw. Strengths: crime A+, commute A+, employment A+; Watch: cost of living F.
- Elmhurst SD 205 (suburban): math 44% / reading 44% proficiency, ranked #72 of 620 in IL (top 12%) — families likely to look elsewhere, expect single-tenant / working-renter base with shorter leases; only 12% free/reduced lunch — higher-income household profile.
- Zoned schools: Field Elem School (math 50% / reading 55%, grade C-, #143 of 2,056 statewide, top 7%, 399 students, 0% FRL); Sandburg Middle School (math 45% / reading 48%, grade D+, #78 of 665 statewide, top 12%, 618 students, 0% FRL); York Comm High School (math 54% / reading 53%, grade C-, #32 of 693 statewide, top 5%, 2,707 students, 0% FRL).
- Market conditions: Rents rising fast (+4.0%/yr); 126 active listings in the ZIP; 8 comparable units currently listed for rent nearby; rentals at typical pace (median 15d on market — plan ~3-4 weeks tenant-placement turnaround); high-income renter base; 1,378 units permitted in DuPage County in 2024 (594 in 5+ unit buildings).
Forward outlook
- Local home prices are declining (-3.0%/yr); year-one equity from $3k of loan paydown is wiped out by about $11k of value loss. Plan a longer hold.
Negotiation context
- It's been on market 48 days — a 3% lower offer ($364k) is reasonable based on typical stale-listing flexibility.
- 2 sale attempts with the ask held roughly flat each time — persistent listings suggest the price (not the market) is what's stuck; bring a comps-based counter.
- Current owner paid $254k; 47% above their basis — modest negotiation headroom, anchor on the comps not their cost.
Risks & watch-outs
- Watch-outs: built in 1950 — expect roof / HVAC / electrical / plumbing capex.
Questions for the listing agent
- It's been on market 48 days. Have you received any prior offers? Is the seller open to a 13% concession, seller financing, or rate buy-down credit?
- Built in 1950 — when were the roof, HVAC, electrical panel, plumbing, and water heater last replaced?
- Is there a deadline driving the sale (1031 exchange, divorce, estate, relocation)? That informs how much negotiation room exists.
- Schools are A-rated — typically a magnet for longer-tenancy family renters. What's the average tenant stay here, and is there a school-zone premium baked into asking?
- The area grade is low — what's the realistic commute time and amenity access for the typical tenant pool here? Any planned neighborhood developments (good or bad) we should know about?
- What's the average days-on-market for RENTAL listings here right now (not sales)? A rising rental-DOM trend means longer vacancies and softer asking-rent achievability than the comps imply.
- What's the recent tenant-quality profile in this submarket — average credit score on applications, eviction rate, late-payment / NSF rate, and stable-employment percentage? A property-management company in the area should have these aggregated.
- How much new for-sale + rental construction is in the pipeline within 1–3 miles? Heavy new supply typically softens prices + rents 12–24 months out; constrained supply supports both.
Investment metrics
- 1% rule
- 0.87% ✗
- Cap rate
- 6.32%
- Cash-on-cash
- 0.10%
- DSCR
- 1.00
- GRM
- 9.6
CMA / ARV
- ARV (median comp)
- $428,249
- List price
- $375,000
- Delta
- -12.43%
- Verdict
- UNDERPRICED
- Comps
- 20 within 1.0 mi
Show comp detail 9 sales within ~0.75 mi
| Address | Dist | Beds/Ba | Sqft | Sold | Price | $/sf | Match |
|---|---|---|---|---|---|---|---|
| 227 E North Ave | 0.30mi | 3/2.0 | 1,216 (-2%) | 18mo | $305,000 | $251 | 64 |
| 293 N Willow Rd | 0.32mi | 3/2.5 | 1,336 (+8%) | 8mo | $710,000 | $531 | 60 |
| 150 N Caroline Ave | 0.56mi | 3/1.5 | 1,227 (-1%) | 14mo | $480,000 | $391 | 58 |
| 529 N Indiana St | 0.57mi | 3/1.5 | 1,263 (+2%) | 13mo | $380,000 | $301 | 57 |
| 132 E Gladys Ave | 0.72mi | 3/2.5 | 1,218 (-2%) | 2mo | $510,000 | $419 | 56 |
| 573 N Emroy Ave | 0.50mi | 3/1.0 | 1,129 (-9%) | 18mo | $333,000 | $295 | 47 |
| 589 N Willow Rd | 0.64mi | 3/1.0 | 1,120 (-10%) | 20mo | $340,000 | $304 | 37 |
| 222 E Crestview Ave | 0.71mi | 3/1.0 | 1,100 (-11%) | 18mo | $269,000 | $245 | 33 |
| 212 E Gladys Ave | 0.60mi | 2/2.0 (-1) | 1,113 (-10%) | 22mo | $400,000 | $359 | 28 |
Match score weights: distance 35% · size 25% · config 20% · recency 20%. Top-matched comps best support the ARV.
Projected returns pro-forma
-3.0% appreciation · 4.0% rent growth · sell at horizon
- IRR
- -15.0%
- Equity multiple
- 0.46×
- Total profit
- $-56,873
- Equity at exit
- $55,914
- IRR
- -4.8%
- Equity multiple
- 0.67×
- Total profit
- $-34,826
- Equity at exit
- $32,423
Cash invested: $105,000 (down + closing). Projections, not guarantees.
Landlord ↔ Tenant lean methodology
- Overall (STATE)
- 43 Moderately Tenant-Leaning
- State Illinois
- 43 Moderately Tenant-Leaning · D+7
- County
- — inherits STATE
- City
- — inherits STATE
ZIP-level market 60126
- Rents YoY
- 4.0%
- Active inventory
- 126
- Price-to-rent
- 9.6×
Monthly cashflow live
- Estimated rent
- $3,256 high interval (Pro) →
- Mortgage (P&I)
- −$1,967
- Tax from tax record
- −$441 /mo · $5,290/yr
- Insurance
- −$156
- HOA
- −$0
- Vacancy / Maint / Mgmt
- −$684
- Net cashflow
- $9
Break-even live
UW: 25.0% down · 7.5% · 30yr · 1.5% tax · 5.0% vac · 8.0% maint · 8.0% mgmt
Financing live
Cash to close
- Down payment
- $93,750
- Closing costs
- $11,250
- Reserves months
- —
- Total cash needed
- —
Loan-product check · same deal, 3 products live
Conventional
25% down · 7.5% · 30yr
- Down + closing
- —
- Monthly P&I
- —
- Monthly cashflow
- —
- DSCR
- —
- Eligible?
- —
Personal DTI + credit; lowest rate.
DSCR
20% down · 8.5% · 30yr
- Down + closing
- —
- Monthly P&I
- —
- Monthly cashflow
- —
- DSCR
- —
- Eligible?
- —
No personal income docs; deal must DSCR.
Hard money
10% down · 12.0% · 12mo
- Down + closing
- —
- Monthly P&I
- —
- Monthly cashflow
- —
- DSCR
- —
- Eligible?
- —
Short-term bridge; refi at stabilization.
Rent comps 8 comps
| Address | Beds | Baths | Sqft | Rent | $/sqft | DOM | Units | Dist |
|---|---|---|---|---|---|---|---|---|
| 426 Berteau Ave Elmhurst, IL | 3.0 | 2.0 | 1400 | $3,900 | $2.79 | 14d | 1 | 0.05mi |
| 150 E Schiller St Elmhurst, IL | 1.0–2.0 | 1.0–2.0 | 1350 | $2,595 | $1.92 | 43d | 1 | 0.72mi |
| 100 Haven Rd Elmhurst, IL | 2.0 | 1.0–2.0 | 927 | $4,738 | $5.11 | 1d | 15 | 0.73mi |
| 711 N Kenilworth Ave Elmhurst, IL | 3.0 | 1.0 | 988 | $3,100 | $3.14 | 1d | 1 | 0.97mi |
| 315 Kimbell Ave Unit 315-01 Kimbell Elmhurst, IL | 2.0 | 2.0 | 1005 | $1,995 | $1.99 | 43d | 1 | 1.20mi |
| 315 Kimbell Ave Unit 01 Elmhurst, IL | 2.0 | 2.0 | 1030 | $1,995 | $1.94 | 24d | 1 | 1.20mi |
| 425 W North Ave Elmhurst, IL | 3.0 | 1.0 | 1150 | $2,800 | $2.43 | 3d | 1 | 1.41mi |
| 5810 Saint Charles Rd Unit JER & Assocaties 5830-GF Berkeley, IL | 2.0 | 1.0 | 914 | $1,640 | $1.79 | 7d | 1 | 1.45mi |
Listing history 20 events
-
2026-06-18days on market $375,000 Active 48 DOM
-
2026-06-17days on market $375,000 Active 47 DOM
-
2026-06-16days on market $375,000 Active 46 DOM
-
2026-06-15days on market $375,000 Active 45 DOM
-
2026-06-13days on market $375,000 Active 43 DOM
-
2026-06-13days on market $375,000 Active 42 DOM
-
2026-06-09days on market $375,000 Active 39 DOM
-
2026-06-08days on market $375,000 Active 38 DOM
-
2026-06-07days on market $375,000 Active 37 DOM
-
2026-06-04days on market $375,000 Active 34 DOM
-
2026-06-03days on market $375,000 Active 33 DOM
-
2026-06-02days on market $375,000 Active 32 DOM
-
2026-06-01days on market $375,000 Active 31 DOM
-
2026-05-31days on market $375,000 Active 30 DOM
-
2026-04-30$375,000 Active 605-char remark
Show marketing remark (605 chars)
Build your dream home or renovate this solid starter on a quiet, low-traffic cul-de-sac surrounded by friendly neighbors. Located in the highly sought-after Field Elementary (new state-of-the-art school) and Sandburg Middle School districts. Endless potential to expand or create a custom home, or rehab the existing brick home into a charming 3-bedroom residence. Prime location-just 1 mile to downtown Elmhurst and the train, and only 1 block to Field Elementary. Incredible opportunity at an attractive price in a strong, established neighborhood. Love Elmhurst * Love Local
-
2026-04-29$375,000 Active 621-char remark
-
2006-05-22soldstatus $254,500
-
1986-01-02soldstatus $74,000
-
1985-12-01soldstatus $74,000
-
1983-09-01soldstatus $65,000
ⓘ Source: listings_history table (triggers on properties + properties_extension) + one-shot
backfill from property_details.listing_events for pre-trigger history.
Tax reassessment forecast IL · Partial reset (capped growth)
- Current annual tax
- $5,290 · $441/mo
- Projected year-2 tax
- $6,901 · $575/mo
- Expected delta
- +$1,611/yr (+$134/mo · 30.5%)
ⓘ Screening estimate from a state-policy table — verify with the county assessor before closing.
Climate risk First Street
- Flood 1/10 Low FEMA zone X (unshaded) · 0% chance over 30 yrs
- Wildfire 1/10 Low
- Heat 2/10 Low 7 d/yr ≥100°F today · 13 d/yr by 30 yrs out
- Wind 2/10 Low 0% chance of damaging wind over 30 yrs
- Air quality 4/10 Moderate 6 unhealthy d/yr today · 7 by 30 yrs out
Nearby sold comps map
Loading sold comps map…
Walkable amenities ~0.75 mi
Loading nearby amenities…
Taxation est. · year 1
- Rental income
- $39,073
- − Mortgage interest
- −$21,006
- − Property taxes
- −$5,290
- − Insurance
- −$1,875
- − Repairs & maintenance
- −$3,126
- − Management
- −$3,126
- − Depreciation
- −$10,909
- Taxable loss
- −$6,259
- Est. tax savings @ 24.0%
- +$1,502
- After-tax cash flow
- $1,606/yr
For passive investors: Depreciation is non-cash, so a rental often shows a tax loss while cash-flowing — sheltering income. Rental losses are passive: they offset passive income freely, and up to $25,000/yr can offset ordinary (W-2) income if you actively participate and your MAGI is under $100k (phasing out to $0 by $150k); unused losses carry forward. On sale, claimed depreciation is recaptured at up to 25%, and gains may owe capital-gains tax (a 1031 exchange can defer both). Figures are a year-1 estimate at your 24.0% rate — not tax advice; consult a CPA.
Schools (NCES district)
- District
- Elmhurst SD 205
- NCES district ID
- 1713970
- Math proficiency
- 44% ▼ -9.00%
- Reading proficiency
- 44% ▼ -9.00%
- Median HH income
- $94,932
- Composite
- 42.12/100
- National rank
- #3314
- State rank
- #72 of 620 in IL
Livability — Elmhurst
- Score
- 87/100
- State rank
- #11
- US rank
- #268
Category grades
Schools grade is shown separately in the Schools card above.
Census & demographics
- Census place
- Elmhurst, IL
- County
- DuPage County · 904,569 people
- City population
- 47,516
- Metro
- Chicago-Naperville-Elgin, IL-IN-WI
- Population (ZIP)
- 47,516
- Household income
- $147,566
- Rent vs Own
- Severe rent burden
- 602.0
Population outlook (DuPage County) Hauer SSP2
- Today (2025)
- 960,187 people
- By 2030
- 965,850 · +0.6%
- By 2040
- 965,812 · +0.6%
- By 2050
- 954,890 · -0.6%
- By 2075
- 910,185 · -5.2%
- By 2100
- 816,255 · -15.0%
Race, ethnicity, and origin ACS 2023
- Neighborhood character
- Predominantly White (77%)
- Race & ethnicity
- White 77% Hispanic / Latino 10% Two or more races 9% Asian 7% Black 2%
- Hispanic origin (detail)
- Mexican 7%
- Common ancestry
- Romanian 10% Italian 3% Lithuanian 2%
- Foreign-born
- 11% · Canada, China
- Languages at home
- 83% English-only · Spanish 6% Other Indo-European 4% Russian/Polish/Slavic 3%
Political lean MEDSL · DuPage
- 2024 margin
- D (+13.3) · D 55.9% · R 42.5% · Other 1.6%
- 2008→2024 swing
- +2.5pp toward D · 2008: 10.8pp · 2024: 13.3pp
- All cycles
- 2024: D+13.3 2020: D+18.1 2016: D+14.1 2012: D+1.0 2008: D+10.8
Not yet ingested
- Civics
- —
Market trends
- HPI YoY
- ▼ -545.93%
- Current HPI
- 212.3309
- Rent YoY
- ▲ 4.00%
- Metro
- Chicago-Naperville-Elgin, IL-IN-WI
- State GDP YoY
- ▲ 1.59%
- F500 in state
- 60
Industry mix (Fortune 500 HQ in IL)
| Industry | F500 HQs | Revenue |
|---|---|---|
| Insurance | 4 | $201B |
|
||
| Consumer Goods | 4 | $87B |
|
||
| Industrial Machinery | 3 | $64B |
|
||
| Healthcare | 2 | $55B |
|
||
| Retail / Pharmacy | 1 | $148B |
|
||
| Agriculture / Food | 1 | $86B |
|
||
Price history
+476.9% since first listed6 events — show timeline
- 2026-04-30 Listed $375,000 MRED as Distributed by MLS Grid
- 2026-04-29 Listed $375,000 MRED as Distributed by MLS Grid
- 2006-05-22 Sold (Public Records) $254,500 Public Records
- 1986-01-02 Sold (Public Records) $74,000 Public Records
- 1985-12-01 Sold (Public Records) $74,000 Public Records
- 1983-09-01 Sold (Public Records) $65,000 Public Records
Property tax history
+1.8%/yrLatest (2017): $5,290 · +3.9% YoY. Source: county tax records.
Cash-flow waterfall
monthlySold comps — $/sqft
last 12 mo · ≤1 miLoading sold comps…