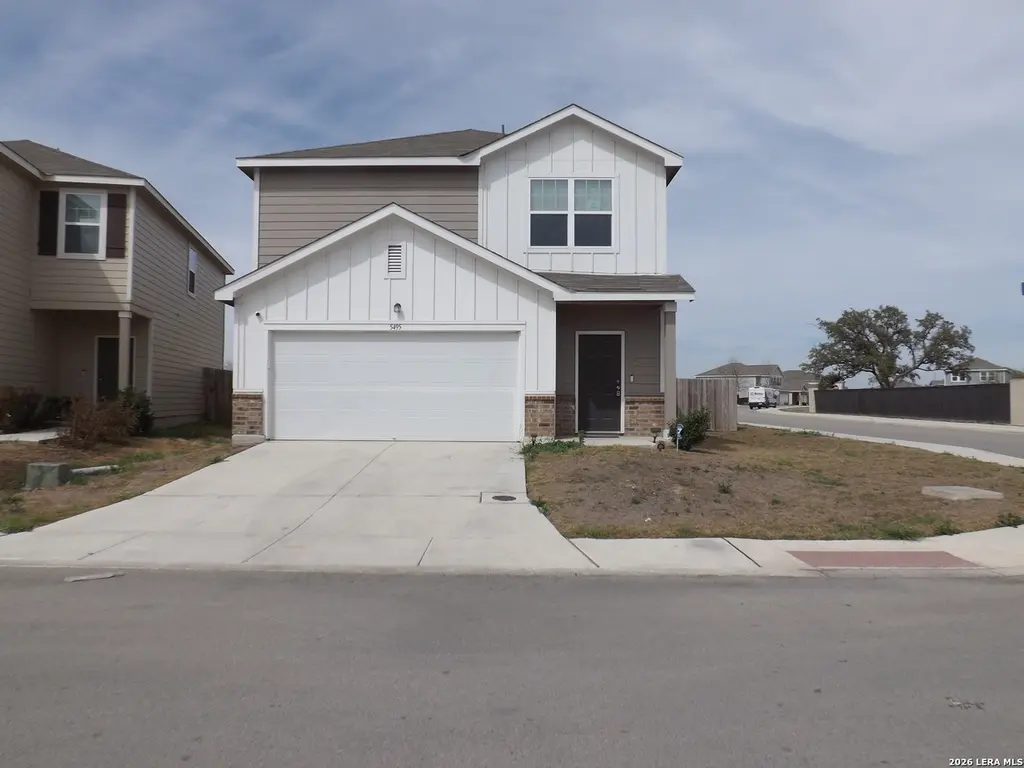
5495 Rue Girard · Converse, TX
Flood risk 1/10 · Minimal
- FEMA flood zone
- X (unshaded)
- Chance of flooding over 30 yrs
- 0.0%
- Est. flood insurance / yr
- $507 – $1,088
Fire risk 5/10 · Moderate
- Est. fire insurance / yr
- $1,222 – $2,270
Heat risk 8/10 · Major
- Hot days now (above 108°F)
- 6 days/yr
- Hot days in 30 yrs
- 18 days/yr
Wind risk 8/10 · Major
- Chance of severe wind over 30 yrs
- 80.0%
Air-quality risk 1/10 · Minimal
- Unhealthy air days now
- 0 days/yr
- Unhealthy air days in 30 yrs
- 0 days/yr
Risk factors via First Street. Map © Google.
Why this score? — see what drove the D grade
The composite is a weighted blend of 9 inputs, each scored 0–100. Each bar is that input's sub-score; the figure is the points it added to the 100-point composite (weight × sub-score).
- ARV discount +15.0/15.0
- Cash flow +8.2/30.0
- Condition / age +4.0/5.0
- Livability +3.3/5.0
- 1% rule +3.2/10.0
- Schools +2.4/10.0
- DSCR +2.2/10.0
- Rent growth +2.2/5.0
- Appreciation +0.0/10.0
$225,000
🖨 Deal sheet 📄 Offer letter ✓ Due diligence
Listing remarks
Beautiful Two Story Home Was Built In 2021 [5 Years Old]. Home Has 3 Bedrooms, 2 Full Bathrooms, [Open Floor Plan]. Large Kitchen W/ Stainless-Steel Appliances, Granite Countertops Throughout Kitchen, Beautiful White Cabinetry, Recessed Lighting, Built-In Microwave & Dishwasher W/ Electric Range. Spacious Master Bedroom Extended by a Walk-in Closet. Home has Recessed Lights Throughout. Water Softener in Garage. Home has Rear Covered Patio is Located Off the Kitchen. Home Additional Features Include Sheet Vinyl Flooring In Entry, Living Room, And All Wet Areas. Close To Randolph Air Force Base, Brooke Army Medical Center & Fort Sam Houston Army Post. Home Also Near Elementary Sch
Key facts
- Open floor plan
- Recessed lighting
- Granite countertops
Tags
Property features AI
Finance
- Other: Possession at closing/funding
- HOA & community: Mandatory HOA; HOA fee $125 annually; Association transfer fee $500; Subdivision amenities include pool, park/playground, jogging trails, and basketball court
Exterior
- Parking: 2-car garage
- Utilities: Water service provided by SAWS; Sewer service provided by SAWS; Electric service by CPS Energy; Garbage service by Tiger
- Home design: Pre-owned property; South-facing
- Construction: Approximately 5 years old; Brick exterior with 3-sided masonry; Slab foundation; Composition roof
- Exterior features: Privacy fence; Corner lot with city view and irregular shape; Street improvements include paved streets, curbs, gutters, sidewalks, streetlights, and nearby fire hydrant; Located on a city street with convenient access to state highway and interstate (within 1 mile)
Interior
- Kitchen: Stove/Range; Microwave oven; Refrigerator; Dishwasher; Disposal; Ice maker connection
- Bedrooms: Master bedroom on upper level with walk-in closet and full bath; Second bedroom (13 x 13); Third bedroom (15 x 13); Master bedroom dimensions 17 x 8
- Flooring: Carpeting; Vinyl flooring
- Bathrooms: Two full bathrooms; One half bathroom; Master bath with tub/shower combination and single vanity (13 x 6)
- Heating & cooling: Central heating; Heat pump heating (electric); Central A/C with heat pump
- Interior features: Living/dining room combination; Eat-in kitchen with walk-in pantry; Two eating areas; Game room; Utility room inside; All bedrooms on upper level; Cable TV available; High-speed internet; Laundry on upper level; All window coverings remain; Smoke alarm; Electric water heater
- Laundry & utility: Washer connection; Dryer connection; Laundry located on upper level; Utility room (7 x 8)
Neighborhood map
What this means for you Summary
Snapshot
- This is a 3-bed/2.5-bath single-family listed at $225k. Condition is rated good.
Deal economics
- At list price, monthly cash flow is $-209 ($-3k/yr) — negative.
- To cash-flow at today's rent, offer at most $188k (16.4% below list).
- To meet the 1% rule (rent ≥ 1% of price), the offer needs to be $185k (17.9% below list).
- Recommended offer: $185k (17.9% below list) — sets the bar for 1% rule.
Location & tenants
- Location reads 66/100 on livability (#649 in TX) — a middle-class / working-renter tenant base. Strengths: cost of living A+, housing A+, employment B; Watch: schools C-, crime C-, amenities F.
- Judson ISD (suburban): math 21% / reading 33% proficiency, ranked #660 of 826 in TX (top 80%) — low school quality limits family demand, transient renter base, plan for 1-2y turnover.
- Market conditions: Rents soft (-1.1%/yr); 1152 active listings in the ZIP; 40 comparable units currently listed for rent nearby; rentals at typical pace (median 24d on market — plan ~3-4 weeks tenant-placement turnaround); solid renter incomes; 8,308 units permitted in Bexar County in 2024 (2,506 in 5+ unit buildings).
Forward outlook
- Local home prices are declining (-3.0%/yr); year-one equity from $2k of loan paydown is wiped out by about $7k of value loss. Plan a longer hold.
- Bexar County population projected at +50% by 2050 — long-run rental-demand tailwind backs the buy-and-hold thesis.
Negotiation context
- It's been on market 47 days — a 3% lower offer ($218k) is reasonable based on typical stale-listing flexibility.
- 3 sale attempts since 3y ago with the ask held roughly flat each time — persistent listings suggest the price (not the market) is what's stuck; bring a comps-based counter.
Risks & watch-outs
- Climate carrying-cost: severe wind risk, 80% chance of damaging wind over 30y; moderate wildfire risk; extreme-heat days projected 6→18/yr by 2055 (HVAC capex compounding) — expect insurance premiums to compound above CPI over the hold.
Questions for the listing agent
- What do current leases actually rent for vs. the listed asking? Can we see a recent rent roll and the last 12 months of T-12 income?
- It's been on market 47 days. Have you received any prior offers? Is the seller open to a 18% concession, seller financing, or rate buy-down credit?
- What does the HOA fee cover, when was the last increase, and are there any pending special assessments or reserve-fund shortfalls?
- Is there a deadline driving the sale (1031 exchange, divorce, estate, relocation)? That informs how much negotiation room exists.
- The area grade is low — what's the realistic commute time and amenity access for the typical tenant pool here? Any planned neighborhood developments (good or bad) we should know about?
- What's the average days-on-market for RENTAL listings here right now (not sales)? A rising rental-DOM trend means longer vacancies and softer asking-rent achievability than the comps imply.
- What's the recent tenant-quality profile in this submarket — average credit score on applications, eviction rate, late-payment / NSF rate, and stable-employment percentage? A property-management company in the area should have these aggregated.
- How much new for-sale + rental construction is in the pipeline within 1–3 miles? Heavy new supply typically softens prices + rents 12–24 months out; constrained supply supports both.
Investment metrics
- 1% rule
- 0.82% ✗
- Cap rate
- 5.18%
- Cash-on-cash
- -3.98%
- DSCR
- 0.82
- GRM
- 10.2
CMA / ARV
- ARV (median comp)
- $296,049
- List price
- $225,000
- Delta
- -24.00%
- Verdict
- UNDERPRICED
- Comps
- 20 within 1.0 mi
Show comp detail 12 sales within ~0.75 mi
| Address | Dist | Beds/Ba | Sqft | Sold | Price | $/sf | Match |
|---|---|---|---|---|---|---|---|
| 5927 Ironmill | 0.24mi | 3/2.5 | 1,640 (+1%) | 2mo | $175,000 | $107 | 86 |
| 8174 Ocean Meadow Dr | 0.44mi | 3/2.5 | 1,698 (+4%) | 1mo | $198,975 | $117 | 71 |
| 6447 Beech Trl | 0.56mi | 3/2.5 | 1,698 (+4%) | 2mo | $190,000 | $112 | 65 |
| 8517 Terlingua Cv | 0.48mi | 4/2.0 (+1) | 1,674 (+3%) | 1mo | $230,000 | $137 | 65 |
| 4838 Via Sonoma Trl | 0.70mi | 3/2.5 | 1,611 (-1%) | 1mo | $260,000 | $161 | 65 |
| 8936 Dakota Run | 0.70mi | 3/2.5 | 1,582 (-3%) | 1mo | $189,000 | $119 | 62 |
| 5107 Boiling Spgs | 0.59mi | 3/2.5 | 1,780 (+9%) | 2mo | $249,233 | $140 | 55 |
| 9406 Griffith Run | 0.64mi | 3/2.5 | 1,780 (+9%) | 1mo | $249,138 | $140 | 54 |
| 9015 Little Hoss | 0.54mi | 3/2.0 | 1,450 (-11%) | 3mo | $215,000 | $148 | 52 |
| 8150 Cheryl Mdw | 0.50mi | 3/2.0 | 1,862 (+14%) | 1mo | $210,000 | $113 | 50 |
| 5114 Schaeffer Rdg | 0.72mi | 3/2.5 | 1,780 (+9%) | 3mo | $268,237 | $151 | 49 |
| 6858 Eden Grv | 0.74mi | 4/2.5 (+1) | 1,801 (+11%) | 3mo | $199,000 | $110 | 41 |
Match score weights: distance 35% · size 25% · config 20% · recency 20%. Top-matched comps best support the ARV.
Projected returns pro-forma
-3.0% appreciation · 0.0% rent growth · sell at horizon
- IRR
- -26.6%
- Equity multiple
- 0.13×
- Total profit
- $-55,081
- Equity at exit
- $33,548
- IRR
- -40.4%
- Equity multiple
- -0.36×
- Total profit
- $-85,621
- Equity at exit
- $19,454
Cash invested: $63,000 (down + closing). Projections, not guarantees.
Landlord ↔ Tenant lean methodology
- Overall (STATE)
- 87 Strongly Landlord-Friendly
- State Texas
- 87 Strongly Landlord-Friendly · R+5
- County
- — inherits STATE
- City
- — inherits STATE
ZIP-level market 78109
- Home prices YoY
- -17.8%
- Rents YoY
- -1.1%
- Active inventory
- 1152
- Price-to-rent
- 10.2×
Monthly cashflow live
- Estimated rent
- $1,847 high interval (Pro) →
- Mortgage (P&I)
- −$1,180
- Tax from tax record
- −$385 /mo · $4,615/yr
- Insurance
- −$94
- HOA
- −$10
- Vacancy / Maint / Mgmt
- −$388
- Net cashflow
- $-209
Break-even live
UW: 25.0% down · 7.5% · 30yr · 1.5% tax · 5.0% vac · 8.0% maint · 8.0% mgmt
Financing live
Cash to close
- Down payment
- $56,250
- Closing costs
- $6,750
- Reserves months
- —
- Total cash needed
- —
Loan-product check · same deal, 3 products live
Conventional
25% down · 7.5% · 30yr
- Down + closing
- —
- Monthly P&I
- —
- Monthly cashflow
- —
- DSCR
- —
- Eligible?
- —
Personal DTI + credit; lowest rate.
DSCR
20% down · 8.5% · 30yr
- Down + closing
- —
- Monthly P&I
- —
- Monthly cashflow
- —
- DSCR
- —
- Eligible?
- —
No personal income docs; deal must DSCR.
Hard money
10% down · 12.0% · 12mo
- Down + closing
- —
- Monthly P&I
- —
- Monthly cashflow
- —
- DSCR
- —
- Eligible?
- —
Short-term bridge; refi at stabilization.
Rent comps 40 comps
| Address | Beds | Baths | Sqft | Rent | $/sqft | DOM | Units | Dist |
|---|---|---|---|---|---|---|---|---|
| 8607 Rock Mdw Converse, TX | 4.0 | 3.0 | 1902 | $1,895 | $1.00 | 16d | 1 | 0.14mi |
| 8603 Rock Mdw Converse, TX | 4.0 | 3.0 | 2241 | $2,090 | $0.93 | 43d | 1 | 0.14mi |
| 5439 Rue Girard Converse, TX | 3.0 | 2.5 | 1826 | $2,400 | $1.31 | 24d | 1 | 0.15mi |
| 5431 Rue Girard Converse, TX | 3.0 | 2.5 | 1605 | $1,700 | $1.06 | 24d | 1 | 0.15mi |
| 5810 Rue Picasso Converse, TX | 4.0 | 3.0 | 2241 | $2,650 | $1.18 | 12d | 1 | 0.16mi |
| 5628 Pearl Mdw Converse, TX | 4.0 | 3.0 | 2241 | $1,995 | $0.89 | 24d | 1 | 0.18mi |
| 5631 Pearl Mdw Converse, TX | 3.0 | 2.0 | 1410 | $1,500 | $1.06 | 24d | 1 | 0.20mi |
| 6027 Kensinger Pass Converse, TX | 3.0 | 2.0 | 1332 | $1,480 | $1.11 | 4d | 1 | 0.25mi |
| 5622 Rowan Rdg Converse, TX | 3.0 | 2.0 | 1412 | $1,625 | $1.15 | 15d | 1 | 0.25mi |
| 5622 Rowan Rdg Converse, TX | 3.0 | 2.0 | 1412 | $1,625 | $1.15 | 24d | 1 | 0.25mi |
| 5814 Lilac Lndg Converse, TX | 3.0 | 2.0 | 1532 | $1,775 | $1.16 | 4d | 1 | 0.27mi |
| 8848 Staghorn Ml Converse, TX | 3.0 | 2.0 | 1212 | $1,500 | $1.24 | 4d | 1 | 0.31mi |
| 8818 Kestrel Oak Converse, TX | 3.0 | 2.5 | 1972 | $1,525 | $0.77 | 43d | 1 | 0.33mi |
| 6123 Ironmill Crk Converse, TX | 3.0 | 2.0 | 1590 | $1,595 | $1.00 | 43d | 1 | 0.34mi |
| 5475 Bluebell Mdw Converse, TX | 3.0 | 2.5 | 1605 | $1,695 | $1.06 | 43d | 1 | 0.36mi |
| 8833 Binz Engleman Rd Unit 710 Converse, TX | 2.0 | 2.0 | 1097 | $950 | $0.87 | 3d | 1 | 0.36mi |
| 8914 Kestrel Oak Converse, TX | 3.0 | 2.5 | 1582 | $1,600 | $1.01 | 24d | 1 | 0.39mi |
| 5170 Fowler Crst Converse, TX | 3.0 | 2.0 | 1450 | $1,695 | $1.17 | 4d | 1 | 0.39mi |
| 5135 Fowler Crst Converse, TX | 3.0 | 2.0 | 1266 | $1,950 | $1.54 | 4d | 1 | 0.40mi |
| 8555 Barefoot Ln Converse, TX | 3.0 | 2.5 | 1780 | $2,050 | $1.15 | 24d | 1 | 0.43mi |
| 5223 Hornbeck Hts Converse, TX | 3.0 | 2.0 | 1440 | $1,795 | $1.25 | 43d | 1 | 0.43mi |
| 5118 Everett Loop Converse, TX | 4.0 | 2.0 | 1635 | $1,599 | $0.98 | 15d | 1 | 0.44mi |
| 8511 Amistad Cv Converse, TX | 3.0 | 2.0 | 1440 | $1,479 | $1.03 | 4d | 1 | 0.45mi |
| 8803 Barrow Path Converse, TX | 3.0 | 2.0 | 1440 | $1,570 | $1.09 | 24d | 1 | 0.47mi |
| 5736 Brook Pr San Antonio, TX | 3.0 | 2.5 | 1497 | $1,500 | $1.00 | 24d | 1 | 0.47mi |
| 8151 Cheryl Meadow Dr Converse, TX | 3.0 | 2.5 | 1698 | $1,730 | $1.02 | 4d | 1 | 0.47mi |
| 5107 Hornbeck Hts Converse, TX | 3.0 | 2.0 | 1266 | $1,496 | $1.18 | 4d | 1 | 0.48mi |
| 8911 Sumners Wise Converse, TX | 4.0 | 2.0 | 1627 | $1,745 | $1.07 | 2d | 1 | 0.48mi |
| 8511 Cassia Cv Converse, TX | 3.0 | 2.0 | 1910 | $1,700 | $0.89 | 43d | 1 | 0.49mi |
| 8830 McCoy Pass Converse, TX | 4.0 | 2.0 | 1950 | $2,020 | $1.04 | 12d | 1 | 0.50mi |
| 8810 Barrow Path Converse, TX | 4.0 | 2.0 | 1667 | $1,695 | $1.02 | 20d | 1 | 0.50mi |
| 9115 Griffith Run Converse, TX | 3.0 | 2.0 | 1266 | $1,521 | $1.20 | 43d | 1 | 0.51mi |
| 6439 Beech Trail Dr Converse, TX | 3.0 | 2.0 | 1520 | $1,450 | $0.95 | 12d | 1 | 0.51mi |
| 9204 Canyon Bnd Unit 2 Converse, TX | 3.0 | 2.5 | 1372 | $1,495 | $1.09 | 43d | 1 | 0.52mi |
| 6802 Canary Meadow Dr Converse, TX | 3.0 | 2.0 | 1734 | $1,550 | $0.89 | 24d | 1 | 0.53mi |
| 9213 Groff Lndg Converse, TX | 3.0 | 2.0 | 1344 | $1,600 | $1.19 | 11d | 1 | 0.53mi |
| 8127 Ocean Meadow Dr Converse, TX | 3.0 | 2.0 | 1520 | $1,700 | $1.12 | 43d | 1 | 0.54mi |
| 8206 Longhorn Ridge Dr Converse, TX | 3.0 | 2.0 | 1386 | $1,525 | $1.10 | 2d | 1 | 0.54mi |
| 9211 Griffith Run Converse, TX | 3.0 | 2.0 | 1266 | $1,446 | $1.14 | 4d | 1 | 0.55mi |
| 6414 Kensinger Pass Converse, TX | 3.0 | 2.5 | 1582 | $2,100 | $1.33 | 43d | 1 | 0.57mi |
HOA detail
- Monthly dues
- $10 · $120/yr
- Likely covers
- waterelectric
Listing history 24 events
-
2026-06-18days on market $225,000 Active 47 DOM
-
2026-06-17days on market $225,000 Active 46 DOM
-
2026-06-16days on market $225,000 Active 45 DOM
-
2026-06-16status $225,000 Active 44 DOM
-
2026-06-15days on market $225,000 Price Change 44 DOM
-
2026-06-13days on market $225,000 Price Change 42 DOM
-
2026-06-09days on market $225,000 Price Change 38 DOM
-
2026-06-08days on market $225,000 Price Change 37 DOM
-
2026-06-07pricestatusdays on market $225,000 Price Change 36 DOM
-
2026-06-04days on market $236,500 Active 33 DOM
-
2026-06-03days on market $236,500 Active 32 DOM
-
2026-06-02days on market $236,500 Active 31 DOM
-
2026-06-01days on market $236,500 Active 30 DOM
-
2026-05-31days on market $236,500 Active 29 DOM
-
2026-05-02$236,500 New 698-char remark
-
2024-03-22historical
-
2024-02-02status Back on Market
-
2024-01-31historical
-
2023-11-03price $277,950
-
2023-10-07price $283,000
-
2023-09-06price $286,450
-
2023-08-22price $289,450
-
2023-08-04price $298,450
-
2023-07-17$310,000 New
ⓘ Source: listings_history table (triggers on properties + properties_extension) + one-shot
backfill from property_details.listing_events for pre-trigger history.
Tax reassessment forecast TX · Resets to sale price
- Current annual tax
- $4,615 · $385/mo
- Projected year-2 tax
- $4,615 · $385/mo
- Expected delta
- $0/yr ($0/mo · 0.0%)
ⓘ Screening estimate from a state-policy table — verify with the county assessor before closing.
Climate risk First Street
- Flood 1/10 Low FEMA zone X (unshaded) · 0% chance over 30 yrs
- Wildfire 5/10 Major
- Heat 8/10 Severe 6 d/yr ≥108°F today · 18 d/yr by 30 yrs out
- Wind 8/10 Severe 80% chance of damaging wind over 30 yrs
- Air quality 1/10 Low 0 unhealthy d/yr today · 0 by 30 yrs out
Nearby sold comps map
Loading sold comps map…
Walkable amenities ~0.75 mi
Loading nearby amenities…
Taxation est. · year 1
- Rental income
- $22,167
- − Mortgage interest
- −$12,603
- − Property taxes
- −$4,615
- − Insurance
- −$1,125
- − Repairs & maintenance
- −$1,773
- − Management
- −$1,773
- − HOA
- −$120
- − Depreciation
- −$6,545
- Taxable loss
- −$6,388
- Est. tax savings @ 24.0%
- +$1,533
- After-tax cash flow
- $-974/yr
For passive investors: Depreciation is non-cash, so a rental often shows a tax loss while cash-flowing — sheltering income. Rental losses are passive: they offset passive income freely, and up to $25,000/yr can offset ordinary (W-2) income if you actively participate and your MAGI is under $100k (phasing out to $0 by $150k); unused losses carry forward. On sale, claimed depreciation is recaptured at up to 25%, and gains may owe capital-gains tax (a 1031 exchange can defer both). Figures are a year-1 estimate at your 24.0% rate — not tax advice; consult a CPA.
Condition & rehab AI · 12 photos
This two-story home, built in 2021, is in good condition with a good condition score of 80. It has a good kitchen, bathrooms, and exterior. The home is located in a desirable area near military bases and schools. The property has a good resale and rental value with potential for further improvements.
Value-add opportunities
- Both Painting exterior and interior walls — Fresh paint can enhance curb appeal and interior aesthetics.
- Both Landscaping improvements — Well-maintained landscaping can increase both resale and rental value.
- Resale Upgrading kitchen appliances — Modern appliances can attract more buyers and renters.
- Both Adding smart home features — Smart home technology can increase both resale and rental value by making the home more appealing to tech-savvy buyers and renters.
Renovation cost estimate screening
Value-add ROI direction
- Both Painting exterior and interior walls — Fresh paint can enhance curb appeal and interior aesthetics. ↑
- Both Landscaping improvements — Well-maintained landscaping can increase both resale and rental value. ↑
- Resale Upgrading kitchen appliances — Modern appliances can attract more buyers and renters. ↑
- Both Adding smart home features — Smart home technology can increase both resale and rental value by making the home more appealing to tech-savvy buyers and renters. ↑
ⓘ Cost ranges are severity-bucket heuristics (US national rule-of-thumb). Get contractor quotes + a written scope before underwriting a rehab budget.
Schools (NCES district)
- District
- Judson ISD
- NCES district ID
- 4824990
- Math proficiency
- 21% ▼ -21.00%
- Reading proficiency
- 33% ▼ -7.00%
- Median HH income
- $57,542
- Composite
- 24.39/100
- National rank
- #7689
- State rank
- #660 of 826 in TX
Livability — Converse
- Score
- 66/100
- State rank
- #649
- US rank
- #12250
Category grades
Schools grade is shown separately in the Schools card above.
Census & demographics
- County
- Bexar County · 1,990,555 people
- City population
- 63,067
- Metro
- San Antonio-New Braunfels, TX
- Population (ZIP)
- 63,067
- Household income
- $91,320
- Rent vs Own
- Severe rent burden
- 1732.0
Population outlook (Bexar County) Hauer SSP2
- Today (2025)
- 2,336,851 people
- By 2030
- 2,560,728 · +9.6%
- By 2040
- 3,020,569 · +29.3%
- By 2050
- 3,493,522 · +49.5%
- By 2075
- 4,668,459 · +99.8%
- By 2100
- 5,533,242 · +136.8%
Race, ethnicity, and origin ACS 2023
- Neighborhood character
- Diverse neighborhood (Simpson 0.69)
- Race & ethnicity
- Hispanic / Latino 44% White 27% Two or more races 21% Black 21% Asian 3%
- Hispanic origin (detail)
- Mexican 29% Puerto Rican 4%
- Common ancestry
- Lithuanian 1% Romanian 1% Italian 1%
- Foreign-born
- 11% · Canada, Vietnam, South Korea
- Languages at home
- 71% English-only · Spanish 23% Tagalog/Filipino 1% Other Asian/Pacific 1%
Political lean MEDSL · Bexar
- 2024 margin
- Lean D (+9.8) · D 54.3% · R 44.6% · Other 1.1%
- 2008→2024 swing
- +4.2pp toward D · 2008: 5.6pp · 2024: 9.8pp
- All cycles
- 2024: D+9.8 2020: D+18.2 2016: D+13.5 2012: D+4.6 2008: D+5.6
Not yet ingested
- Civics
- —
Market trends
- HPI YoY
- ▼ -51.02%
- Current HPI
- 236.4923
- Rent YoY
- ▼ -1.08%
- Metro
- San Antonio-New Braunfels, TX
- State GDP YoY
- ▲ 3.95%
- F500 in state
- 110
Industry mix (Fortune 500 HQ in TX)
| Industry | F500 HQs | Revenue |
|---|---|---|
| Energy | 16 | $1,198B |
|
||
| Technology | 5 | $198B |
|
||
| Engineering / Construction | 4 | $72B |
|
||
| Energy Services | 3 | $60B |
|
||
| Utilities | 3 | $41B |
|
||
| Healthcare | 2 | $330B |
|
||
Price history
-27.4% since first listed11 events — show timeline
- 2026-06-06 Price Changed $225,000 LERA
- 2026-05-02 Listed $236,500 LERA
- 2024-03-22 Listing Removed — LERA
- 2024-02-02 Relisted — LERA
- 2024-01-31 Listing Removed — LERA
- 2023-11-03 Price Changed $277,950 LERA
- 2023-10-07 Price Changed $283,000 LERA
- 2023-09-06 Price Changed $286,450 LERA
- 2023-08-22 Price Changed $289,450 LERA
- 2023-08-04 Price Changed $298,450 LERA
- 2023-07-17 Listed $310,000 LERA
Property tax history
+58.7%/yrLatest (2025): $4,615 · -8.8% YoY. Source: county tax records.
Cash-flow waterfall
monthlySold comps — $/sqft
last 12 mo · ≤1 miLoading sold comps…