152 Meadowlark Ln · Newport, NC
Flood risk 1/10 · Minimal
- FEMA flood zone
- X (unshaded)
- Chance of flooding over 30 yrs
- 0.0%
- Est. flood insurance / yr
- $507 – $1,088
Fire risk 3/10 · Minor
- Est. fire insurance / yr
- $906 – $1,684
Heat risk 9/10 · Severe
- Hot days now (above 104°F)
- 7 days/yr
- Hot days in 30 yrs
- 21 days/yr
Wind risk 8/10 · Major
- Chance of severe wind over 30 yrs
- 99.0%
Air-quality risk 1/10 · Minimal
- Unhealthy air days now
- 0 days/yr
- Unhealthy air days in 30 yrs
- 0 days/yr
Risk factors via First Street. Map © Google.
Why this score? — see what drove the D+ grade
The composite is a weighted blend of 9 inputs, each scored 0–100. Each bar is that input's sub-score; the figure is the points it added to the 100-point composite (weight × sub-score).
- Cash flow +15.0/30.0
- ARV discount +7.5/15.0
- Schools +5.1/10.0
- 1% rule +5.0/10.0
- DSCR +5.0/10.0
- Livability +3.2/5.0
- Rent growth +2.5/5.0
- Condition / age +2.5/5.0
- Appreciation +0.0/10.0
$275,000
🖨 Deal sheet (PDF) 📄 Offer letter ✓ Due diligence
Listing remarks
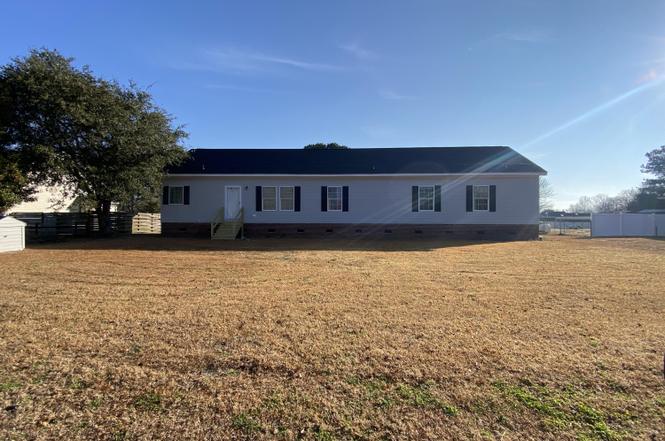
If you are looking for a place close to the beach but not on the beach. This may be for you. Over 2000 sq. ft. modular home. 3 Beds/3 Bath with a bonus room. . Yard has just over 1/2 acre to put all your toys in. (Boat-jet ski ect. .) A whole house generator. Backyard is fenced in. The home has a den and a living room area. Just incase you have the whole family visiting. All Bedrooms have access to a bathroom. Principal Bedroom has a private sitting area all to yourself. 2 sheds. Don't let this one get away. Home is being sold as-is.
Key facts
- Modular home
- Close to the beach
- Private sitting area
Tags
Property features AI
Finance
- Other: Located on a private road (see remarks); Lot approximately 0.57 acres (dimensions: 115 x 223 x 115 x 215); Zoned residential
Exterior
- Parking: Unpaved parking; 1 total parking space; 1-car garage
- Utilities: Public water; Septic tank sewer; Generator power; Underground utilities; Water connected
- Home design: Single family residence; One story
- Construction: Vinyl siding and frame construction; Shingle roof
- Exterior features: Deck; Patio/porch (see remarks); Chain link, wood, and backyard fencing; Shed(s); Has view
Interior
- Kitchen: Refrigerator; Dishwasher; Electric range; Microwave; Water softener
- Bedrooms: Total rooms: 8
- Flooring: Carpet; Vinyl
- Bathrooms: 3 full bathrooms
- Heating & cooling: Heat pump heating; Electric heating; Heat pump cooling
- Interior features: Kitchen island; Accessible full bathroom; Crawl space basement
Neighborhood map
What this means for you Summary
Snapshot
- This is a 3-bed/2.0-bath other listed at $275k.
Deal economics
- At list price, monthly cash flow is $8k ($97k/yr) — positive.
- The deal already cash-flows at list — no discount required.
- Meets the 1% rule at list price ($12k rent vs $275k).
- Recommended offer: $242k (12.0% below list) — sets the bar for market timing.
- Cap rate 41.7% vs local median 31.4% in Newport — top-decile yield for the area; either an underpriced asset or a hidden risk that comps aren't pricing in. Stress-test before assuming the spread holds.
Location & tenants
- Location reads 63/100 on livability (#385 in NC) — a middle-class / working-renter tenant base. Strengths: cost of living A+, housing A+; Watch: employment C-, amenities F, commute F.
- Carteret County Public Schools (rural): math 59% / reading 61% proficiency, ranked #31 of 178 in NC (top 17%) — acceptable for families but not a draw, mixed tenant base, ~2y average lease.
- Zoned schools: Newport Elementary (math 48% / reading 45%, grade D-, #542 of 1,410 statewide, top 39%, 645 students, 100% FRL); Newport Middle (math 39% / reading 56%, grade C-, #140 of 475 statewide, top 30%, 378 students, 98% FRL); West Carteret High (math 82% / reading 71%, grade A-, #89 of 535 statewide, top 16%, 1,146 students, 40% FRL) — zoned schools average 79% FRL vs 39% district-wide (40 pts higher); higher-poverty schools than district average — tighter screening recommended.
- Market conditions: 216 active listings in the ZIP; 935 units permitted in Carteret County in 2024 (360 in 5+ unit buildings).
- At $12,386/mo this rent would consume 212% of the median local household income ($70k/yr) (locally 461% of renters already pay >50% of income on rent) — very limited rent-growth headroom before tenants either downsize or default.
Forward outlook
- Local home prices are declining (-3.0%/yr); year-one equity from $2k of loan paydown is wiped out by about $8k of value loss. Plan a longer hold.
- Carteret County population projected at +9% by 2050 — modest demand growth; plan on rents tracking national, not racing it.
- At projected returns (-3.0% appreciation + 3.0% rent growth), your $77k cash investment doubles in ~1 year — after that, you're playing with house money.
Negotiation context
- It's been on market 154 days — a 12% lower offer ($242k) is reasonable based on typical stale-listing flexibility.
- 10 sale attempts since 21y ago; this cycle's ask has dropped $20k (7%) from the opening price — seller is motivated, your offer sets the floor, not the list.
- Current owner paid $175k; list at $275k implies a 57% gain — meaningful room to come down on a strong offer.
Risks & watch-outs
- Climate carrying-cost: severe wind risk, 99% chance of damaging wind over 30y; extreme-heat days projected 7→21/yr by 2055 (HVAC capex compounding) — expect insurance premiums to compound above CPI over the hold.
Questions for the listing agent
- It's been on market 154 days. Have you received any prior offers? Is the seller open to a 12% concession, seller financing, or rate buy-down credit?
- Why hasn't it sold? Are there any deal-killer items the seller is aware of (foundation, flood, title, zoning, code violations)?
- Is there a deadline driving the sale (1031 exchange, divorce, estate, relocation)? That informs how much negotiation room exists.
- The area grade is low — what's the realistic commute time and amenity access for the typical tenant pool here? Any planned neighborhood developments (good or bad) we should know about?
- What's the average days-on-market for RENTAL listings here right now (not sales)? A rising rental-DOM trend means longer vacancies and softer asking-rent achievability than the comps imply.
- What's the recent tenant-quality profile in this submarket — average credit score on applications, eviction rate, late-payment / NSF rate, and stable-employment percentage? A property-management company in the area should have these aggregated.
- How much new for-sale + rental construction is in the pipeline within 1–3 miles? Heavy new supply typically softens prices + rents 12–24 months out; constrained supply supports both.
Investment metrics
- 1% rule
- 4.50% ✓
- Cap rate
- 41.71%
- Cash-on-cash
- 126.50%
- DSCR
- 6.63
- GRM
- 1.9
CMA / ARV
No comps found within radius.
Projected returns pro-forma
-3.0% appreciation · 3.0% rent growth · sell at horizon
- IRR
- —
- Equity multiple
- 7.14×
- Total profit
- $472,484
- Equity at exit
- $41,003
- IRR
- —
- Equity multiple
- 14.99×
- Total profit
- $1,077,331
- Equity at exit
- $23,777
Cash invested: $77,000 (down + closing). Projections, not guarantees.
Landlord ↔ Tenant lean methodology
- Overall (STATE)
- 85 Strongly Landlord-Friendly
- State North Carolina
- 85 Strongly Landlord-Friendly · R+3
- County
- — inherits STATE
- City
- — inherits STATE
ZIP-level market 28570
- Home prices YoY
- -16.2%
- Active inventory
- 216
- Price-to-rent
- 1.9×
Monthly cashflow live
- Estimated rent
- $12,386 medium interval (Pro) →
- Mortgage (P&I)
- −$1,442
- Tax from tax record
- −$111 /mo · $1,334/yr
- Insurance
- −$115
- HOA
- −$0
- Vacancy / Maint / Mgmt
- −$2,601
- Net cashflow
- $8,117
Break-even live
Sensitivity live
| Price | -10% $8,273 | -5% $8,195 | +0% $8,117 | +5% $8,040 | +10% $7,962 |
|---|---|---|---|---|---|
| Rent | -10% $7,139 | -5% $7,628 | +0% $8,117 | +5% $8,607 | +10% $9,096 |
| Rate | -1.0pp $8,256 | -0.5pp $8,187 | base $8,117 | +0.5pp $8,046 | +1.0pp $7,974 |
UW: 25.0% down · 7.5% · 30yr · 1.5% tax · 5.0% vac · 8.0% maint · 8.0% mgmt
Financing live
Cash to close
- Down payment
- $68,750
- Closing costs
- $8,250
- Reserves months
- —
- Total cash needed
- —
Loan-product check · same deal, 3 products live
Conventional
25% down · 7.5% · 30yr
- Down + closing
- —
- Monthly P&I
- —
- Monthly cashflow
- —
- DSCR
- —
- Eligible?
- —
Personal DTI + credit; lowest rate.
DSCR
20% down · 8.5% · 30yr
- Down + closing
- —
- Monthly P&I
- —
- Monthly cashflow
- —
- DSCR
- —
- Eligible?
- —
No personal income docs; deal must DSCR.
Hard money
10% down · 12.0% · 12mo
- Down + closing
- —
- Monthly P&I
- —
- Monthly cashflow
- —
- DSCR
- —
- Eligible?
- —
Short-term bridge; refi at stabilization.
Listing history 38 events
-
2026-06-12statusdays on market $275,000 Pending 154 DOM
-
2026-06-09days on market $275,000 Active 152 DOM
-
2026-06-08days on market $275,000 Active 151 DOM
-
2026-06-07days on market $275,000 Active 150 DOM
-
2026-06-05days on market $275,000 Active 147 DOM
-
2026-06-03days on market $275,000 Active 146 DOM
-
2026-06-02days on market $275,000 Active 145 DOM
-
2026-06-01days on market $275,000 Active 144 DOM
-
2026-05-31days on market $275,000 Active 143 DOM
-
2026-05-30days on market $275,000 Active 142 DOM
-
2026-04-04price $275,000
-
2026-01-08$295,000 Active
-
2025-10-16status Active
-
2025-10-09status Pending
-
2025-10-09historical
-
2025-09-30price $285,000
-
2025-09-02price $290,000
-
2025-06-30price $295,000
-
2025-06-18price $305,000
-
2025-06-10price $310,000
-
2025-05-21$320,000 Active
-
2025-05-04status Active
-
2025-04-21status Pending
-
2025-04-21historical
-
2025-01-02price $310,000
-
2024-12-05$325,000 Active
-
2016-10-31soldstatus $175,000
-
2014-04-13historical
-
2012-04-13$165,000
-
2011-05-07historical
-
2010-05-05$165,000
-
2009-07-23historical
-
2009-02-23$175,000
-
2008-07-07historical
-
2007-09-24$189,900
-
2005-08-31soldstatus $139,000
-
2005-07-08$159,000
-
2005-05-17soldstatus $27,000
ⓘ Source: listings_history table (triggers on properties + properties_extension) + one-shot
backfill from property_details.listing_events for pre-trigger history.
Tax reassessment forecast NC · Resets to sale price
- Current annual tax
- $1,334 · $111/mo
- Projected year-2 tax
- $2,255 · $188/mo
- Expected delta
- +$921/yr (+$77/mo · 69.0%)
ⓘ Screening estimate from a state-policy table — verify with the county assessor before closing.
Climate risk First Street
- Flood 1/10 Low FEMA zone X (unshaded) · 0% chance over 30 yrs
- Wildfire 3/10 Moderate
- Heat 9/10 Extreme 7 d/yr ≥104°F today · 21 d/yr by 30 yrs out
- Wind 8/10 Severe 99% chance of damaging wind over 30 yrs
- Air quality 1/10 Low 0 unhealthy d/yr today · 0 by 30 yrs out
Nearby sold comps map
Loading sold comps map…
Walkable amenities ~0.75 mi
Loading nearby amenities…
Taxation est. · year 1
- Rental income
- $148,637
- − Mortgage interest
- −$15,404
- − Property taxes
- −$1,334
- − Insurance
- −$1,375
- − Repairs & maintenance
- −$11,891
- − Management
- −$11,891
- − Depreciation
- −$8,000
- Taxable income
- $98,742
- Est. tax owed @ 24.0%
- −$23,698
- After-tax cash flow
- $73,711/yr
For passive investors: Depreciation is non-cash, so a rental often shows a tax loss while cash-flowing — sheltering income. Rental losses are passive: they offset passive income freely, and up to $25,000/yr can offset ordinary (W-2) income if you actively participate and your MAGI is under $100k (phasing out to $0 by $150k); unused losses carry forward. On sale, claimed depreciation is recaptured at up to 25%, and gains may owe capital-gains tax (a 1031 exchange can defer both). Figures are a year-1 estimate at your 24.0% rate — not tax advice; consult a CPA.
Schools (NCES district)
- District
- Carteret County Public Schools
- NCES district ID
- 3700630
- Math proficiency
- 59% ▲ 5.00%
- Reading proficiency
- 61% ▲ 2.00%
- Median HH income
- $48,330
- Composite
- 50.92/100
- National rank
- #1786
- State rank
- #31 of 178 in NC
Livability — Newport
- Score
- 63/100
- State rank
- #385
- US rank
- #15094
Category grades
Schools grade is shown separately in the Schools card above.
Census & demographics
- County
- Carteret County · 52,389 people
- City population
- 22,197
- Metro
- Morehead City, NC
- Population (ZIP)
- 22,197
- Household income
- $70,229
- Rent vs Own
- Severe rent burden
- 461.0
Population outlook (Carteret County) Hauer SSP2
- Today (2025)
- 73,443 people
- By 2030
- 75,344 · +2.6%
- By 2040
- 78,142 · +6.4%
- By 2050
- 80,091 · +9.1%
- By 2075
- 86,120 · +17.3%
- By 2100
- 89,408 · +21.7%
Race, ethnicity, and origin ACS 2023
- Neighborhood character
- Predominantly White (82%)
- Race & ethnicity
- White 82% Hispanic / Latino 7% Two or more races 6% Black 3% Asian 1%
- Hispanic origin (detail)
- Mexican 4%
- Common ancestry
- Slovak 3% Romanian 3% Lithuanian 2%
- Foreign-born
- 5% · Canada, Dominican Republic
- Languages at home
- 92% English-only · Spanish 6% German/W. Germanic 1%
Political lean MEDSL · Carteret
- 2024 margin
- Solid R (+43.1) · D 28.0% · R 71.1%
- 2008→2024 swing
- -8.4pp toward R · 2008: -34.7pp · 2024: -43.1pp
- All cycles
- 2024: R+43.1 2020: R+42.0 2016: R+44.5 2012: R+41.0 2008: R+34.7
Not yet ingested
- Civics
- —
Market trends
- HPI YoY
- ▼ -53.54%
- Current HPI
- 276.6589
- Rent YoY
- —
- Metro
- Morehead City, NC
- State GDP YoY
- ▲ 3.28%
- F500 in state
- 26
Industry mix (Fortune 500 HQ in NC)
| Industry | F500 HQs | Revenue |
|---|---|---|
| Financial Services | 2 | $213B |
|
||
| Retail | 2 | $95B |
|
||
| Industrial Conglomerate | 1 | $38B |
|
||
| Metals / Steel | 1 | $35B |
|
||
| Utilities | 1 | $30B |
|
||
| Industrial Machinery | 1 | $19B |
|
||
Price history
+918.5% since first listed28 events — show timeline
- 2026-04-04 Price Changed $275,000 Hive MLS
- 2026-01-08 Listed $295,000 Hive MLS
- 2025-10-16 Relisted — Hive MLS
- 2025-10-09 Pending — Hive MLS
- 2025-10-09 Listing Removed — Hive MLS
- 2025-09-30 Price Changed $285,000 Hive MLS
- 2025-09-02 Price Changed $290,000 Hive MLS
- 2025-06-30 Price Changed $295,000 Hive MLS
- 2025-06-18 Price Changed $305,000 Hive MLS
- 2025-06-10 Price Changed $310,000 Hive MLS
- 2025-05-21 Listed $320,000 Hive MLS
- 2025-05-04 Relisted — Hive MLS
- 2025-04-21 Pending — Hive MLS
- 2025-04-21 Listing Removed — Hive MLS
- 2025-01-02 Price Changed $310,000 Hive MLS
- 2024-12-05 Listed $325,000 Hive MLS
- 2016-10-31 Sold (Public Records) $175,000 Public Records
- 2014-04-13 Listing Removed — Hive MLS
- 2012-04-13 Listed $165,000 Hive MLS
- 2011-05-07 Listing Removed — Hive MLS
- 2010-05-05 Listed $165,000 Hive MLS
- 2009-07-23 Listing Removed — Hive MLS
- 2009-02-23 Listed $175,000 Hive MLS
- 2008-07-07 Listing Removed — Hive MLS
- 2007-09-24 Listed $189,900 Hive MLS
- 2005-08-31 Sold (MLS) $139,000 Hive MLS
- 2005-07-08 Listed $159,000 Hive MLS
- 2005-05-17 Sold (Public Records) $27,000 Public Records
Property tax history
+4.5%/yrLatest (2025): $1,334 · +30.3% YoY. Source: county tax records.
Cash-flow waterfall
monthlySold comps — $/sqft
last 12 mo · ≤1 miLoading sold comps…