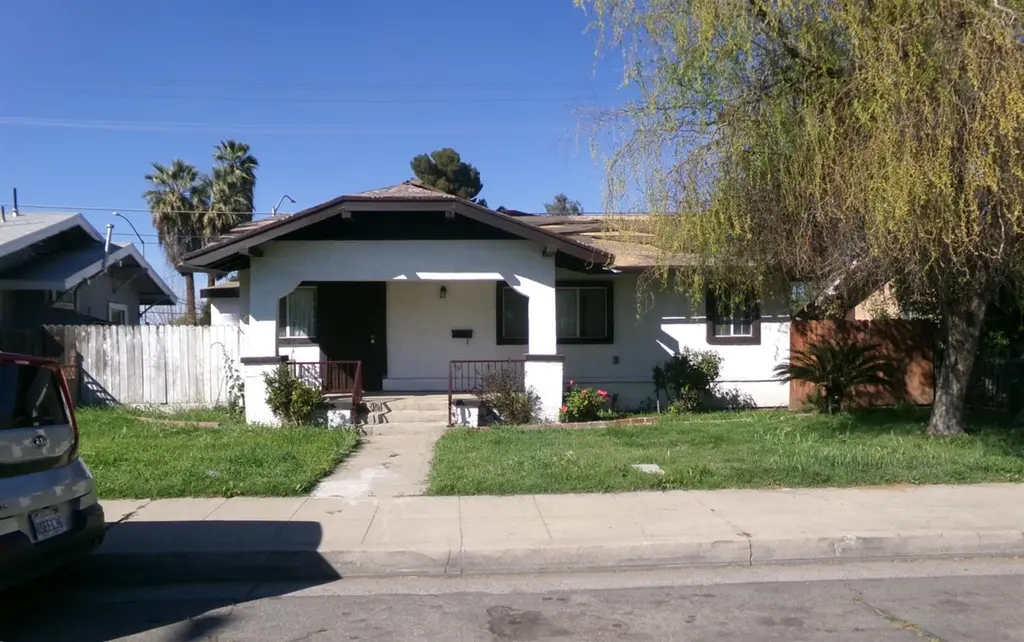
3927 E Verrue Ave · Fresno, CA
Flood risk 4/10 · Minor
- FEMA flood zone
- X (shaded)
- Chance of flooding over 30 yrs
- 0.22%
- Est. flood insurance / yr
- $507 – $1,088
Fire risk 1/10 · Minimal
- Est. fire insurance / yr
- $659 – $1,223
Heat risk 8/10 · Major
- Hot days now (above 105°F)
- 7 days/yr
- Hot days in 30 yrs
- 17 days/yr
Wind risk 1/10 · Minimal
- Chance of severe wind over 30 yrs
- —
Air-quality risk 10/10 · Severe
- Unhealthy air days now
- 40 days/yr
- Unhealthy air days in 30 yrs
- 44 days/yr
Risk factors via First Street. Map © Google.
Why this score? — see what drove the D+ grade
The composite is a weighted blend of 9 inputs, each scored 0–100. Each bar is that input's sub-score; the figure is the points it added to the 100-point composite (weight × sub-score).
- Cash flow +15.2/30.0
- ARV discount +15.0/15.0
- DSCR +4.7/10.0
- 1% rule +4.3/10.0
- Livability +3.1/5.0
- Schools +2.7/10.0
- Condition / age +2.5/5.0
- Rent growth +2.3/5.0
- Appreciation +0.0/10.0
$149,000
🖨 Deal sheet 📄 Offer letter ✓ Due diligence
Listing remarks MLS
Opportunity for first time home buyers or investors! This 2/1 home awaits some tender loving care. Don't miss your chance today!
Key facts
- 4,534 sq ft lot
- Built 1923
- Listed 17 days
Property features AI
Exterior
- Utilities: Electric service is off; Public sewer; Public utilities available
- Home design: Single-family residence
- Construction: Stucco exterior; Composition roof; Wood subfloor foundation; No residential solar
- Exterior features: One-level home; Urban lot setting; Lot dimensions approximately 54 x 84
Interior
- Flooring: Hardwood
- Bathrooms: 1 bathroom
- Heating & cooling: No cooling system listed
- Interior features: Hardwood flooring; Laundry inside the home
- Laundry & utility: Washer/dryer area inside the home
Neighborhood map
What this means for you Summary
Snapshot
- This is a 2-bed/1.0-bath single-family listed at $149k.
Deal economics
- At list price, monthly cash flow is $52 ($619/yr) — positive.
- The deal already cash-flows at list — no discount required.
- To meet the 1% rule (rent ≥ 1% of price), the offer needs to be $138k (7.2% below list).
- Recommended offer: $138k (7.2% below list) — sets the bar for 1% rule.
- Cap rate 6.7% vs local median 3.7% in Fresno — top-decile yield for the area; either an underpriced asset or a hidden risk that comps aren't pricing in. Stress-test before assuming the spread holds.
Location & tenants
- Location reads 62/100 on livability (#469 in CA) — a middle-class / working-renter tenant base. Strengths: commute A+, housing A+; Watch: amenities D+, employment D+, crime F.
- Fresno Unified (urban): math 18% / reading 47% proficiency, ranked #327 of 517 in CA (top 63%) — families likely to look elsewhere, expect single-tenant / working-renter base with shorter leases; 77% free/reduced lunch — lower-income household profile, screen leases tightly.
- Zoned schools: Jackson Elementary (357 students, 96% FRL); Tehipite Middle (481 students, 98% FRL); Roosevelt High (math 14% / reading 41%, grade F, #780 of 1,170 statewide, top 67%, 2,228 students, 92% FRL) — zoned schools average 95% FRL vs 77% district-wide (18 pts higher); higher-poverty schools than district average — tighter screening recommended.
- Market conditions: Rents soft (-0.9%/yr); 67 active listings in the ZIP; 13 comparable units currently listed for rent nearby; rentals at typical pace (median 21d on market — plan ~3-4 weeks tenant-placement turnaround); 2,426 units permitted in Fresno County in 2024 (296 in 5+ unit buildings).
- This rent runs 35% of the median local income ($47k/yr) — at the standard rent-burdened threshold; future hikes will face affordability resistance.
Forward outlook
- Local home prices are declining (-3.0%/yr); year-one equity from $1k of loan paydown is wiped out by about $4k of value loss. Plan a longer hold.
- Fresno County population projected at +11% by 2050 — modest demand growth; plan on rents tracking national, not racing it.
Negotiation context
- It's been on market 17 days — a 2% lower offer ($147k) is reasonable based on typical stale-listing flexibility.
- 5 sale attempts since 25y ago with the ask held roughly flat each time — persistent listings suggest the price (not the market) is what's stuck; bring a comps-based counter.
Risks & watch-outs
- Watch-outs: built in 1923 — expect roof / HVAC / electrical / plumbing capex.
- Climate carrying-cost: extreme-heat days projected 7→17/yr by 2055 (HVAC capex compounding) — expect insurance premiums to compound above CPI over the hold.
Questions for the listing agent
- Built in 1923 — when were the roof, HVAC, electrical panel, plumbing, and water heater last replaced?
- Is there a deadline driving the sale (1031 exchange, divorce, estate, relocation)? That informs how much negotiation room exists.
- Schools are D-rated, which usually means shorter tenancies and higher turnover. Who's the typical renter profile here, and what's been the actual vacancy rate?
- Crime grade is F in this area — have there been break-ins, vandalism, or insurance claims at this property in the last 3 years? What carrier currently insures it and at what premium?
- The area grade is low — what's the realistic commute time and amenity access for the typical tenant pool here? Any planned neighborhood developments (good or bad) we should know about?
- What's the average days-on-market for RENTAL listings here right now (not sales)? A rising rental-DOM trend means longer vacancies and softer asking-rent achievability than the comps imply.
- What's the recent tenant-quality profile in this submarket — average credit score on applications, eviction rate, late-payment / NSF rate, and stable-employment percentage? A property-management company in the area should have these aggregated.
- How much new for-sale + rental construction is in the pipeline within 1–3 miles? Heavy new supply typically softens prices + rents 12–24 months out; constrained supply supports both.
Investment metrics
- 1% rule
- 0.93% ✗
- Cap rate
- 6.71%
- Cash-on-cash
- 1.48%
- DSCR
- 1.07
- GRM
- 9.0
CMA / ARV
- ARV (on-the-fly)
- $248,036
- Comps found
- 12
Show comp detail 12 sales within ~0.75 mi
| Address | Dist | Beds/Ba | Sqft | Sold | Price | $/sf | Match |
|---|---|---|---|---|---|---|---|
| 108 N 9th St | 0.03mi | 2/1.0 | 1,000 (-5%) | 1mo | $162,500 | $163 | 89 |
| 3829 E Iowa Ave | 0.12mi | 2/1.0 | 1,004 (-4%) | 2mo | $230,000 | $229 | 85 |
| 3935 E Balch Ave | 0.32mi | 2/1.0 | 1,092 (+4%) | 1mo | $309,950 | $284 | 78 |
| 4151 E Platt Ave | 0.21mi | 3/2.0 (+1) | 1,080 (+3%) | 4mo | $190,000 | $176 | 73 |
| 4151 E Platt Ave | 0.21mi | 3/2.0 (+1) | 1,080 (+3%) | 4mo | $190,000 | $176 | 73 |
| 3844 E Balch | 0.36mi | 3/1.8 (+1) | 1,068 (+2%) | 2mo | $320,000 | $300 | 71 |
| 3539 E Mckenzie Ave | 0.45mi | 2/1.0 | 1,008 (-4%) | 5mo | $238,000 | $236 | 68 |
| 4332 E Ball Ave | 0.40mi | 2/1.0 | 957 (-9%) | 0mo | $210,000 | $219 | 66 |
| 4170 E Grant Ave | 0.42mi | 3/1.0 (+1) | 1,086 (+3%) | 6mo | $270,000 | $249 | 65 |
| 4104 E Madison Ave | 0.45mi | 3/2.0 (+1) | 1,088 (+4%) | 1mo | $299,900 | $276 | 63 |
| 3348 E Mckenzie Ave | 0.58mi | 2/2.0 | 1,005 (-4%) | 2mo | $265,000 | $264 | 60 |
| 3710 E Alta Ave | 0.74mi | 3/1.0 (+1) | 962 (-8%) | 1mo | $200,000 | $208 | 46 |
Match score weights: distance 35% · size 25% · config 20% · recency 20%. Top-matched comps best support the ARV.
Projected returns pro-forma
-3.0% appreciation · 0.0% rent growth · sell at horizon
- IRR
- -17.4%
- Equity multiple
- 0.40×
- Total profit
- $-24,883
- Equity at exit
- $22,216
- IRR
- -16.5%
- Equity multiple
- 0.21×
- Total profit
- $-32,987
- Equity at exit
- $12,883
Cash invested: $41,720 (down + closing). Projections, not guarantees.
Landlord ↔ Tenant lean methodology
- Overall (STATE)
- 18 Strongly Tenant-Friendly
- State California
- 18 Strongly Tenant-Friendly · D+13
- County
- — inherits STATE
- City
- — inherits STATE
ZIP-level market 93702
- Rents YoY
- -0.9%
- Active inventory
- 67
- Price-to-rent
- 9.0×
Monthly cashflow live
- Estimated rent
- $1,383 high interval (Pro) →
- Mortgage (P&I)
- −$781
- Tax from tax record
- −$198 /mo · $2,371/yr
- Insurance
- −$62
- HOA
- −$0
- Vacancy / Maint / Mgmt
- −$290
- Net cashflow
- $52
Break-even live
UW: 25.0% down · 7.5% · 30yr · 1.5% tax · 5.0% vac · 8.0% maint · 8.0% mgmt
Financing live
Cash to close
- Down payment
- $37,250
- Closing costs
- $4,470
- Reserves months
- —
- Total cash needed
- —
Loan-product check · same deal, 3 products live
Conventional
25% down · 7.5% · 30yr
- Down + closing
- —
- Monthly P&I
- —
- Monthly cashflow
- —
- DSCR
- —
- Eligible?
- —
Personal DTI + credit; lowest rate.
DSCR
20% down · 8.5% · 30yr
- Down + closing
- —
- Monthly P&I
- —
- Monthly cashflow
- —
- DSCR
- —
- Eligible?
- —
No personal income docs; deal must DSCR.
Hard money
10% down · 12.0% · 12mo
- Down + closing
- —
- Monthly P&I
- —
- Monthly cashflow
- —
- DSCR
- —
- Eligible?
- —
Short-term bridge; refi at stabilization.
Rent comps 13 comps
| Address | Beds | Baths | Sqft | Rent | $/sqft | DOM | Units | Dist |
|---|---|---|---|---|---|---|---|---|
| 3655 E Lowe Ave Apt 103 Fresno, CA | 3.0 | 2.0 | 850 | $1,500 | $1.76 | 21d | 1 | 0.79mi |
| 3033 E Platt Ave Fresno, CA | 2.0 | 1.0 | 975 | $1,016 | $1.04 | 1d | 1 | 0.82mi |
| 3568 E Lowe Ave Fresno, CA | 2.0 | 1.0 | 946 | $1,600 | $1.69 | 14d | 1 | 0.85mi |
| 4530 E Thomas Ave Apt 202 Fresno, CA | 2.0 | 1.0 | 950 | $1,250 | $1.32 | 43d | 1 | 0.89mi |
| 2995 E Nevada Ave Apt D Fresno, CA | 2.0 | 1.0 | 850 | $1,150 | $1.35 | 43d | 1 | 0.91mi |
| 429 S Backer Ave Unit 204 Fresno, CA | 3.0 | 1.5 | 952 | $1,750 | $1.84 | 15d | 1 | 0.92mi |
| 293 S Callisch Ave Unit 224-110F Fresno, CA | 1.0 | 1.0 | 780 | $1,095 | $1.40 | 11d | 1 | 0.93mi |
| 3154 E Montecito Ave Fresno, CA | 2.0 | 1.0 | 1240 | $1,800 | $1.45 | 23d | 1 | 0.95mi |
| 3254 E Olive Ave Apt D Fresno, CA | 2.0 | 1.0 | 750 | $1,300 | $1.73 | 21d | 1 | 1.17mi |
| 2881 Huntington Blvd #101 Fresno, CA | 1.0 | 1.0 | 860 | $1,295 | $1.51 | 11d | 1 | 1.22mi |
| 4710 E Harvey Ave Fresno, CA | 3.0 | 1.0 | 1372 | $1,675 | $1.22 | 21d | 1 | 1.27mi |
| 4860 E Lane Ave Fresno, CA | 1.0–2.0 | 1.0 | 740 | $1,495 | $2.02 | 23d | 2 | 1.48mi |
| 4860 E Lane Ave Fresno, CA | 2.0 | 1.0 | 914 | $1,495 | $1.64 | 2d | 1 | 1.48mi |
Listing history 20 events
-
2026-06-05statusdays on market $149,000 Pending 17 DOM
-
2026-06-03days on market $149,000 Pending Accepting Backups 16 DOM
-
2026-06-02days on market $149,000 Pending Accepting Backups 15 DOM
-
2026-06-02status $149,000 Pending Accepting Backups 14 DOM
-
2026-06-01days on market $149,000 Active 14 DOM
-
2026-05-31days on market $149,000 Active 13 DOM
-
2026-05-18$149,000 Active
-
2024-10-22price $181,100 131-char remark
Show marketing remark (128 chars)
Opportunity for first time home buyers or investors! This 2/1 home awaits some tender loving care. Don't miss your chance today!
-
2024-10-22price $181,100 128-char remark
Show marketing remark (128 chars)
Opportunity for first time home buyers or investors! This 2/1 home awaits some tender loving care. Don't miss your chance today!
-
2024-10-22soldstatus $181,100 Closed 131-char remark
Show marketing remark (128 chars)
Opportunity for first time home buyers or investors! This 2/1 home awaits some tender loving care. Don't miss your chance today!
-
2024-10-22soldstatus $181,100 Closed 128-char remark
Show marketing remark (128 chars)
Opportunity for first time home buyers or investors! This 2/1 home awaits some tender loving care. Don't miss your chance today!
-
2024-06-21$199,950 Active 131-char remark
Show marketing remark (128 chars)
Opportunity for first time home buyers or investors! This 2/1 home awaits some tender loving care. Don't miss your chance today!
-
2024-06-21$199,950 Active 128-char remark
Show marketing remark (128 chars)
Opportunity for first time home buyers or investors! This 2/1 home awaits some tender loving care. Don't miss your chance today!
-
2020-10-26price $160,000
-
2020-10-08$176,080 Active
-
2001-04-06soldstatus $52,500
-
2001-04-06soldstatus $52,500
-
2001-01-21historical
-
2001-01-11$52,500
-
1975-04-22soldstatus $15,000
ⓘ Source: listings_history table (triggers on properties + properties_extension) + one-shot
backfill from property_details.listing_events for pre-trigger history.
Tax reassessment forecast CA · Resets to sale price
- Current annual tax
- $2,371 · $198/mo
- Projected year-2 tax
- $2,371 · $198/mo
- Expected delta
- $0/yr ($0/mo · 0.0%)
ⓘ Screening estimate from a state-policy table — verify with the county assessor before closing.
Climate risk First Street
- Flood 4/10 Moderate FEMA zone X (shaded) · 22% chance over 30 yrs
- Wildfire 1/10 Low
- Heat 8/10 Severe 7 d/yr ≥105°F today · 17 d/yr by 30 yrs out
- Wind 1/10 Low
- Air quality 10/10 Extreme 40 unhealthy d/yr today · 44 by 30 yrs out
Nearby sold comps map
Loading sold comps map…
Walkable amenities ~0.75 mi
Loading nearby amenities…
Taxation est. · year 1
- Rental income
- $16,597
- − Mortgage interest
- −$8,346
- − Property taxes
- −$2,371
- − Insurance
- −$745
- − Repairs & maintenance
- −$1,328
- − Management
- −$1,328
- − Depreciation
- −$4,335
- Taxable loss
- −$1,855
- Est. tax savings @ 24.0%
- +$445
- After-tax cash flow
- $1,065/yr
For passive investors: Depreciation is non-cash, so a rental often shows a tax loss while cash-flowing — sheltering income. Rental losses are passive: they offset passive income freely, and up to $25,000/yr can offset ordinary (W-2) income if you actively participate and your MAGI is under $100k (phasing out to $0 by $150k); unused losses carry forward. On sale, claimed depreciation is recaptured at up to 25%, and gains may owe capital-gains tax (a 1031 exchange can defer both). Figures are a year-1 estimate at your 24.0% rate — not tax advice; consult a CPA.
Schools (NCES district)
- District
- Fresno Unified
- NCES district ID
- 0614550
- Math proficiency
- 18% ▼ -12.00%
- Reading proficiency
- 47% ▲ 9.00%
- Median HH income
- $36,095
- Composite
- 26.83/100
- National rank
- #7111
- State rank
- #327 of 517 in CA
Livability — Fresno
- Score
- 62/100
- State rank
- #469
- US rank
- #15907
Category grades
Schools grade is shown separately in the Schools card above.
Census & demographics
- Census place
- Fresno, CA
- County
- Fresno County · 834,801 people
- City population
- 593,114
- Metro
- Fresno, CA
- Population (ZIP)
- 43,875
- Household income
- $47,229
- Rent vs Own
- Severe rent burden
- 2958.0
Population outlook (Fresno County) Hauer SSP2
- Today (2025)
- 1,042,971 people
- By 2030
- 1,072,198 · +2.8%
- By 2040
- 1,122,408 · +7.6%
- By 2050
- 1,157,251 · +11.0%
- By 2075
- 1,182,575 · +13.4%
- By 2100
- 1,105,899 · +6.0%
Race, ethnicity, and origin ACS 2023
- Neighborhood character
- Predominantly Hispanic (75%)
- Race & ethnicity
- Hispanic / Latino 75% Two or more races 26% Asian 10% White 7% Black 4% Native American 2%
- Hispanic origin (detail)
- Mexican 71%
- Foreign-born
- 27% · Canada
- Languages at home
- 35% English-only · Spanish 54% Other Asian/Pacific 9%
Political lean MEDSL · Fresno
- 2024 margin
- Toss-up / Even · D 46.5% · R 50.9% · Other 2.6%
- 2008→2024 swing
- -6.5pp toward R · 2008: 2.1pp · 2024: -4.4pp
- All cycles
- 2024: R+4.4 2020: D+7.8 2016: D+3.9 2012: R+2.9 2008: D+2.1
Not yet ingested
- Civics
- —
Market trends
- HPI YoY
- ▼ -255.81%
- Current HPI
- 467.2799
- Rent YoY
- ▼ -0.94%
- Metro
- Fresno, CA
- State GDP YoY
- ▲ 3.21%
- F500 in state
- 116
Industry mix (Fortune 500 HQ in CA)
| Industry | F500 HQs | Revenue |
|---|---|---|
| Technology | 27 | $1,492B |
|
||
| Financial Services | 3 | $174B |
|
||
| Retail | 3 | $44B |
|
||
| Insurance | 3 | $26B |
|
||
| Media / Entertainment | 2 | $115B |
|
||
| Pharmaceuticals / Biotech | 2 | $62B |
|
||
Price history
+893.3% since first listed14 events — show timeline
- 2026-05-18 Listed $149,000 FRESNOMLS
- 2024-10-22 Price Changed $181,100 TCMLS
- 2024-10-22 Price Changed $181,100 FRESNOMLS
- 2024-10-22 Sold (MLS) $181,100 FRESNOMLS
- 2024-10-22 Sold (MLS) $181,100 TCMLS
- 2024-06-21 Listed $199,950 TCMLS
- 2024-06-21 Listed $199,950 FRESNOMLS
- 2020-10-26 Price Changed $160,000 FRESNOMLS
- 2020-10-08 Listed $176,080 FRESNOMLS
- 2001-04-06 Sold (Public Records) $52,500 Public Records
- 2001-04-06 Sold (MLS) $52,500 FRESNOMLS
- 2001-01-21 Delisted — FRESNOMLS
- 2001-01-11 Listed $52,500 FRESNOMLS
- 1975-04-22 Sold (Public Records) $15,000 Public Records
Property tax history
+10.1%/yrLatest (2025): $2,371 · +17.9% YoY. Source: county tax records.
Cash-flow waterfall
monthlySold comps — $/sqft
last 12 mo · ≤1 miLoading sold comps…