 🏢 Co-op
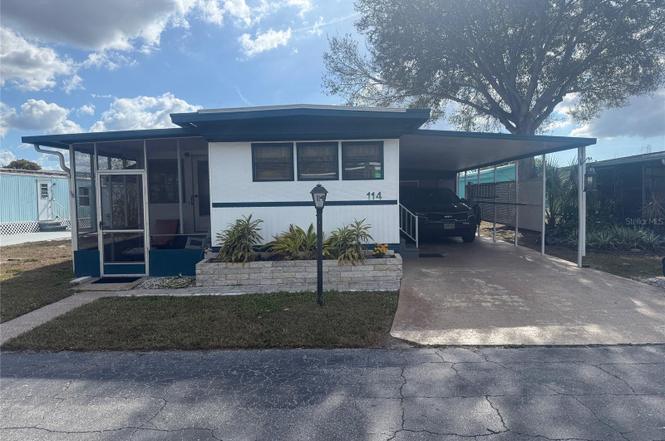
420 49th St E #114 · Memphis, FL
Flood risk 4/10 · Minor
- FEMA flood zone
- X (unshaded)
- Chance of flooding over 30 yrs
- 0.22%
- Est. flood insurance / yr
- $507 – $1,088
Fire risk 1/10 · Minimal
- Est. fire insurance / yr
- $947 – $1,759
Heat risk 10/10 · Severe
- Hot days now (above 107°F)
- 7 days/yr
- Hot days in 30 yrs
- 29 days/yr
Wind risk 10/10 · Severe
- Chance of severe wind over 30 yrs
- 99.0%
Air-quality risk 3/10 · Minor
- Unhealthy air days now
- 2 days/yr
- Unhealthy air days in 30 yrs
- 3 days/yr
Risk factors via First Street. Map © Google.
Why this score? — see what drove the B- grade
The composite is a weighted blend of 9 inputs, each scored 0–100. Each bar is that input's sub-score; the figure is the points it added to the 100-point composite (weight × sub-score).
- Cash flow +30.0/30.0
- 1% rule +10.0/10.0
- DSCR +10.0/10.0
- ARV discount +7.5/15.0
- Schools +4.4/10.0
- Livability +3.2/5.0
- Condition / age +2.5/5.0
- Rent growth +1.8/5.0
- Appreciation +0.0/10.0
$59,000
🖨 Deal sheet 📄 Offer letter ✓ Due diligence
Listing remarks
Nestled within Skyway Village Estates, a resident-owned cooperative community, Unit 114 on L Street offers a peaceful setting and an easy, low-maintenance lifestyle. Located on a quiet interior street, this home provides a relaxed atmosphere with convenient access to community amenities. The 3/2 interior features comfortable living spaces filled with natural light, while two enclosed lanais extend the living area and create inviting spaces for relaxing or entertaining. Both bathrooms have been updated, adding a fresh, functional touch to the home. The layout offers flexibility to personalize and make it your own. Additional exterior features may include a carport and storage for everyday c
Key facts
- Flexible layout
- Carport
- Updated bathrooms
Tags
Property features AI
Finance
- Other: Partially furnished; Lease restrictions apply
- HOA & community: Has HOA (monthly fee $611); Association amenities: Clubhouse, Pool, Shuffleboard court; Association fee includes common area taxes, pool, insurance, grounds maintenance, management, sewer, trash, water; Association approval required; Community features: Association recreation (lease), Buyer approval required, Clubhouse, Golf carts OK, Pool, Sidewalks; Senior community; Pets allowed (cats and dogs; number and size limits apply; max pet weight 20 lbs)
Exterior
- Parking: Carport (1 space)
- Utilities: Public sewer; Water connected; Electricity connected; Cable connected; Sewer connected; Water source: None listed
- Home design: Residential mobile home (single wide); One story; Faces east; Entry level: 1
- Construction: Vinyl siding; Other roof type; Slab foundation; Built as single wide mobile home
- Exterior features: Awnings; Outdoor grill; Private mailbox; Sidewalk
Interior
- Kitchen: Microwave; Range; Refrigerator
- Bedrooms: 3 bedrooms
- Bathrooms: 1 full bath; 1 half bath
- Heating & cooling: Central heating; Central air conditioning
- Interior features: Built-in features; Eat-in kitchen; Living room / dining room combo; 8 total rooms
- Laundry & utility: Laundry room; Washer; Dryer; Other laundry feature
Neighborhood map
What this means for you Summary
Snapshot
- This is a 3-bed/1.5-bath condo listed at $59k.
Deal economics
- At list price, monthly cash flow is $863 ($10k/yr) — positive.
- The deal already cash-flows at list — no discount required.
- Meets the 1% rule at list price ($2k rent vs $59k).
- Recommended offer: $52k (12.0% below list) — sets the bar for market timing.
- Cap rate 23.8% vs local median 4.5% in Memphis — top-decile yield for the area; either an underpriced asset or a hidden risk that comps aren't pricing in. Stress-test before assuming the spread holds.
Location & tenants
- Location reads 63/100 on livability (#745 in FL) — a middle-class / working-renter tenant base. Strengths: cost of living A+, housing A+; Watch: employment D+, schools F, amenities F.
- Manatee (suburban): math 54% / reading 50% proficiency, ranked #26 of 73 in FL (top 36%) — acceptable for families but not a draw, mixed tenant base, ~2y average lease.
- Market conditions: Rents soft (-3.0%/yr); 1160 active listings in the ZIP; 2 comparable units currently listed for rent nearby; solid renter incomes; 7,472 units permitted in Manatee County in 2024 (1,782 in 5+ unit buildings).
- This rent runs 36% of the median local income ($78k/yr) — at the standard rent-burdened threshold; future hikes will face affordability resistance.
Forward outlook
- Local home prices are declining (-3.0%/yr); year-one equity from $408 of loan paydown is wiped out by about $2k of value loss. Plan a longer hold.
- Manatee County population projected at +43% by 2050 — long-run rental-demand tailwind backs the buy-and-hold thesis.
- At projected returns (-3.0% appreciation + 0.0% rent growth), your $17k cash investment doubles in ~2 years — after that, you're playing with house money.
Negotiation context
- It's been on market 162 days — a 12% lower offer ($52k) is reasonable based on typical stale-listing flexibility.
Risks & watch-outs
- Watch-outs: HOA is 26% of rent.
- Climate carrying-cost: severe wind risk, 99% chance of damaging wind over 30y; extreme-heat days projected 7→29/yr by 2055 (HVAC capex compounding) — expect insurance premiums to compound above CPI over the hold.
Questions for the listing agent
- It's been on market 162 days. Have you received any prior offers? Is the seller open to a 12% concession, seller financing, or rate buy-down credit?
- Built in 1969 — when were the roof, HVAC, electrical panel, plumbing, and water heater last replaced?
- What does the HOA fee cover, when was the last increase, and are there any pending special assessments or reserve-fund shortfalls?
- Any open or pending special assessments — roof, HVAC, plumbing, elevator, façade? What's the per-unit balance and payoff schedule, and is the seller paying it off at close or rolling it to the buyer?
- Why hasn't it sold? Are there any deal-killer items the seller is aware of (foundation, flood, title, zoning, code violations)?
- Is there a deadline driving the sale (1031 exchange, divorce, estate, relocation)? That informs how much negotiation room exists.
- Schools are F-rated, which usually means shorter tenancies and higher turnover. Who's the typical renter profile here, and what's been the actual vacancy rate?
- What's the average days-on-market for RENTAL listings here right now (not sales)? A rising rental-DOM trend means longer vacancies and softer asking-rent achievability than the comps imply.
- What's the recent tenant-quality profile in this submarket — average credit score on applications, eviction rate, late-payment / NSF rate, and stable-employment percentage? A property-management company in the area should have these aggregated.
- How much new apartment / multifamily construction is in the pipeline within 1–3 miles? Heavy new supply (>2% of stock underway) typically softens rents 12–24 months out; light construction supports rent growth.
Investment metrics
- 1% rule
- 3.99% ✓
- Cap rate
- 23.85%
- Cash-on-cash
- 62.69%
- DSCR
- 3.79
- GRM
- 2.1
CMA / ARV
No comps found within radius.
Projected returns pro-forma
-3.0% appreciation · 0.0% rent growth · sell at horizon
- IRR
- 56.8%
- Equity multiple
- 3.36×
- Total profit
- $38,907
- Equity at exit
- $8,797
- IRR
- 60.2%
- Equity multiple
- 5.82×
- Total profit
- $79,611
- Equity at exit
- $5,101
Cash invested: $16,520 (down + closing). Projections, not guarantees.
Landlord ↔ Tenant lean methodology
- Overall (STATE)
- 87 Strongly Landlord-Friendly
- State Florida
- 87 Strongly Landlord-Friendly · R+3
- County
- — inherits STATE
- City
- — inherits STATE
ZIP-level market 34221
- Rents YoY
- -3.0%
- Active inventory
- 1160
- Price-to-rent
- 2.1×
Monthly cashflow live
- Estimated rent
- $2,355 medium interval (Pro) →
- Mortgage (P&I)
- −$309
- Tax from tax record
- −$52 /mo · $626/yr
- Insurance
- −$25
- HOA
- −$611
- Vacancy / Maint / Mgmt
- −$494
- Net cashflow
- $863
Break-even live
UW: 25.0% down · 7.5% · 30yr · 1.5% tax · 5.0% vac · 8.0% maint · 8.0% mgmt
Financing live
Cash to close
- Down payment
- $14,750
- Closing costs
- $1,770
- Reserves months
- —
- Total cash needed
- —
Loan-product check · same deal, 3 products live
Conventional
25% down · 7.5% · 30yr
- Down + closing
- —
- Monthly P&I
- —
- Monthly cashflow
- —
- DSCR
- —
- Eligible?
- —
Personal DTI + credit; lowest rate.
DSCR
20% down · 8.5% · 30yr
- Down + closing
- —
- Monthly P&I
- —
- Monthly cashflow
- —
- DSCR
- —
- Eligible?
- —
No personal income docs; deal must DSCR.
Hard money
10% down · 12.0% · 12mo
- Down + closing
- —
- Monthly P&I
- —
- Monthly cashflow
- —
- DSCR
- —
- Eligible?
- —
Short-term bridge; refi at stabilization.
Rent comps 2 comps
| Address | Beds | Baths | Sqft | Rent | $/sqft | DOM | Units | Dist |
|---|---|---|---|---|---|---|---|---|
| 515 45th St E Palmetto, FL | 2.0 | 2.0 | 900 | $2,100 | $2.33 | 23d | 1 | 0.52mi |
| 709 45th St E Palmetto, FL | 2.0 | 2.0 | 1000 | $1,550 | $1.55 | 3d | 1 | 0.58mi |
HOA detail condo
- Monthly dues
- $611 · $7,332/yr
- Assessments
- None detected in remarks — confirm with the listing agent.
Listing history 22 events
-
2026-06-18days on market $59,000 Active 162 DOM
-
2026-06-17days on market $59,000 Active 161 DOM
-
2026-06-16days on market $59,000 Active 160 DOM
-
2026-06-15days on market $59,000 Active 159 DOM
-
2026-06-13days on market $59,000 Active 157 DOM
-
2026-06-13days on market $59,000 Active 156 DOM
-
2026-06-10days on market $59,000 Active 154 DOM
-
2026-06-09days on market $59,000 Active 153 DOM
-
2026-06-08days on market $59,000 Active 152 DOM
-
2026-06-08days on market $59,000 Active 151 DOM
-
2026-06-03days on market $59,000 Active 147 DOM
-
2026-06-02days on market $59,000 Active 146 DOM
-
2026-06-01days on market $59,000 Active 145 DOM
-
2026-05-31days on market $59,000 Active 144 DOM
-
2026-05-13price $64,900
-
2026-04-17price $69,500
-
2026-03-11price $75,000
-
2026-02-25price $80,000
-
2026-02-25price $84,750
-
2026-02-11price $85,000
-
2026-01-22price $90,000
-
2026-01-07$100,000 Active
ⓘ Source: listings_history table (triggers on properties + properties_extension) + one-shot
backfill from property_details.listing_events for pre-trigger history.
Tax reassessment forecast FL · Resets to sale price
- Current annual tax
- $626 · $52/mo
- Projected year-2 tax
- $626 · $52/mo
- Expected delta
- $0/yr ($0/mo · 0.0%)
ⓘ Screening estimate from a state-policy table — verify with the county assessor before closing.
Climate risk First Street
- Flood 4/10 Moderate FEMA zone X (unshaded) · 22% chance over 30 yrs
- Wildfire 1/10 Low
- Heat 10/10 Extreme 7 d/yr ≥107°F today · 29 d/yr by 30 yrs out
- Wind 10/10 Extreme 99% chance of damaging wind over 30 yrs
- Air quality 3/10 Moderate 2 unhealthy d/yr today · 3 by 30 yrs out
Nearby sold comps map
Loading sold comps map…
Walkable amenities ~0.75 mi
Loading nearby amenities…
Taxation est. · year 1
- Rental income
- $28,256
- − Mortgage interest
- −$3,305
- − Property taxes
- −$626
- − Insurance
- −$295
- − Repairs & maintenance
- −$2,261
- − Management
- −$2,261
- − HOA
- −$7,332
- − Depreciation
- −$1,716
- Taxable income
- $10,461
- Est. tax owed @ 24.0%
- −$2,511
- After-tax cash flow
- $7,846/yr
For passive investors: Depreciation is non-cash, so a rental often shows a tax loss while cash-flowing — sheltering income. Rental losses are passive: they offset passive income freely, and up to $25,000/yr can offset ordinary (W-2) income if you actively participate and your MAGI is under $100k (phasing out to $0 by $150k); unused losses carry forward. On sale, claimed depreciation is recaptured at up to 25%, and gains may owe capital-gains tax (a 1031 exchange can defer both). Figures are a year-1 estimate at your 24.0% rate — not tax advice; consult a CPA.
Schools (NCES district)
- District
- Manatee
- NCES district ID
- 1201230
- Math proficiency
- 54% ▼ -6.00%
- Reading proficiency
- 50% ▼ -2.00%
- Median HH income
- $49,607
- Composite
- 44.43/100
- National rank
- #2806
- State rank
- #26 of 73 in FL
Livability — Memphis
- Score
- 63/100
- State rank
- #745
- US rank
- #16072
Category grades
Schools grade is shown separately in the Schools card above.
Census & demographics
- County
- Manatee County · 416,364 people
- Metro
- North Port-Sarasota-Bradenton, FL
- Population (ZIP)
- 56,208
- Household income
- $77,712
- Rent vs Own
- Severe rent burden
- 1193.0
Population outlook (Manatee County) Hauer SSP2
- Today (2025)
- 447,342 people
- By 2030
- 488,911 · +9.3%
- By 2040
- 567,934 · +27.0%
- By 2050
- 637,995 · +42.6%
- By 2075
- 781,970 · +74.8%
- By 2100
- 848,272 · +89.6%
Race, ethnicity, and origin ACS 2023
- Neighborhood character
- Diverse neighborhood (Simpson 0.58)
- Race & ethnicity
- White 59% Hispanic / Latino 22% Black 14% Two or more races 11%
- Hispanic origin (detail)
- Mexican 14% Puerto Rican 3%
- Common ancestry
- Romanian 2% Lithuanian 2% Italian 2%
- Foreign-born
- 10% · Canada, Dominican Republic, Jamaica
- Languages at home
- 81% English-only · Spanish 16% Other Indo-European 1%
Political lean MEDSL · Manatee
- 2024 margin
- Strong R (+23.5) · D 37.9% · R 61.4%
- 2008→2024 swing
- -16.5pp toward R · 2008: -7.0pp · 2024: -23.5pp
- All cycles
- 2024: R+23.5 2020: R+16.1 2016: R+17.1 2012: R+12.5 2008: R+7.0
Not yet ingested
- Civics
- —
Market trends
- HPI YoY
- ▼ -383.53%
- Current HPI
- 302.1458
- Rent YoY
- ▼ -2.98%
- Metro
- North Port-Sarasota-Bradenton, FL
- State GDP YoY
- ▲ 3.28%
- F500 in state
- 36
Industry mix (Fortune 500 HQ in FL)
| Industry | F500 HQs | Revenue |
|---|---|---|
| Industrial Technology | 2 | $29B |
|
||
| Insurance | 2 | $17B |
|
||
| Retail | 1 | $60B |
|
||
| Technology Distribution | 1 | $58B |
|
||
| Homebuilding | 1 | $35B |
|
||
| Technology Manufacturing | 1 | $35B |
|
||
Price history
-35.1% since first listed8 events — show timeline
- 2026-05-13 Price Changed $64,900 Stellar MLS as Distributed by MLS Grid
- 2026-04-17 Price Changed $69,500 Stellar MLS as Distributed by MLS Grid
- 2026-03-11 Price Changed $75,000 Stellar MLS as Distributed by MLS Grid
- 2026-02-25 Price Changed $80,000 Stellar MLS as Distributed by MLS Grid
- 2026-02-25 Price Changed $84,750 Stellar MLS as Distributed by MLS Grid
- 2026-02-11 Price Changed $85,000 Stellar MLS as Distributed by MLS Grid
- 2026-01-22 Price Changed $90,000 Stellar MLS as Distributed by MLS Grid
- 2026-01-07 Listed $100,000 Stellar MLS as Distributed by MLS Grid
Property tax history
+4.0%/yrLatest (2025): $626 · +6.6% YoY. Source: county tax records.
Cash-flow waterfall
monthlySold comps — $/sqft
last 12 mo · ≤1 miLoading sold comps…