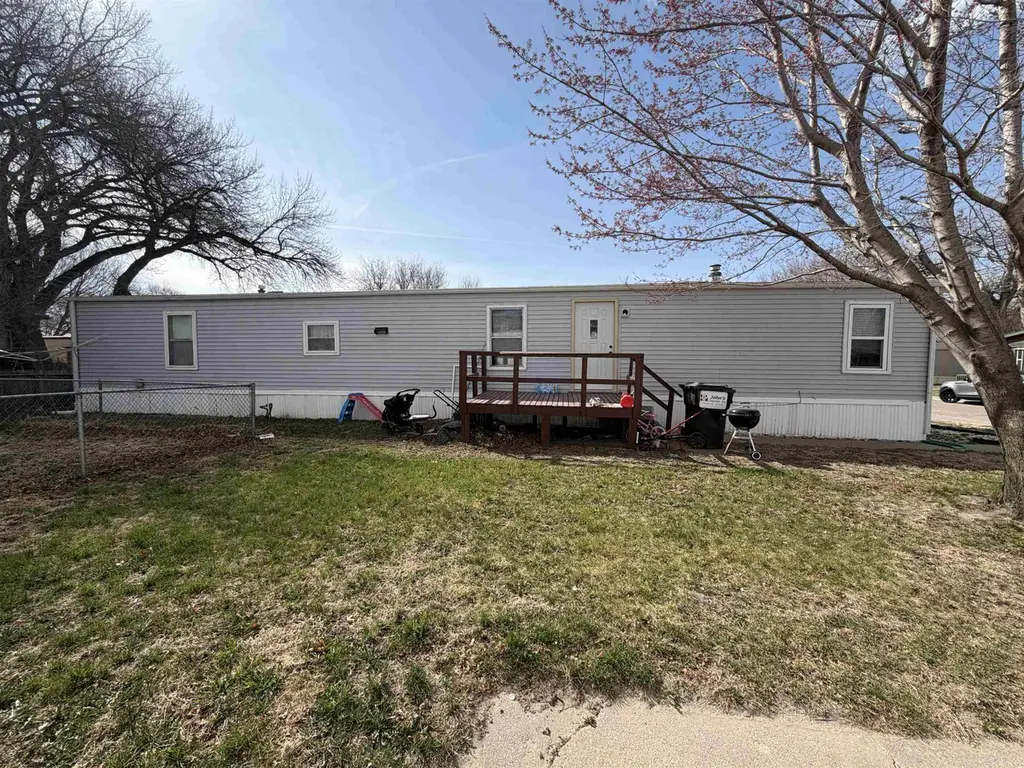
803 15th St · Norfolk, NE
Flood risk No data
- FEMA flood zone
- —
- Chance of flooding over 30 yrs
- —
- Est. flood insurance / yr
- —
Fire risk No data
- Est. fire insurance / yr
- —
Heat risk 3/10 · Minor
- Hot days now (above threshold)
- 7 days/yr
- Hot days in 30 yrs
- 15 days/yr
Wind risk No data
- Chance of severe wind over 30 yrs
- —
Air-quality risk 2/10 · Minimal
- Unhealthy air days now
- 1 days/yr
- Unhealthy air days in 30 yrs
- 1 days/yr
Risk factors via First Street. Map © Google.
Why this score? — see what drove the B grade
The composite is a weighted blend of 9 inputs, each scored 0–100. Each bar is that input's sub-score; the figure is the points it added to the 100-point composite (weight × sub-score).
- Cash flow +30.0/30.0
- 1% rule +10.0/10.0
- DSCR +10.0/10.0
- ARV discount +7.6/15.0
- Livability +3.9/5.0
- Schools +3.8/10.0
- Rent growth +3.3/5.0
- Condition / age +2.5/5.0
- Appreciation +0.0/10.0
$35,000
🖨 Deal sheet 📄 Offer letter ✓ Due diligence
Listing remarks MLS
Affordable 3 Bed / 2 Bath Home Elkhorn Mobile Home Park! Looking for comfort, convenience, and affordability? This charming 3-bedroom, 2-bath home located in the heart of Norfolk Mobile Home Park is the perfect opportunity! Enjoy a bright and welcoming layout with spacious living areas, ideal for relaxing or entertaining. The home features an equipped kitchen with appliances, durable vinyl flooring, and gas heating for year-round comfort. Washer and dryer hookups add everyday convenience, along with on-site parking. Location: 800s 15th St, Norfolk, NE 68701 Close to shopping, dining, and entertainment—everything you need just minutes away! Price: $38,000 (Cash) Lot Rent: $475/month includes trash Important: Home must remain in the park for at least 5 years. New buyer need to be approved by mobile home park manager.
Key facts
- Built 1985
- Listed 79 days
Neighborhood map
What this means for you Summary
Snapshot
- This is a 3-bed/2.0-bath manufactured listed at $35k.
Deal economics
- At list price, monthly cash flow is $872 ($10k/yr) — positive.
- The deal already cash-flows at list — no discount required.
- Meets the 1% rule at list price ($1k rent vs $35k).
- Recommended offer: $33k (6.0% below list) — sets the bar for market timing.
- Cap rate 36.2% vs local median 3.2% in Norfolk — top-decile yield for the area; either an underpriced asset or a hidden risk that comps aren't pricing in. Stress-test before assuming the spread holds.
Location & tenants
- Location reads 78/100 on livability (#54 in NE, #2,611 nationally) — a middle-class / working-renter tenant base. Strengths: cost of living A+, housing A+, health & safety A+; Watch: employment C-, amenities F, commute F.
- Norfolk Public Schools (town): math 44% / reading 46% proficiency, ranked #84 of 111 in NE (top 76%) — families likely to look elsewhere, expect single-tenant / working-renter base with shorter leases.
- Market conditions: Rents rising (+3.3%/yr); 230 active listings in the ZIP; 1 comparable units currently listed for rent nearby; 270 units permitted in Madison County in 2024 (196 in 5+ unit buildings).
Forward outlook
- Local home prices are declining (-3.0%/yr); year-one equity from $242 of loan paydown is wiped out by about $1k of value loss. Plan a longer hold.
- At projected returns (-3.0% appreciation + 3.3% rent growth), your $10k cash investment doubles in ~2 years — after that, you're playing with house money.
Negotiation context
- It's been on market 80 days — a 6% lower offer ($33k) is reasonable based on typical stale-listing flexibility.
Questions for the listing agent
- It's been on market 80 days. Have you received any prior offers? Is the seller open to a 6% concession, seller financing, or rate buy-down credit?
- Why hasn't it sold? Are there any deal-killer items the seller is aware of (foundation, flood, title, zoning, code violations)?
- Is there a deadline driving the sale (1031 exchange, divorce, estate, relocation)? That informs how much negotiation room exists.
- Schools are B-rated — typically a magnet for longer-tenancy family renters. What's the average tenant stay here, and is there a school-zone premium baked into asking?
- What's the average days-on-market for RENTAL listings here right now (not sales)? A rising rental-DOM trend means longer vacancies and softer asking-rent achievability than the comps imply.
- What's the recent tenant-quality profile in this submarket — average credit score on applications, eviction rate, late-payment / NSF rate, and stable-employment percentage? A property-management company in the area should have these aggregated.
- How much new for-sale + rental construction is in the pipeline within 1–3 miles? Heavy new supply typically softens prices + rents 12–24 months out; constrained supply supports both.
Investment metrics
- 1% rule
- 3.92% ✓
- Cap rate
- 36.18%
- Cash-on-cash
- 106.74%
- DSCR
- 5.75
- GRM
- 2.1
CMA / ARV
- ARV (median comp)
- $35,081
- List price
- $35,000
- Delta
- -0.23%
- Verdict
- FAIR
- Comps
- 3 within 1.0 mi
Show comp detail 6 sales within ~0.75 mi
| Address | Dist | Beds/Ba | Sqft | Sold | Price | $/sf | Match |
|---|---|---|---|---|---|---|---|
| 920 15th St | 0.15mi | 2/1.0 (-1) | 960 (+1%) | 16mo | $50,000 | $52 | 69 |
| 918 14th Pl | 0.14mi | 2/1.0 (-1) | 1,008 (+6%) | 10mo | $4,500 | $4 | 66 |
| 904 14th Pl | 0.06mi | 2/1.0 (-1) | 896 (-6%) | 18mo | $22,000 | $25 | 64 |
| 1310 Bluff Ave | 0.13mi | 3/2.0 | 1,056 (+11%) | 19mo | $48,000 | $45 | 60 |
| 906 15th St | 0.06mi | 2/1.0 (-1) | 1,088 (+14%) | 11mo | $40,000 | $37 | 55 |
| 2004 Parker Cir | 0.33mi | 3/1.0 | 840 (-12%) | 8mo | $50,000 | $60 | 55 |
Match score weights: distance 35% · size 25% · config 20% · recency 20%. Top-matched comps best support the ARV.
Projected returns pro-forma
-3.0% appreciation · 3.31% rent growth · sell at horizon
- IRR
- —
- Equity multiple
- 6.13×
- Total profit
- $50,277
- Equity at exit
- $5,219
- IRR
- —
- Equity multiple
- 12.94×
- Total profit
- $117,046
- Equity at exit
- $3,026
Cash invested: $9,800 (down + closing). Projections, not guarantees.
Landlord ↔ Tenant lean methodology
- Overall (STATE)
- 83 Strongly Landlord-Friendly
- State Nebraska
- 83 Strongly Landlord-Friendly · R+13
- County
- — inherits STATE
- City
- — inherits STATE
ZIP-level market 68701
- Rents YoY
- 3.3%
- Active inventory
- 230
- Price-to-rent
- 2.1×
Monthly cashflow live
- Estimated rent
- $1,371 medium interval (Pro) →
- Mortgage (P&I)
- −$184
- Tax from tax record
- −$13 /mo · $157/yr
- Insurance
- −$15
- HOA
- −$0
- Vacancy / Maint / Mgmt
- −$288
- Net cashflow
- $872
Break-even live
UW: 25.0% down · 7.5% · 30yr · 1.5% tax · 5.0% vac · 8.0% maint · 8.0% mgmt
Financing live
Cash to close
- Down payment
- $8,750
- Closing costs
- $1,050
- Reserves months
- —
- Total cash needed
- —
Loan-product check · same deal, 3 products live
Conventional
25% down · 7.5% · 30yr
- Down + closing
- —
- Monthly P&I
- —
- Monthly cashflow
- —
- DSCR
- —
- Eligible?
- —
Personal DTI + credit; lowest rate.
DSCR
20% down · 8.5% · 30yr
- Down + closing
- —
- Monthly P&I
- —
- Monthly cashflow
- —
- DSCR
- —
- Eligible?
- —
No personal income docs; deal must DSCR.
Hard money
10% down · 12.0% · 12mo
- Down + closing
- —
- Monthly P&I
- —
- Monthly cashflow
- —
- DSCR
- —
- Eligible?
- —
Short-term bridge; refi at stabilization.
Rent comps 1 comps
| Address | Beds | Baths | Sqft | Rent | $/sqft | DOM | Units | Dist |
|---|---|---|---|---|---|---|---|---|
| 1805 Parker Cir Norfolk, NE | 2.0 | 1.0 | 700 | $1,095 | $1.56 | 43d | 1 | 0.24mi |
Listing history 17 events
-
2026-06-19days on market $35,000 Active 80 DOM
-
2026-06-18days on market $35,000 Active 79 DOM
-
2026-06-17days on market $35,000 Active 78 DOM
-
2026-06-16days on market $35,000 Active 77 DOM
-
2026-06-15days on market $35,000 Active 76 DOM
-
2026-06-14days on market $35,000 Active 74 DOM
-
2026-06-12days on market $35,000 Active 73 DOM
-
2026-06-09days on market $35,000 Active 70 DOM
-
2026-06-08days on market $35,000 Active 69 DOM
-
2026-06-07days on market $35,000 Active 68 DOM
-
2026-06-05days on market $35,000 Active 65 DOM
-
2026-06-03days on market $35,000 Active 64 DOM
-
2026-06-02days on market $35,000 Active 63 DOM
-
2026-06-01days on market $35,000 Active 62 DOM
-
2026-05-31days on market $35,000 Active 61 DOM
-
2026-05-30days on market $35,000 Active 60 DOM
-
2026-03-30$38,000 Active 833-char remark
Show marketing remark (833 chars)
Affordable 3 Bed / 2 Bath Home Elkhorn Mobile Home Park! Looking for comfort, convenience, and affordability? This charming 3-bedroom, 2-bath home located in the heart of Norfolk Mobile Home Park is the perfect opportunity! Enjoy a bright and welcoming layout with spacious living areas, ideal for relaxing or entertaining. The home features an equipped kitchen with appliances, durable vinyl flooring, and gas heating for year-round comfort. Washer and dryer hookups add everyday convenience, along with on-site parking. Location: 800s 15th St, Norfolk, NE 68701 Close to shopping, dining, and entertainment—everything you need just minutes away! Price: $38,000 (Cash) Lot Rent: $475/month includes trash Important: Home must remain in the park for at least 5 years. New buyer need to be approved by mobile home park manager.
ⓘ Source: listings_history table (triggers on properties + properties_extension) + one-shot
backfill from property_details.listing_events for pre-trigger history.
Tax reassessment forecast NE · Resets to sale price
- Current annual tax
- $157 · $13/mo
- Projected year-2 tax
- $606 · $50/mo
- Expected delta
- +$449/yr (+$37/mo · 286.4%)
ⓘ Screening estimate from a state-policy table — verify with the county assessor before closing.
Climate risk First Street
- Heat 3/10 Moderate
- Air quality 2/10 Low 1 unhealthy d/yr today · 1 by 30 yrs out
Nearby sold comps map
Loading sold comps map…
Walkable amenities ~0.75 mi
Loading nearby amenities…
Taxation est. · year 1
- Rental income
- $16,449
- − Mortgage interest
- −$1,961
- − Property taxes
- −$157
- − Insurance
- −$175
- − Repairs & maintenance
- −$1,316
- − Management
- −$1,316
- − Depreciation
- −$1,018
- Taxable income
- $10,506
- Est. tax owed @ 24.0%
- −$2,522
- After-tax cash flow
- $7,939/yr
For passive investors: Depreciation is non-cash, so a rental often shows a tax loss while cash-flowing — sheltering income. Rental losses are passive: they offset passive income freely, and up to $25,000/yr can offset ordinary (W-2) income if you actively participate and your MAGI is under $100k (phasing out to $0 by $150k); unused losses carry forward. On sale, claimed depreciation is recaptured at up to 25%, and gains may owe capital-gains tax (a 1031 exchange can defer both). Figures are a year-1 estimate at your 24.0% rate — not tax advice; consult a CPA.
Schools (NCES district)
- District
- Norfolk Public Schools
- NCES district ID
- 3174430
- Math proficiency
- 44% ▼ -7.00%
- Reading proficiency
- 46% ▼ -7.00%
- Median HH income
- $46,579
- Composite
- 38.31/100
- National rank
- #4227
- State rank
- #84 of 111 in NE
Livability — Norfolk
- Score
- 78/100
- State rank
- #54
- US rank
- #2611
Category grades
Schools grade is shown separately in the Schools card above.
Census & demographics
- Census place
- Norfolk, NE
- County
- Madison County · 31,417 people
- City population
- 31,417
- Metro
- Norfolk, NE
- Population (ZIP)
- 31,417
- Household income
- $62,633
- Rent vs Own
- Severe rent burden
- 861.0
Population outlook (Madison County) Hauer SSP2
- Today (2025)
- 35,536 people
- By 2030
- 35,518 · -0.1%
- By 2040
- 35,170 · -1.0%
- By 2050
- 34,606 · -2.6%
- By 2075
- 34,522 · -2.9%
- By 2100
- 34,307 · -3.5%
Race, ethnicity, and origin ACS 2023
- Neighborhood character
- Predominantly White (80%)
- Race & ethnicity
- White 80% Hispanic / Latino 14% Two or more races 9% Native American 1% Black 1%
- Hispanic origin (detail)
- Mexican 11% Cuban 1%
- Common ancestry
- Portuguese 2% Romanian 1% Lithuanian 1%
- Foreign-born
- 6% · Canada
- Languages at home
- 90% English-only · Spanish 9%
Political lean MEDSL · Madison
- 2024 margin
- Solid R (+56.0) · D 21.4% · R 77.4% · Other 1.2%
- 2008→2024 swing
- -16.8pp toward R · 2008: -39.2pp · 2024: -56.0pp
- All cycles
- 2024: R+56.0 2020: R+53.5 2016: R+56.3 2012: R+48.1 2008: R+39.2
Not yet ingested
- Civics
- —
Market trends
- HPI YoY
- ▼ -172.61%
- Current HPI
- 260.5574
- Rent YoY
- ▲ 3.31%
- Metro
- Norfolk, NE
- State GDP YoY
- ▲ 0.68%
- F500 in state
- 2
Industry mix (Fortune 500 HQ in NE)
| Industry | F500 HQs | Revenue |
|---|---|---|
| Conglomerate | 1 | $371B |
|
||
Price history
1 event — show timeline
- 2026-03-30 Listed $38,000 NNEMLS
Property tax history
-7.4%/yrLatest (2025): $157 · -4.3% YoY. Source: county tax records.
Cash-flow waterfall
monthlySold comps — $/sqft
last 12 mo · ≤1 miLoading sold comps…