101644 Overseas Hwy · Key Largo, FL
Flood risk No data
- FEMA flood zone
- —
- Chance of flooding over 30 yrs
- —
- Est. flood insurance / yr
- —
Fire risk No data
- Est. fire insurance / yr
- —
Heat risk No data
- Hot days now (above threshold)
- —
- Hot days in 30 yrs
- —
Wind risk No data
- Chance of severe wind over 30 yrs
- —
Air-quality risk No data
- Unhealthy air days now
- —
- Unhealthy air days in 30 yrs
- —
Risk factors via First Street. Map © Google.
Why this score? — see what drove the D+ grade
The composite is a weighted blend of 9 inputs, each scored 0–100. Each bar is that input's sub-score; the figure is the points it added to the 100-point composite (weight × sub-score).
- Cash flow +15.0/30.0
- ARV discount +7.5/15.0
- 1% rule +5.0/10.0
- DSCR +5.0/10.0
- Schools +4.6/10.0
- Livability +3.6/5.0
- Rent growth +3.2/5.0
- Condition / age +2.5/5.0
- Appreciation +0.0/10.0
$70,000
🖨 Deal sheet (PDF) 📄 Offer letter ✓ Due diligence
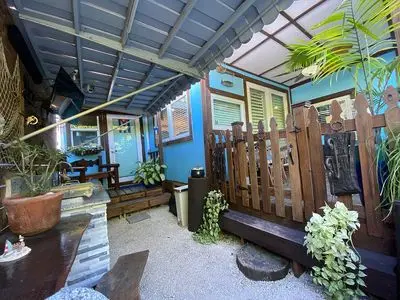
Listing remarks
Beautiful manufactured home in Florida keys, completely renovated, technology update (everything work w/ Alexa commands) & acirc; & euro; & brvbar; fully high quality furniture, brand new TVs and all stainless steel appliances, both ACs were replaced this year, impact door and windows w/ new shades, including a golf cart & acirc; & euro; & brvbar; just bring your clothes and star living the Florida keys dream & acirc; & euro; & brvbar; .. we don & acirc; & euro; & trade; t own the land , mouthy payment is 1400 all inclusive. The park has boat ramp and marina so you can keep your boat at the water, we have 2 parking spaces please call me to 786
Key facts
- Completely renovated
- Technology update
- Boat ramp
Tags
Neighborhood map
What this means for you Summary
Snapshot
- This is a 3-bed/2.0-bath other listed at $70k.
Deal economics
- At list price, monthly cash flow is $2k ($28k/yr) — positive.
- The deal already cash-flows at list — no discount required.
- Meets the 1% rule at list price ($4k rent vs $70k).
- Cap rate 46.8% vs local median 1.5% in Key Largo — top-decile yield for the area; either an underpriced asset or a hidden risk that comps aren't pricing in. Stress-test before assuming the spread holds.
Location & tenants
- Location reads 72/100 on livability (#337 in FL) — a middle-class / working-renter tenant base. Strengths: crime A+, health & safety A+, employment B; Watch: amenities F, cost of living F.
- Monroe (town): math 50% / reading 55% proficiency, ranked #23 of 73 in FL (top 32%) — acceptable for families but not a draw, mixed tenant base, ~2y average lease.
- Market conditions: Rents rising (+2.9%/yr); 430 active listings in the ZIP; solid renter incomes; 332 units permitted in Monroe County in 2024 (42 in 5+ unit buildings).
- At $3,603/mo this rent would consume 50% of the median local household income ($87k/yr) (locally 265% of renters already pay >50% of income on rent) — very limited rent-growth headroom before tenants either downsize or default.
Forward outlook
- Local home prices are declining (-3.0%/yr); year-one equity from $484 of loan paydown is wiped out by about $2k of value loss. Plan a longer hold.
- Monroe County population projected at +28% by 2050 — long-run rental-demand tailwind backs the buy-and-hold thesis.
- At projected returns (-3.0% appreciation + 2.9% rent growth), your $20k cash investment doubles in ~1 year — after that, you're playing with house money.
Negotiation context
- Only 14 days on market — expect competitive offers; lowballing is unlikely to land.
- 12 sale attempts since 24y ago with the ask held roughly flat each time — persistent listings suggest the price (not the market) is what's stuck; bring a comps-based counter.
Questions for the listing agent
- Is there a deadline driving the sale (1031 exchange, divorce, estate, relocation)? That informs how much negotiation room exists.
- The area grade is low — what's the realistic commute time and amenity access for the typical tenant pool here? Any planned neighborhood developments (good or bad) we should know about?
- What's the average days-on-market for RENTAL listings here right now (not sales)? A rising rental-DOM trend means longer vacancies and softer asking-rent achievability than the comps imply.
- What's the recent tenant-quality profile in this submarket — average credit score on applications, eviction rate, late-payment / NSF rate, and stable-employment percentage? A property-management company in the area should have these aggregated.
- How much new for-sale + rental construction is in the pipeline within 1–3 miles? Heavy new supply typically softens prices + rents 12–24 months out; constrained supply supports both.
Investment metrics
- 1% rule
- 5.15% ✓
- Cap rate
- 46.80%
- Cash-on-cash
- 144.66%
- DSCR
- 7.44
- GRM
- 1.6
CMA / ARV
No comps found within radius.
Projected returns pro-forma
-3.0% appreciation · 2.92% rent growth · sell at horizon
- IRR
- —
- Equity multiple
- 8.09×
- Total profit
- $138,912
- Equity at exit
- $10,437
- IRR
- —
- Equity multiple
- 17.01×
- Total profit
- $313,776
- Equity at exit
- $6,052
Cash invested: $19,600 (down + closing). Projections, not guarantees.
Landlord ↔ Tenant lean methodology
- Overall (STATE)
- 87 Strongly Landlord-Friendly
- State Florida
- 87 Strongly Landlord-Friendly · R+3
- County
- — inherits STATE
- City
- — inherits STATE
ZIP-level market 33037
- Rents YoY
- 2.9%
- Active inventory
- 430
- Price-to-rent
- 1.6×
Monthly cashflow live
- Estimated rent
- $3,603 medium interval (Pro) →
- Mortgage (P&I)
- −$367
- Tax est. 1.5%
- −$88 /mo · $1,050/yr
- Insurance
- −$29
- HOA
- −$0
- Vacancy / Maint / Mgmt
- −$757
- Net cashflow
- $2,363
Break-even live
Sensitivity live
| Price | -10% $2,411 | -5% $2,387 | +0% $2,363 | +5% $2,339 | +10% $2,314 |
|---|---|---|---|---|---|
| Rent | -10% $2,078 | -5% $2,221 | +0% $2,363 | +5% $2,505 | +10% $2,647 |
| Rate | -1.0pp $2,398 | -0.5pp $2,381 | base $2,363 | +0.5pp $2,345 | +1.0pp $2,326 |
UW: 25.0% down · 7.5% · 30yr · 1.5% tax · 5.0% vac · 8.0% maint · 8.0% mgmt
Financing live
Cash to close
- Down payment
- $17,500
- Closing costs
- $2,100
- Reserves months
- —
- Total cash needed
- —
Loan-product check · same deal, 3 products live
Conventional
25% down · 7.5% · 30yr
- Down + closing
- —
- Monthly P&I
- —
- Monthly cashflow
- —
- DSCR
- —
- Eligible?
- —
Personal DTI + credit; lowest rate.
DSCR
20% down · 8.5% · 30yr
- Down + closing
- —
- Monthly P&I
- —
- Monthly cashflow
- —
- DSCR
- —
- Eligible?
- —
No personal income docs; deal must DSCR.
Hard money
10% down · 12.0% · 12mo
- Down + closing
- —
- Monthly P&I
- —
- Monthly cashflow
- —
- DSCR
- —
- Eligible?
- —
Short-term bridge; refi at stabilization.
Listing history 12 events
-
2026-06-19days on market $70,000 Active 14 DOM
-
2026-06-18days on market $70,000 Active 13 DOM
-
2026-06-17days on market $70,000 Active 12 DOM
-
2026-06-16days on market $70,000 Active 11 DOM
-
2026-06-15days on market $70,000 Active 10 DOM
-
2026-06-14days on market $70,000 Active 8 DOM
-
2026-06-13days on market $70,000 Active 7 DOM
-
2026-06-10days on market $70,000 Active 5 DOM
-
2026-06-09days on market $70,000 Active 4 DOM
-
2026-06-08days on market $70,000 Active 3 DOM
-
2026-06-07remarks 651-char remark
-
2026-06-07$70,000 Active 2 DOM
ⓘ Source: listings_history table (triggers on properties + properties_extension) + one-shot
backfill from property_details.listing_events for pre-trigger history.
Nearby sold comps map
Loading sold comps map…
Walkable amenities ~0.75 mi
Loading nearby amenities…
Taxation est. · year 1
- Rental income
- $43,239
- − Mortgage interest
- −$3,921
- − Property taxes
- −$1,050
- − Insurance
- −$350
- − Repairs & maintenance
- −$3,459
- − Management
- −$3,459
- − Depreciation
- −$2,036
- Taxable income
- $28,964
- Est. tax owed @ 24.0%
- −$6,951
- After-tax cash flow
- $21,403/yr
For passive investors: Depreciation is non-cash, so a rental often shows a tax loss while cash-flowing — sheltering income. Rental losses are passive: they offset passive income freely, and up to $25,000/yr can offset ordinary (W-2) income if you actively participate and your MAGI is under $100k (phasing out to $0 by $150k); unused losses carry forward. On sale, claimed depreciation is recaptured at up to 25%, and gains may owe capital-gains tax (a 1031 exchange can defer both). Figures are a year-1 estimate at your 24.0% rate — not tax advice; consult a CPA.
Schools (NCES district)
- District
- Monroe
- NCES district ID
- 1201320
- Math proficiency
- 50% ▼ -14.00%
- Reading proficiency
- 55% ▼ -6.00%
- Median HH income
- $56,955
- Composite
- 45.51/100
- National rank
- #2608
- State rank
- #23 of 73 in FL
Livability — Key Largo
- Score
- 72/100
- State rank
- #337
- US rank
- #5850
Category grades
Schools grade is shown separately in the Schools card above.
Census & demographics
- Census place
- Key Largo, FL
- County
- Monroe County · 66,185 people
- City population
- 14,770
- Metro
- Key West, FL
- Population (ZIP)
- 14,770
- Household income
- $86,533
- Rent vs Own
- Severe rent burden
- 265.0
Population outlook (Monroe County) Hauer SSP2
- Today (2025)
- 90,706 people
- By 2030
- 96,308 · +6.2%
- By 2040
- 106,565 · +17.5%
- By 2050
- 116,500 · +28.4%
- By 2075
- 141,423 · +55.9%
- By 2100
- 151,947 · +67.5%
Race, ethnicity, and origin ACS 2023
- Neighborhood character
- Predominantly White (69%)
- Race & ethnicity
- White 69% Hispanic / Latino 26% Two or more races 16% Black 3%
- Hispanic origin (detail)
- Mexican 2% Puerto Rican 1% Cuban 17%
- Common ancestry
- Lithuanian 5% Romanian 3% Slovak 2%
- Foreign-born
- 21% · Canada, Jamaica
- Languages at home
- 79% English-only · Spanish 20% German/W. Germanic 1% Other Indo-European 1%
Political lean MEDSL · Monroe
- 2024 margin
- R (+18.3) · D 40.5% · R 58.8%
- 2008→2024 swing
- -23.2pp toward R · 2008: 4.9pp · 2024: -18.3pp
- All cycles
- 2024: R+18.3 2020: R+7.9 2016: R+6.9 2012: D+0.4 2008: D+4.9
Not yet ingested
- Civics
- —
Market trends
- HPI YoY
- ▼ -369.26%
- Current HPI
- 193.7864
- Rent YoY
- ▲ 2.92%
- Metro
- Key West, FL
- State GDP YoY
- ▲ 3.28%
- F500 in state
- 36
Industry mix (Fortune 500 HQ in FL)
| Industry | F500 HQs | Revenue |
|---|---|---|
| Industrial Technology | 2 | $29B |
|
||
| Insurance | 2 | $17B |
|
||
| Retail | 1 | $60B |
|
||
| Technology Distribution | 1 | $58B |
|
||
| Homebuilding | 1 | $35B |
|
||
| Technology Manufacturing | 1 | $35B |
|
||
Price history
-80.0% since first listed27 events — show timeline
- 2026-06-06 Listed $70,000 FSBO.com
- 2025-01-18 Listing Removed — FLKMLS
- 2024-12-16 Listing Removed — MARMLS
- 2024-12-14 Listing Removed — MARMLS
- 2024-12-04 Listed $100,000 MARMLS
- 2024-09-14 Listed $65,000 MARMLS
- 2024-09-14 Listed $65,000 FLKMLS
- 2024-08-14 Listing Removed — MARMLS
- 2024-05-16 Listed $75,000 MARMLS
- 2024-03-01 Listing Removed — FLKMLS
- 2024-02-19 Contingent — FLKMLS
- 2023-12-05 Listed $59,500 FLKMLS
- 2020-05-15 Listing Removed — FLKMLS
- 2020-05-15 Listing Removed — FLKMLS
- 2015-11-24 Listing Removed — FLKMLS
- 2015-11-24 Listing Removed — FLKMLS
- 2014-10-03 Sold (Public Records) $1,868,000 Public Records
- 2007-07-01 Listed $70,000 FLKMLS
- 2006-05-15 Listing Removed — FLKMLS
- 2006-03-24 Listed $225,000 FLKMLS
- 2005-11-30 Listed $850,000 FLKMLS
- 2005-11-10 Listed $349,000 FLKMLS
- 2005-06-24 Listed $258,000 FLKMLS
- 2003-11-13 Sold (MLS) $55,000 FLKMLS
- 2002-06-25 Listed $69,900 FLKMLS
- 1997-12-05 Sold (Public Records) $645,000 Public Records
- 1982-01-01 Sold (Public Records) $350,000 Public Records
Property tax history
+10.0%/yrLatest (2025): $30,730 · +16.6% YoY. Source: county tax records.
Cash-flow waterfall
monthlySold comps — $/sqft
last 12 mo · ≤1 miLoading sold comps…